Live Canva preview with animations and transitions
Check Out This Illustrated Cause & Effect Infographic
Discover our Blue Illustrated Cause and Effect Fishbone Infographic. Easy to edit, fully customizable, and completely free to use. Try it now!
Template Details
Perfect for business professionals, this dynamic blue infographic is designed to help you visually map out cause and effect relationships with ease. Ideal for project management, root cause analysis, and strategic planning, this visually engaging tool ensures your data is clear and compelling. Customize it to fit your needs and elevate your presentations, making complex information digestible and actionable.
Template Features
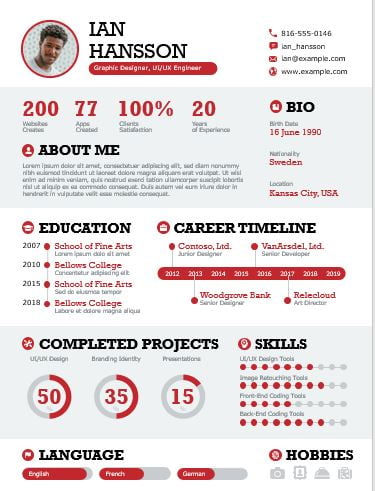
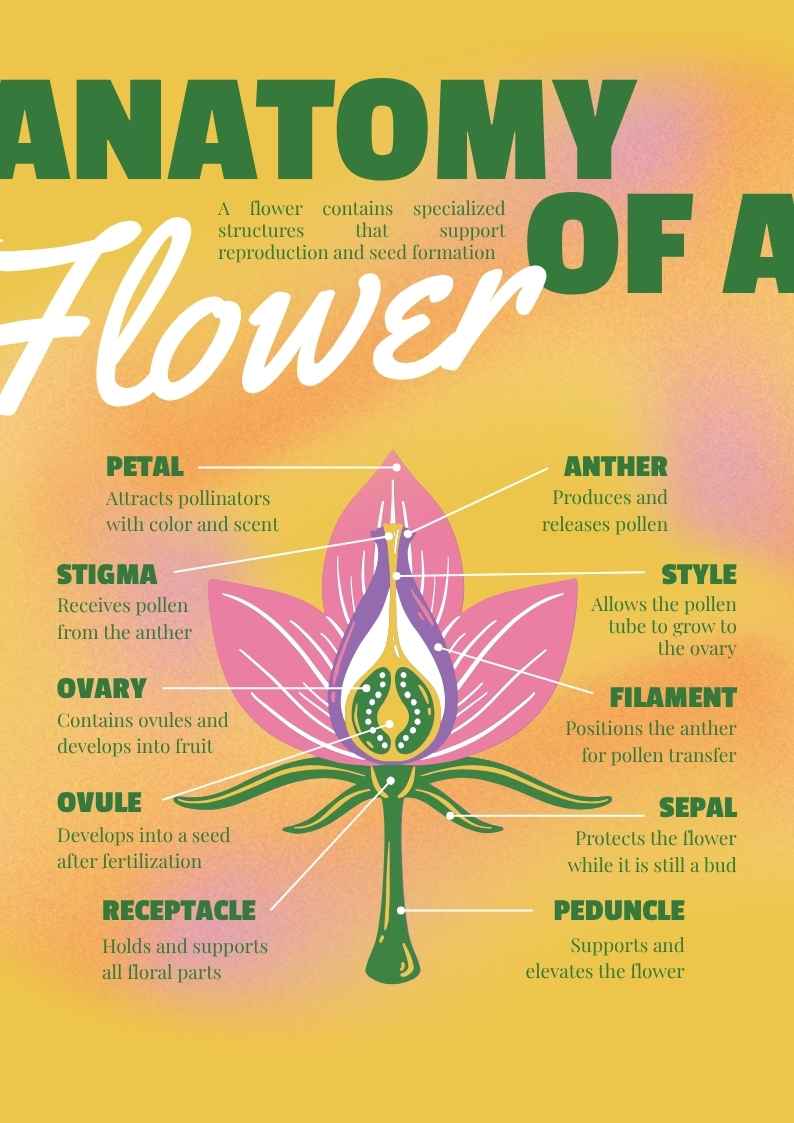
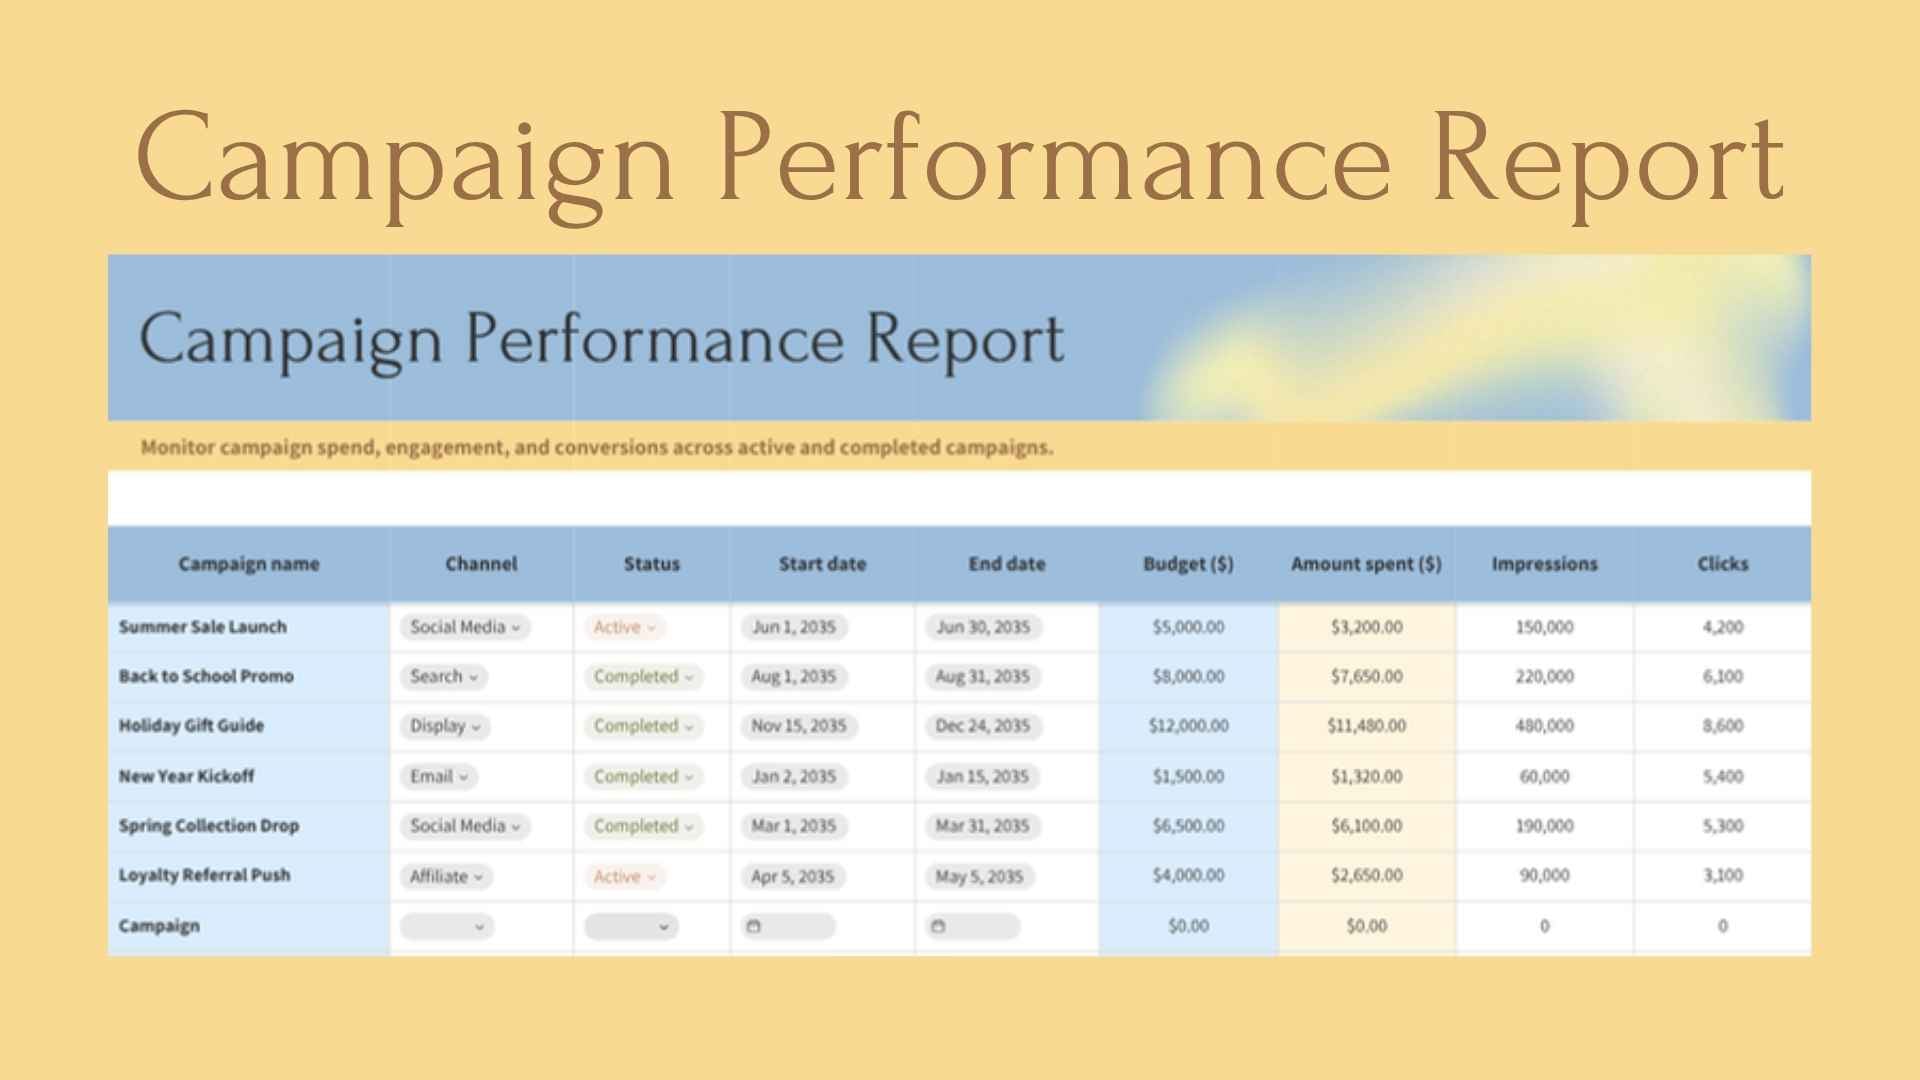
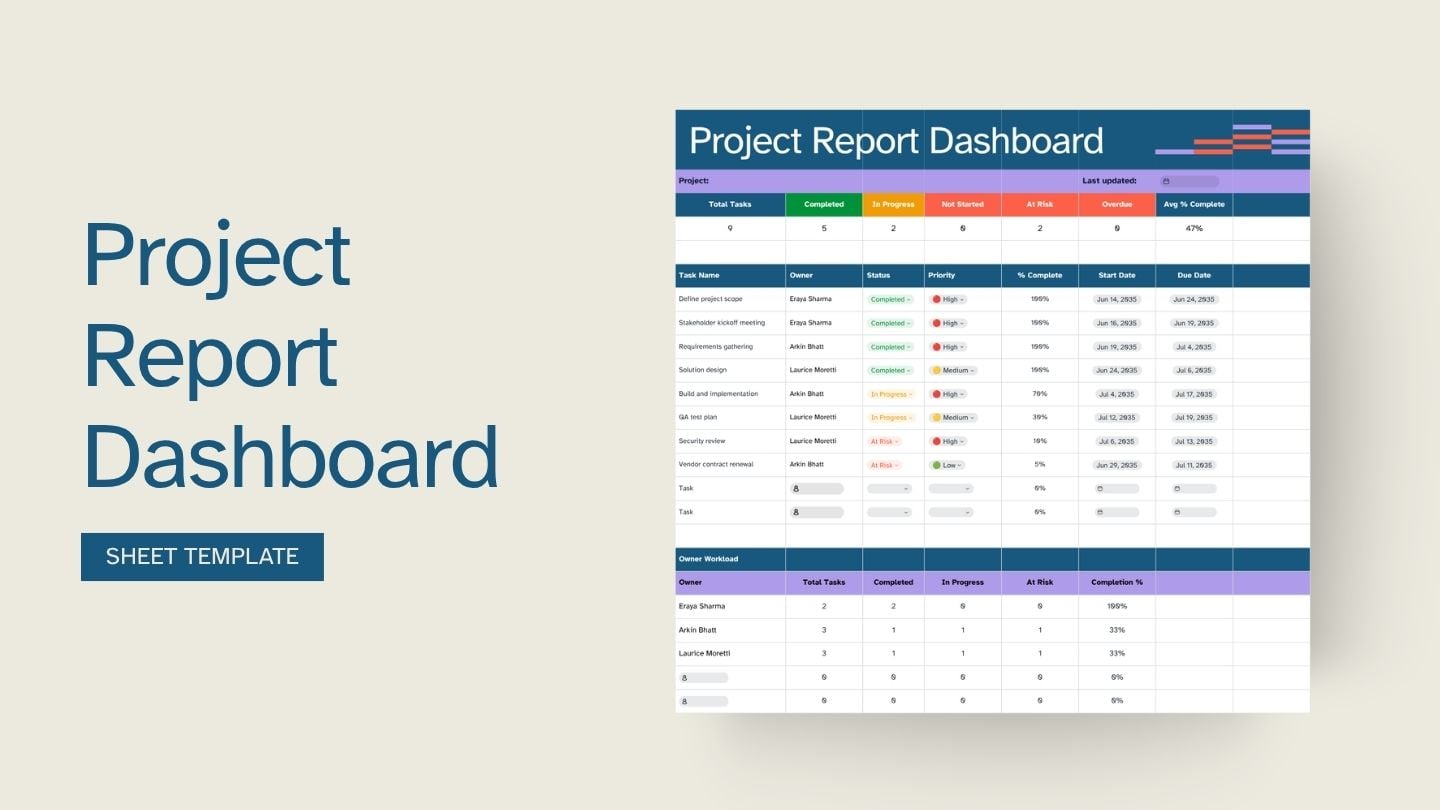
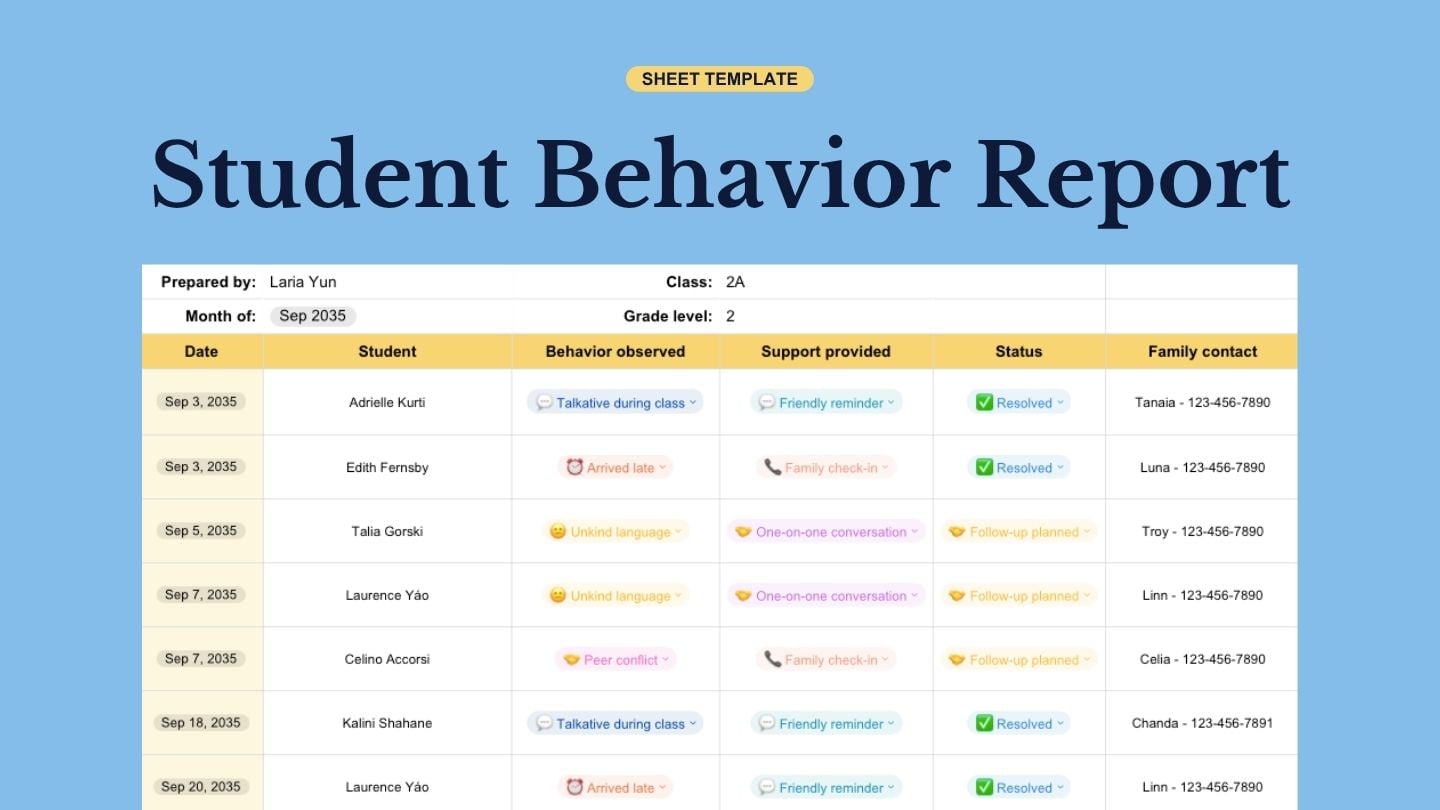
- 3 ready-to-use A4 infographics completely customizable to suit your needs
- Hundreds of charts, frames, lines and shapes to choose from
- Handy animation and transition features for each infographics