 100% Free
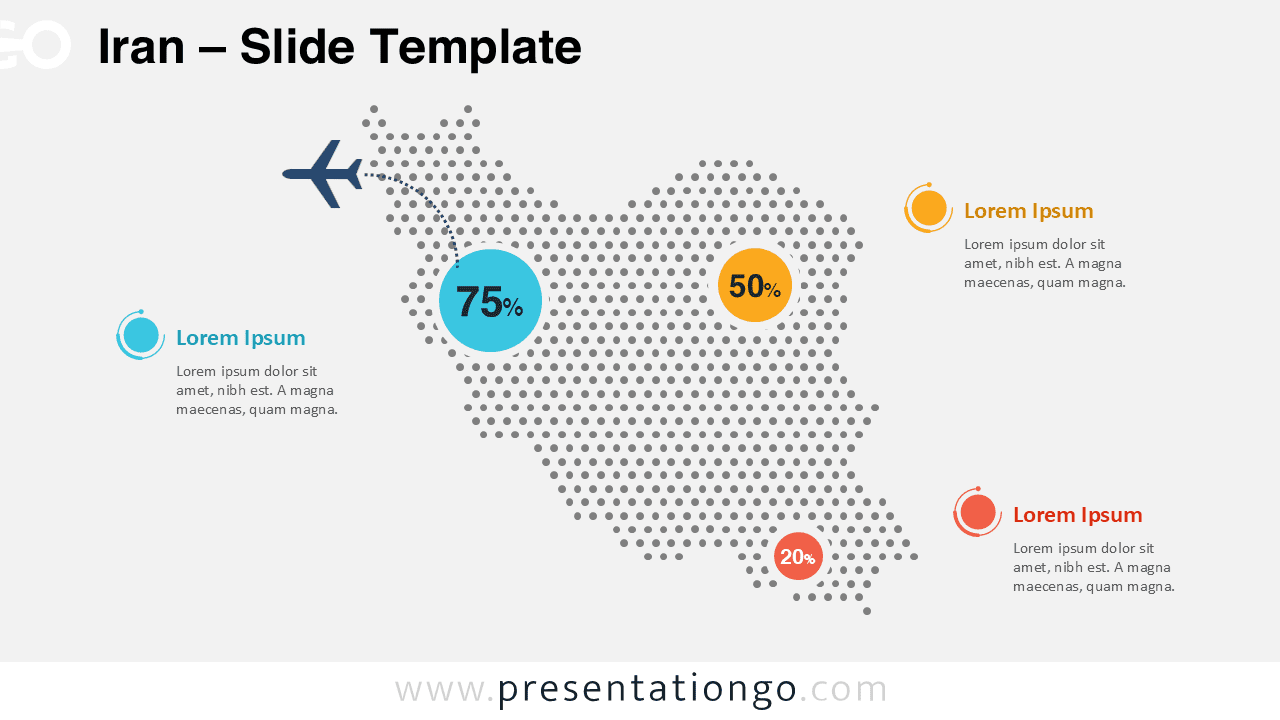
Iran Dotted Map Infographic
Show Iran data by region with this free dotted map for PowerPoint and Google Slides. Edit colors, labels, and callouts for any topic or industry focus.
Template Details
Iran Dotted Map Infographic gives you a clear and professional way to present geographic data in PowerPoint and Google Slides. Use it to highlight travel routes, regional metrics, sales coverage, population figures, or operational reach. The dotted silhouette adds visual interest without making the slide feel crowded. Circular callouts help you direct attention to key numbers quickly, while the route element supports tourism, aviation, transport, and logistics stories.
- Source
- PresentationGo
- Format
- pptx
- File size
- 156 KB
- Downloads
- 0
Author / Copyright:PresentationGo
Original source:PresentationGo original