Loading resources…
Total 1760 resources
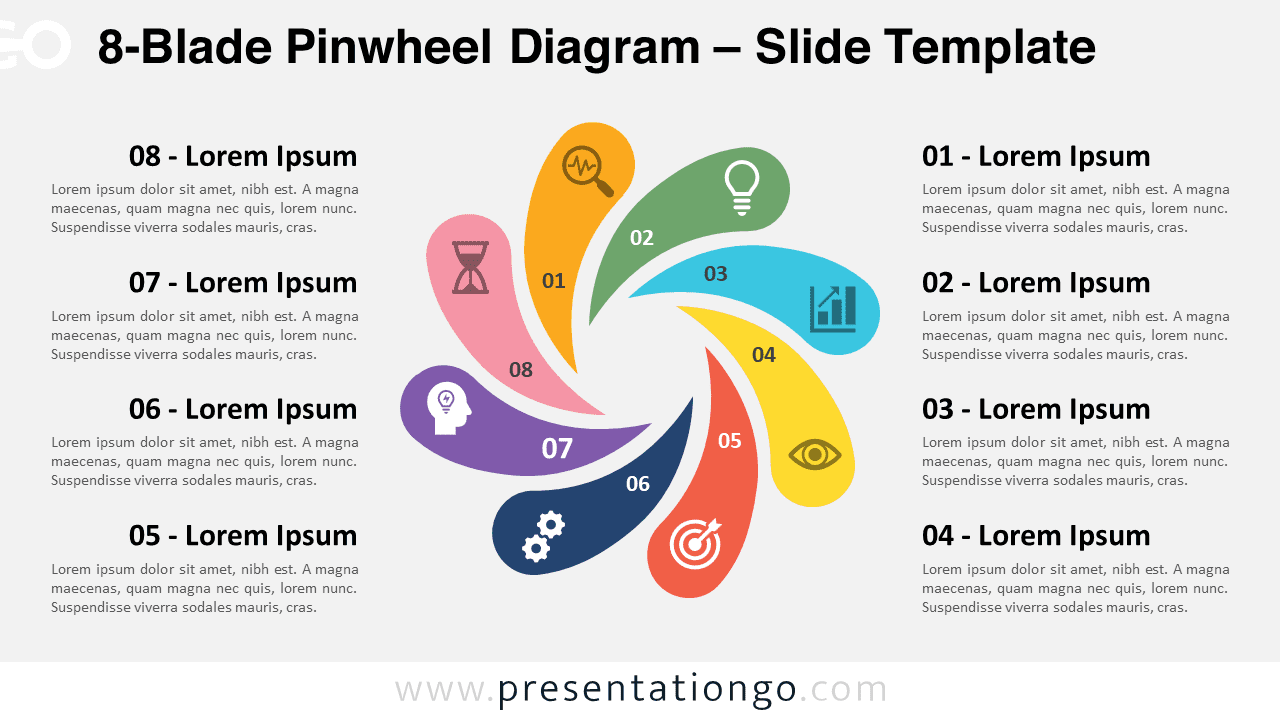
The 8-Blade Pinwheel Diagram is a versatile PowerPoint and Google Slides template that helps you illustrate eight-step cycles and processes.
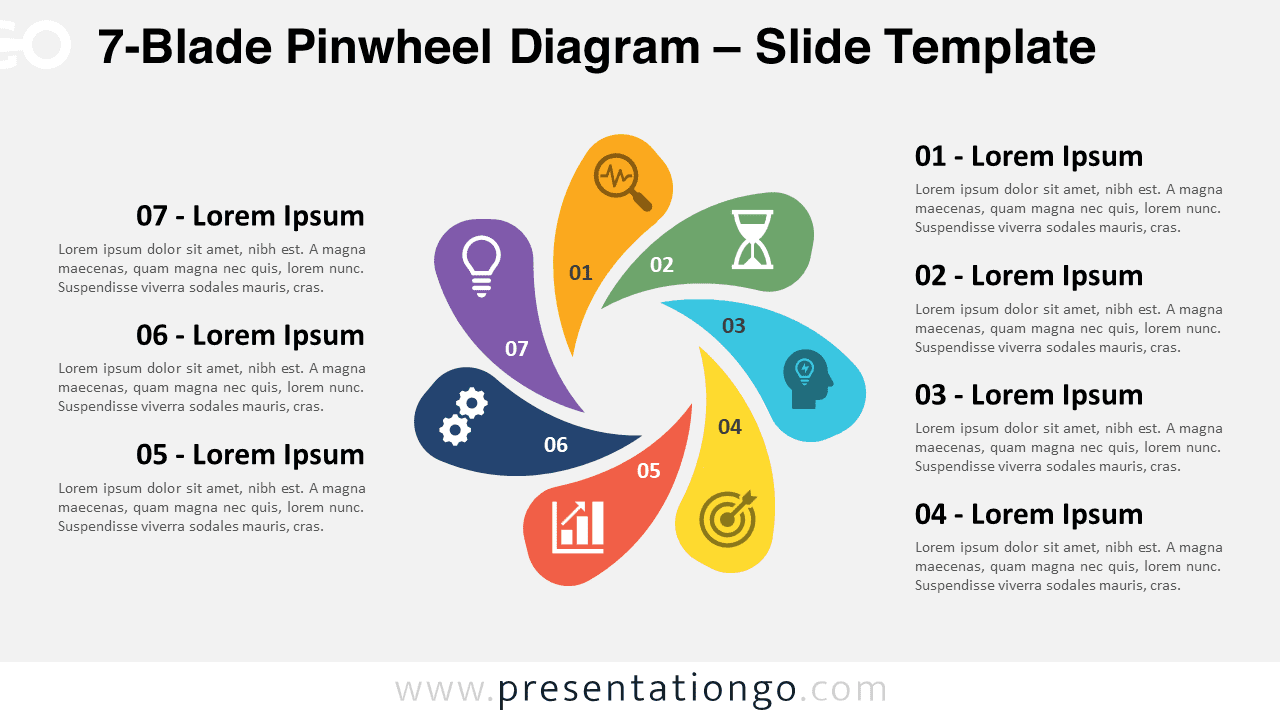
The 7-Blade Pinwheel for PowerPoint and Google Slides is a circular, seven-segment process diagram for visualizing sequential flows.
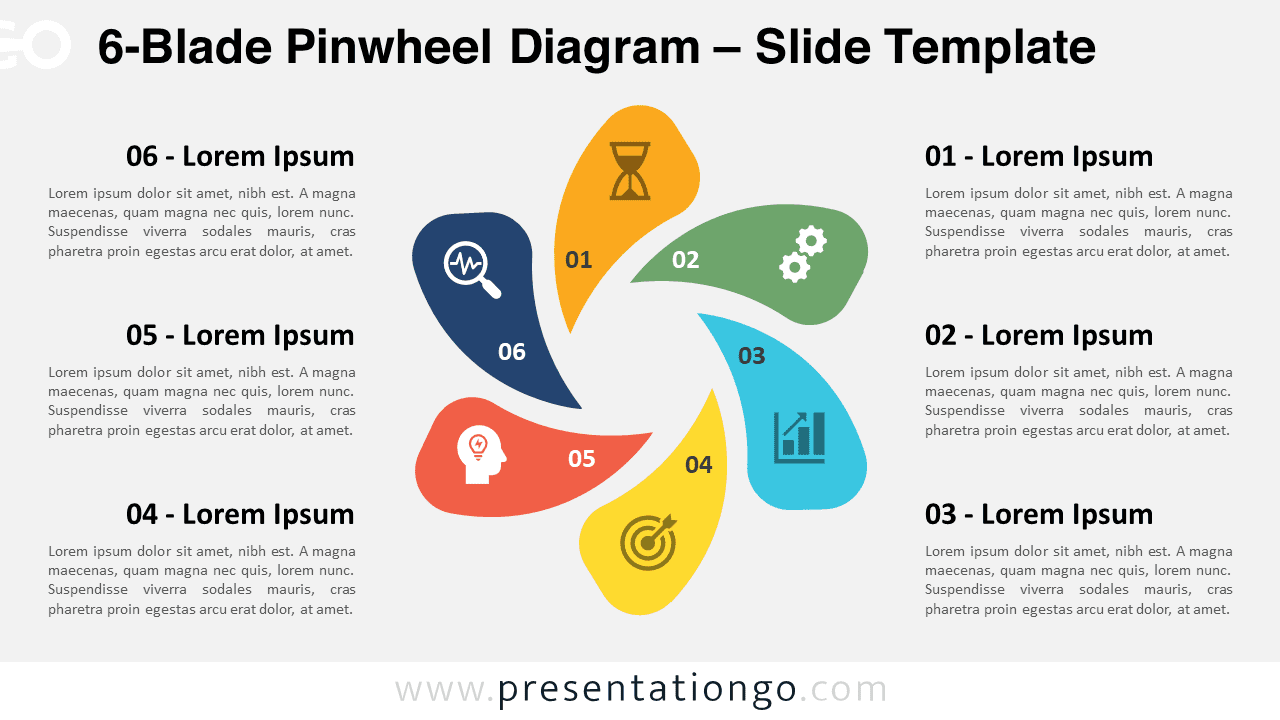
Download the 6-Blade Pinwheel Diagram for PowerPoint and Google Slides, a 6-step cyclical process template. Ideal for continuous processes.
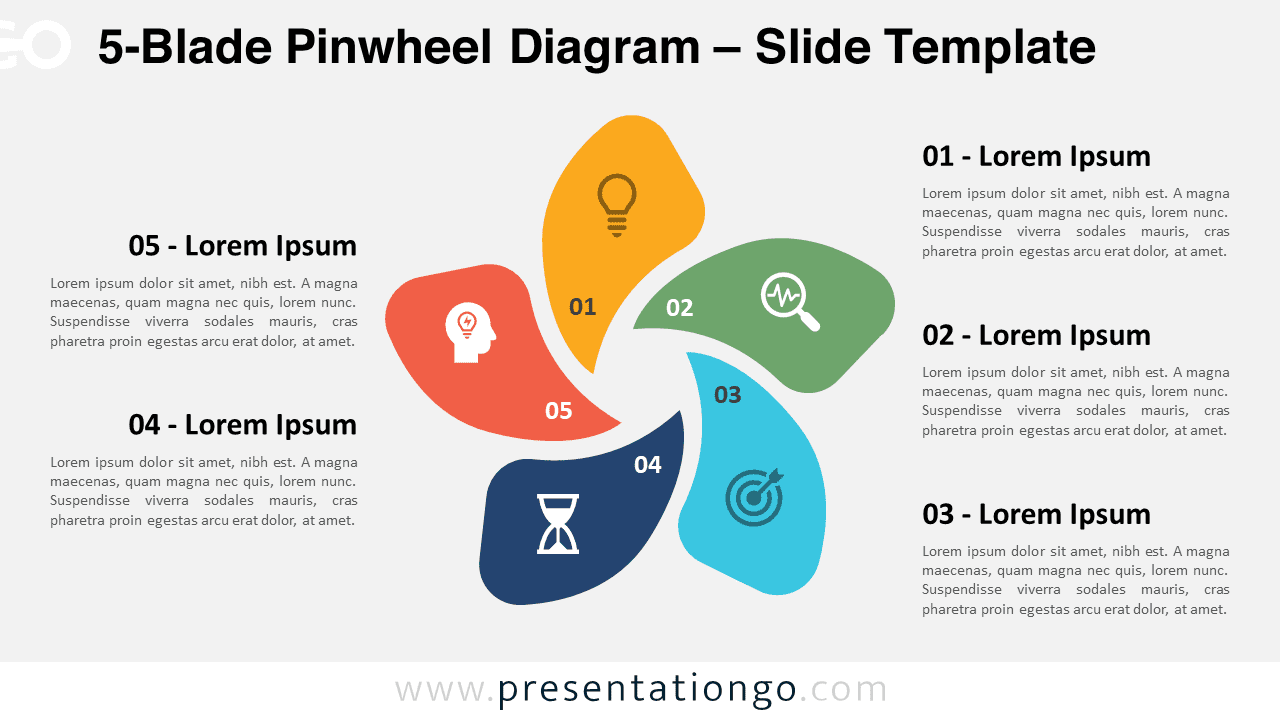
Download the 5-Blade Pinwheel Diagram for PowerPoint and Google Slides, a circular diagram with 5 segments for showcasing cyclical processes.
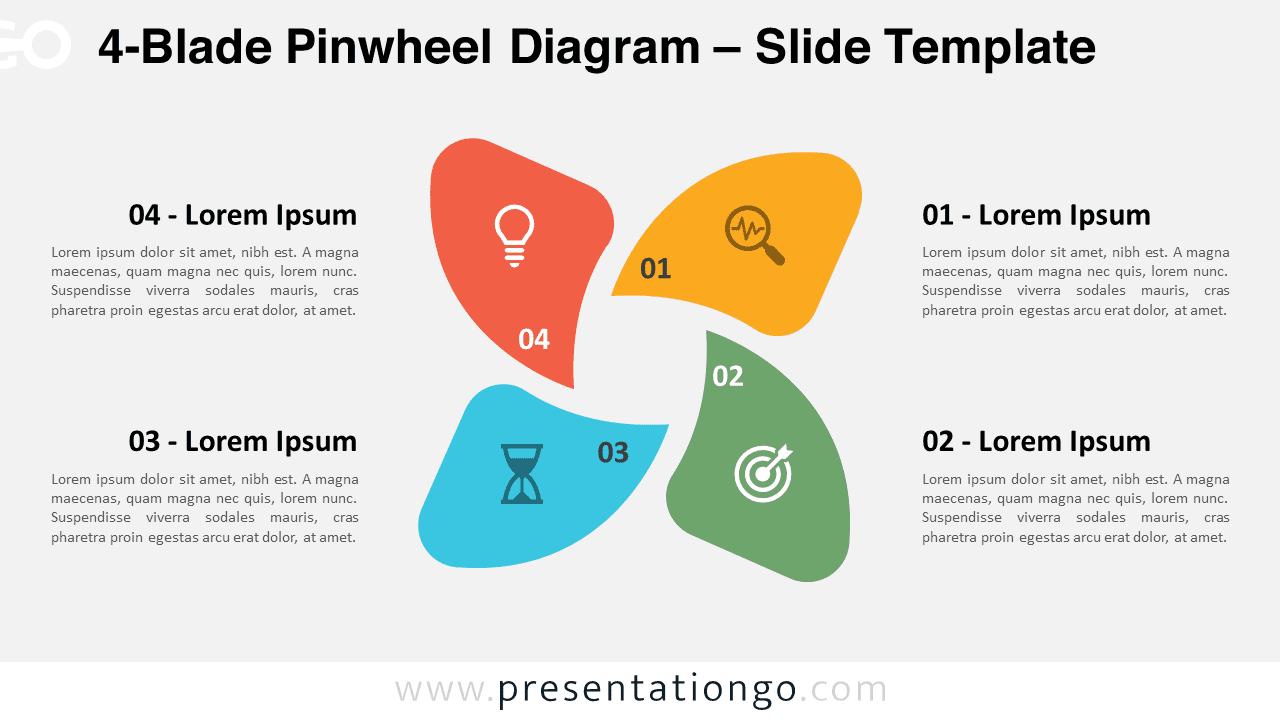
Enhance your PowerPoint & Google Slides presentations with this 4-Blade Pinwheel Diagram template. Ideal for illustrating cyclical processes.
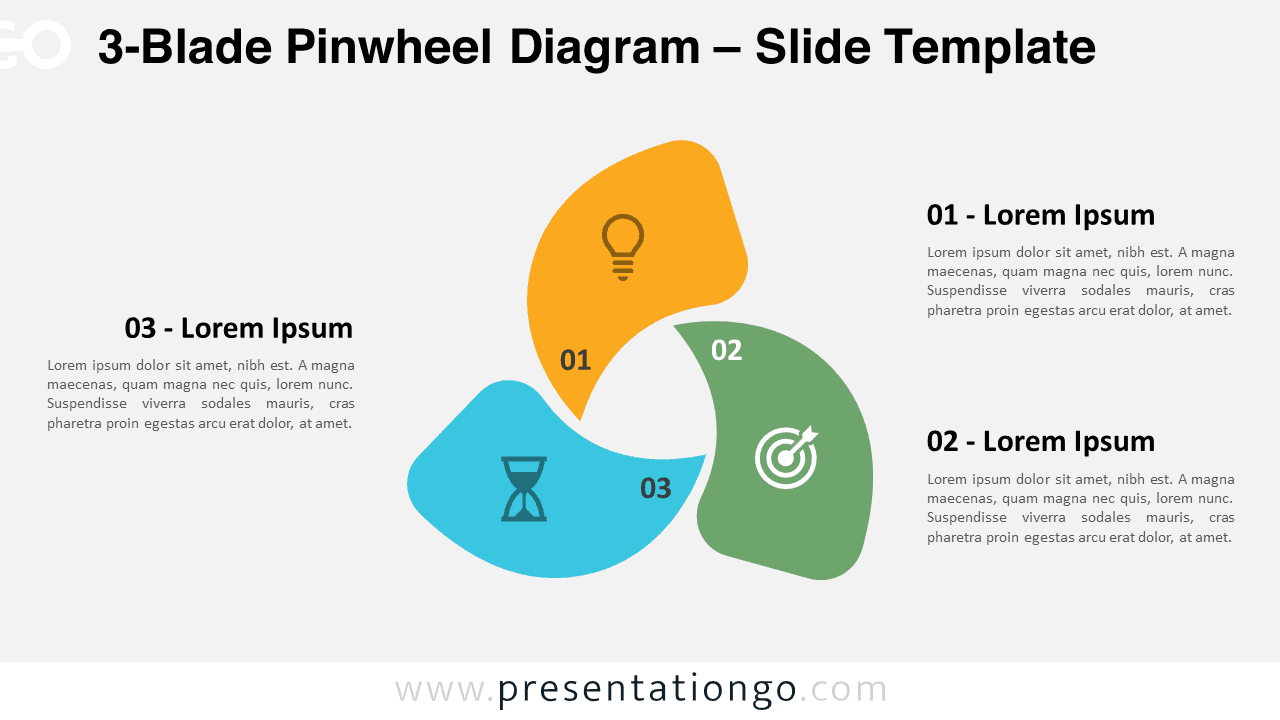
Download the 3-Blade Pinwheel Diagram for PowerPoint and Google Slides. Perfect three-step cycle diagram to showcase repeating processes.
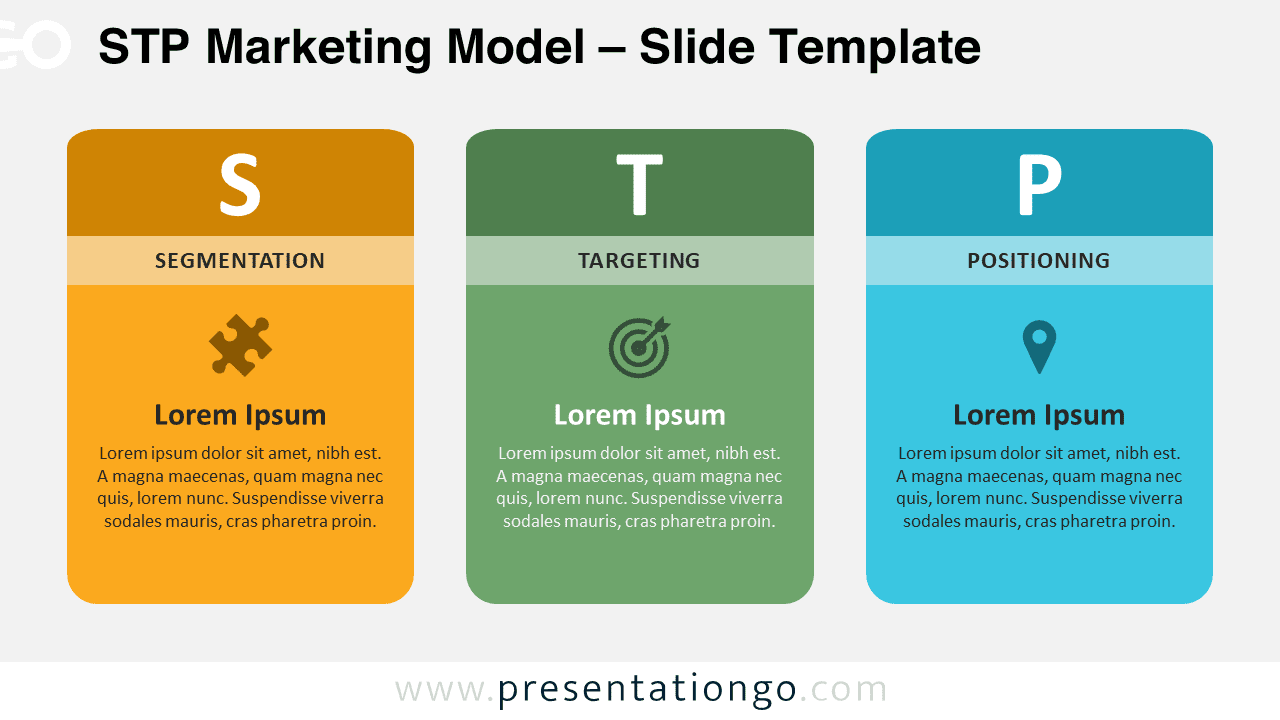
Present marketing strategies with the STP Marketing Model with clarity using this customizable PowerPoint (PPTX) and Google Slides template.
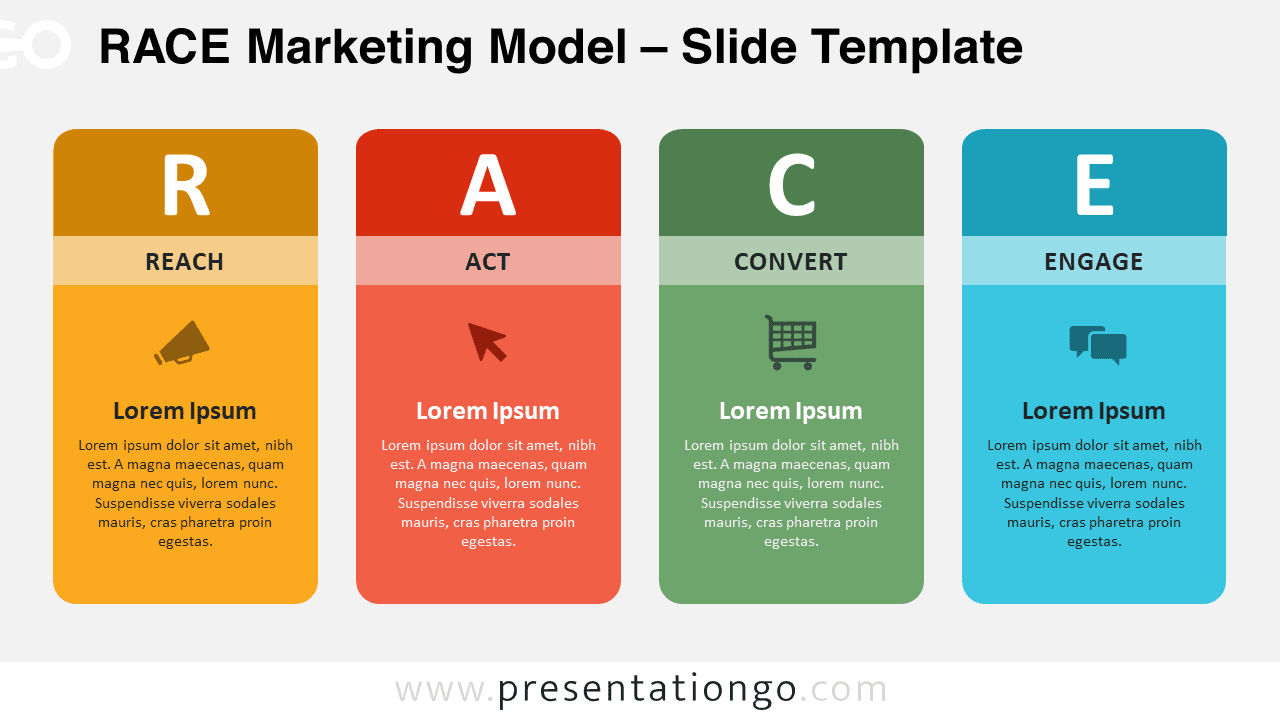
Communicate your marketing strategies effectively with this RACE Model template for PowerPoint and Google Slides. Free & easily customizable.
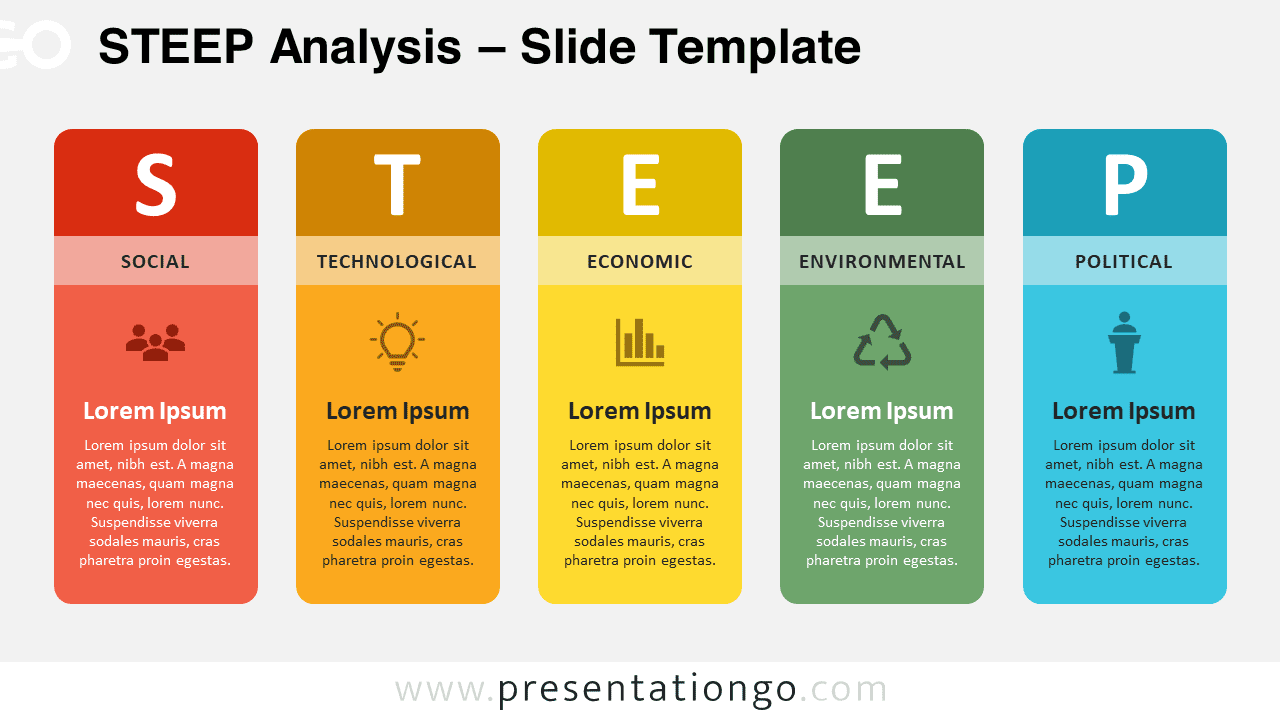
Present STEEP Analysis findings with this professional PowerPoint & Google Slides template. Eye-catching visuals for effective communication.
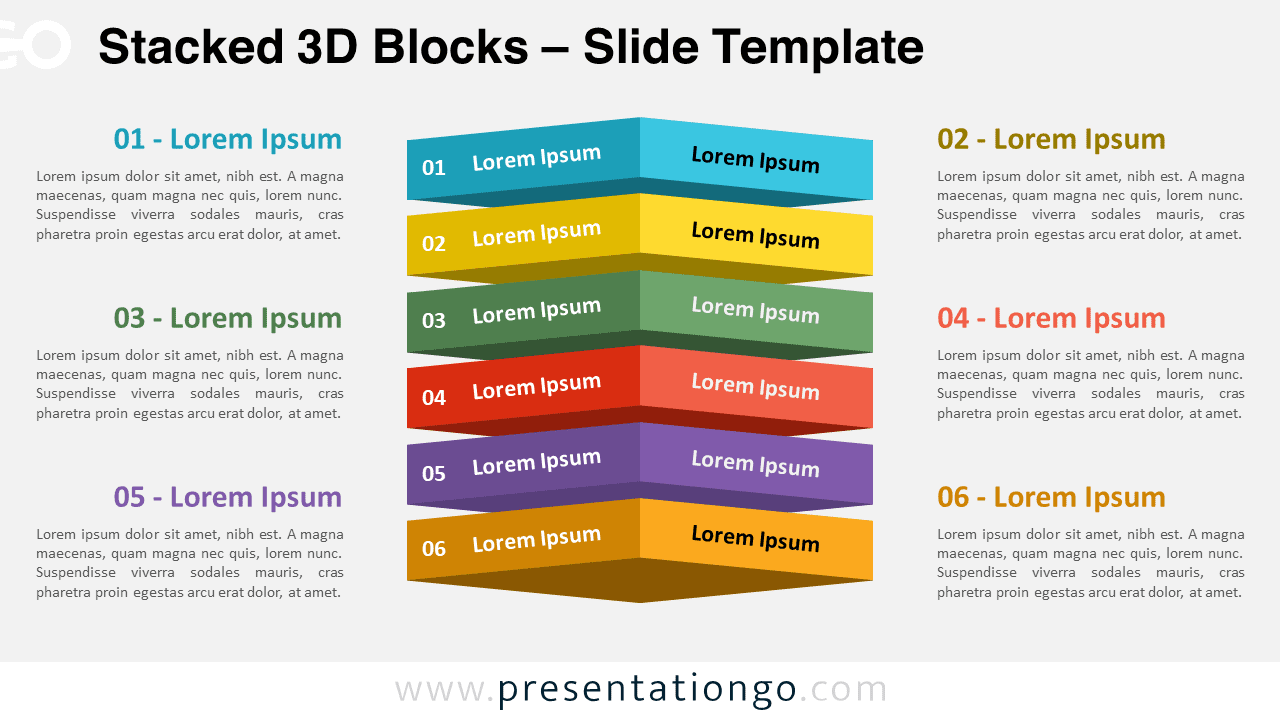
Present step-by-step procedures with the Stacked 3D Blocks, a 6-step vertical process diagram template for PowerPoint and Google Slides.
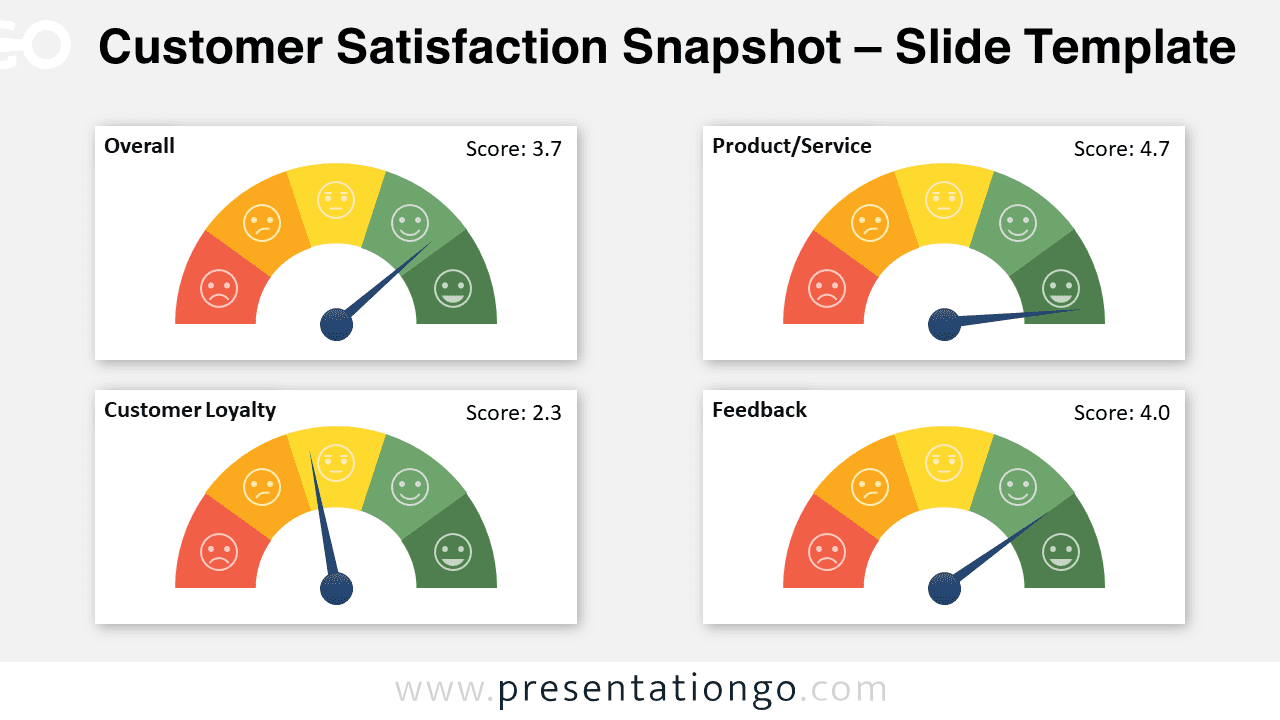
Make customer satisfaction data accessible and engaging with the Customer Satisfaction Snapshot template for PowerPoint and Google Slides.
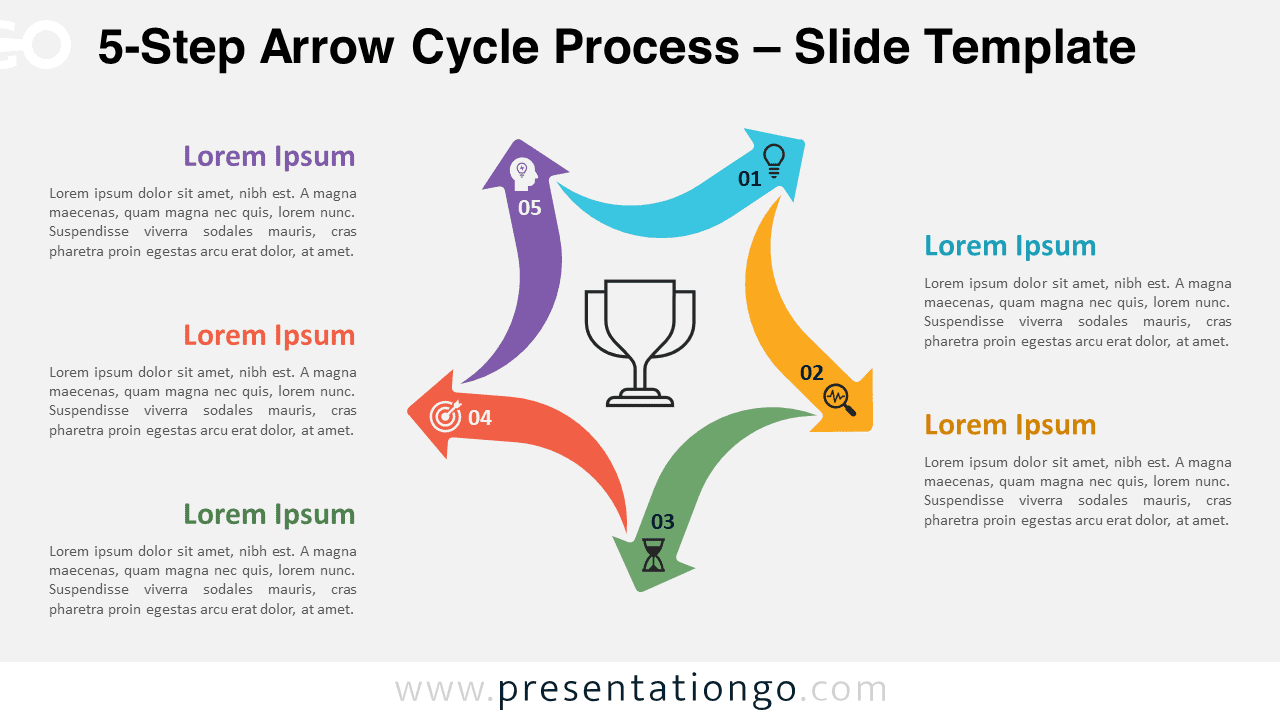
Illustrate a 5-step cyclical process with this arrow cycle diagram for PowerPoint. Ideal for presenting continuous workflows and sequences.
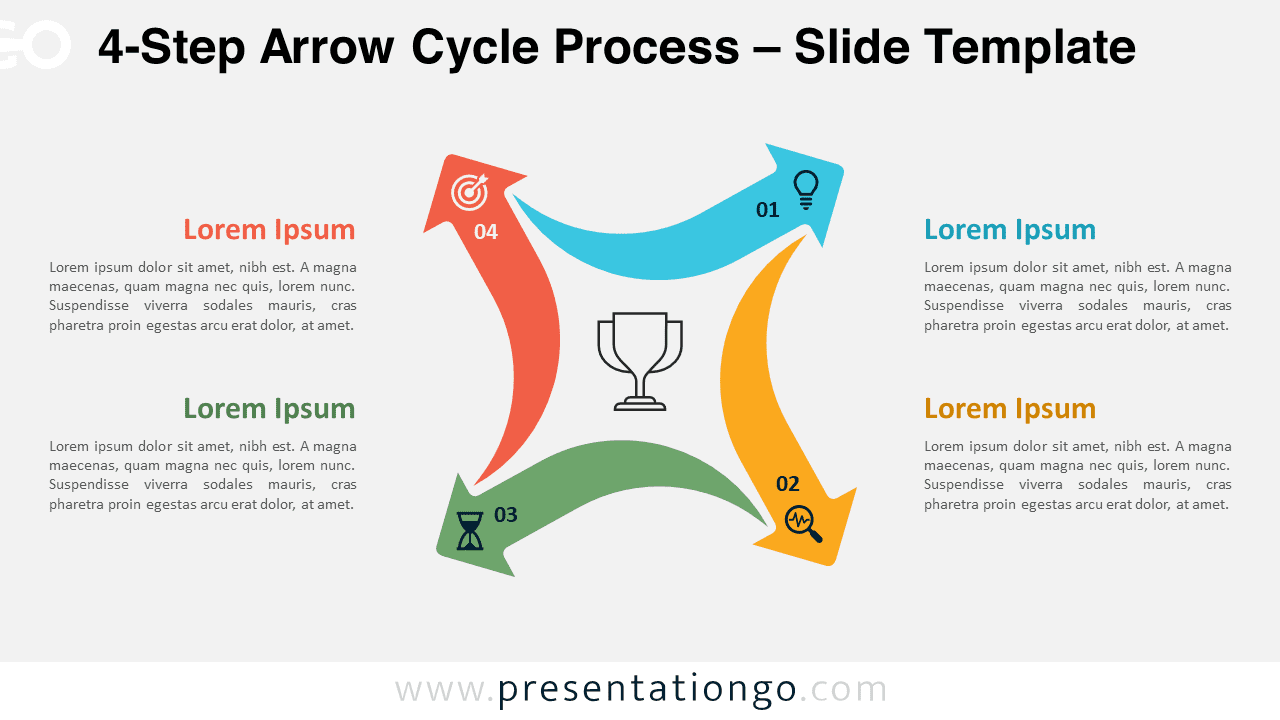
Download the 4-Step Arrow Cycle Process PowerPoint & Google Slides, a circular diagram to visualize recurring sequences of four stages.
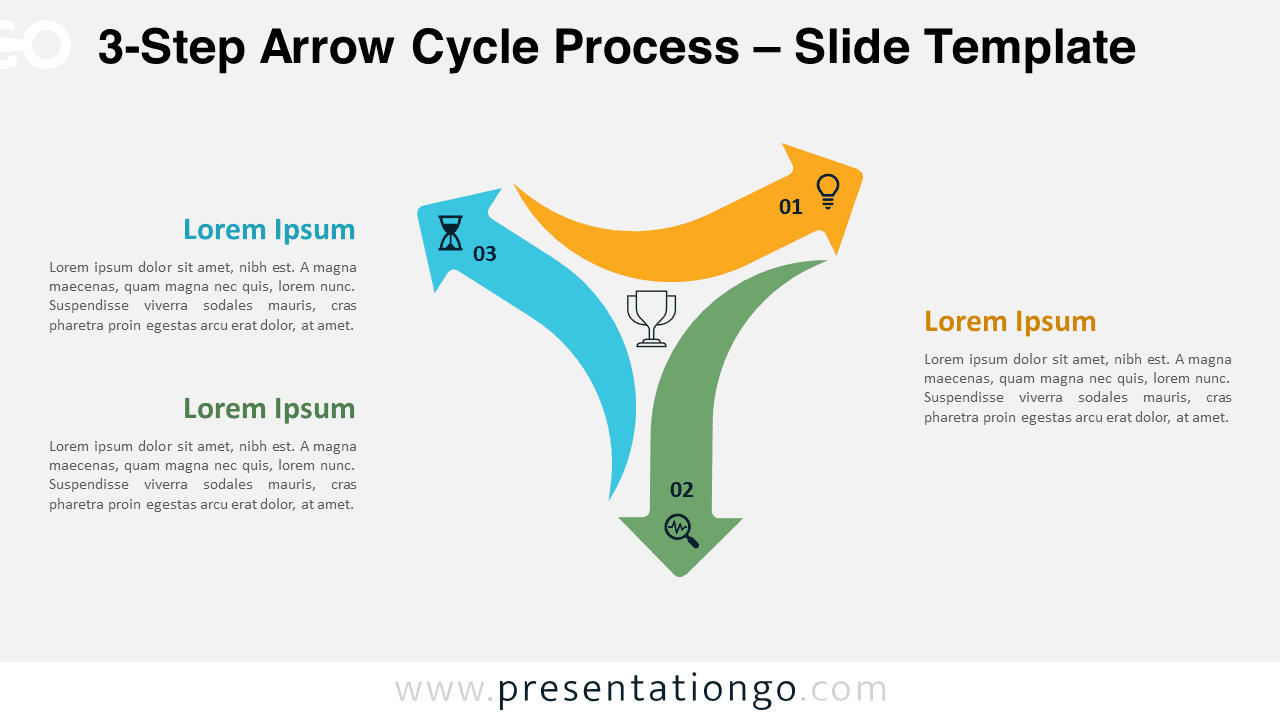
Download the 3-Step Arrow Cycle Process template for PowerPoint and Google Slides, perfect diagram to illustrate 5-phase iterative processes.
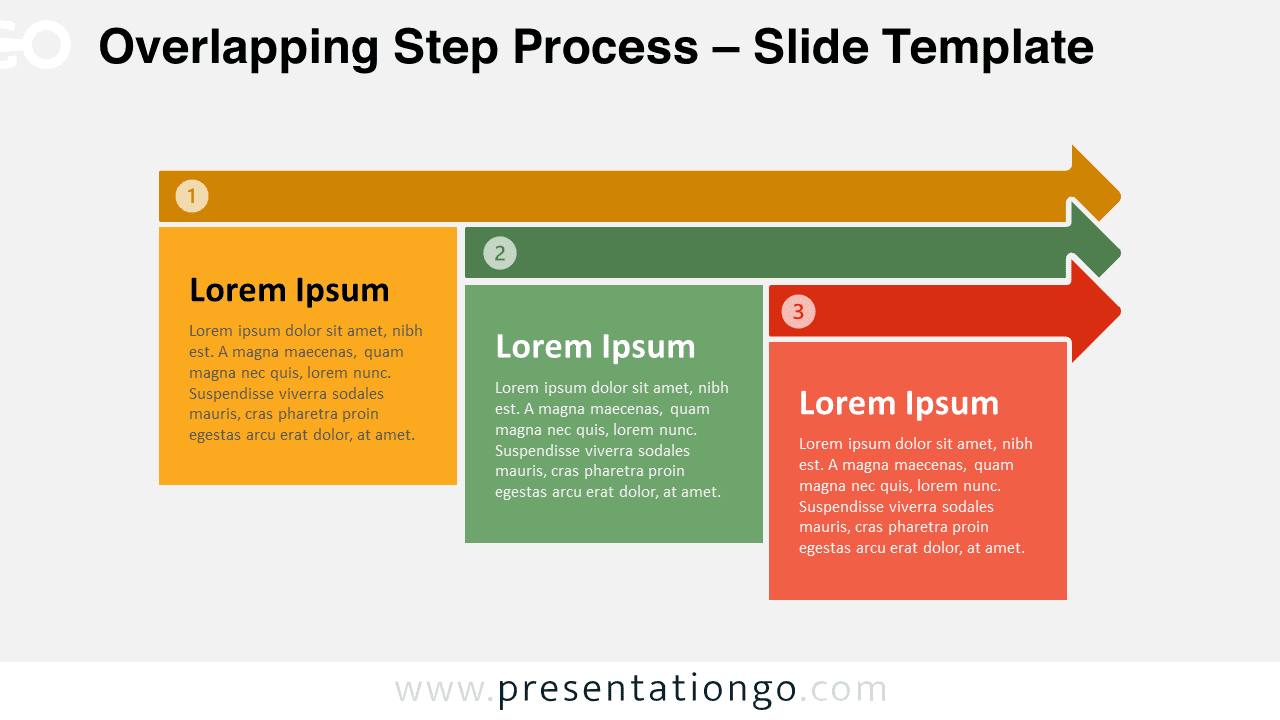
The Overlapping Step Process PowerPoint & Google Slides features a three-stage diagram for sequential processes and project timelines.
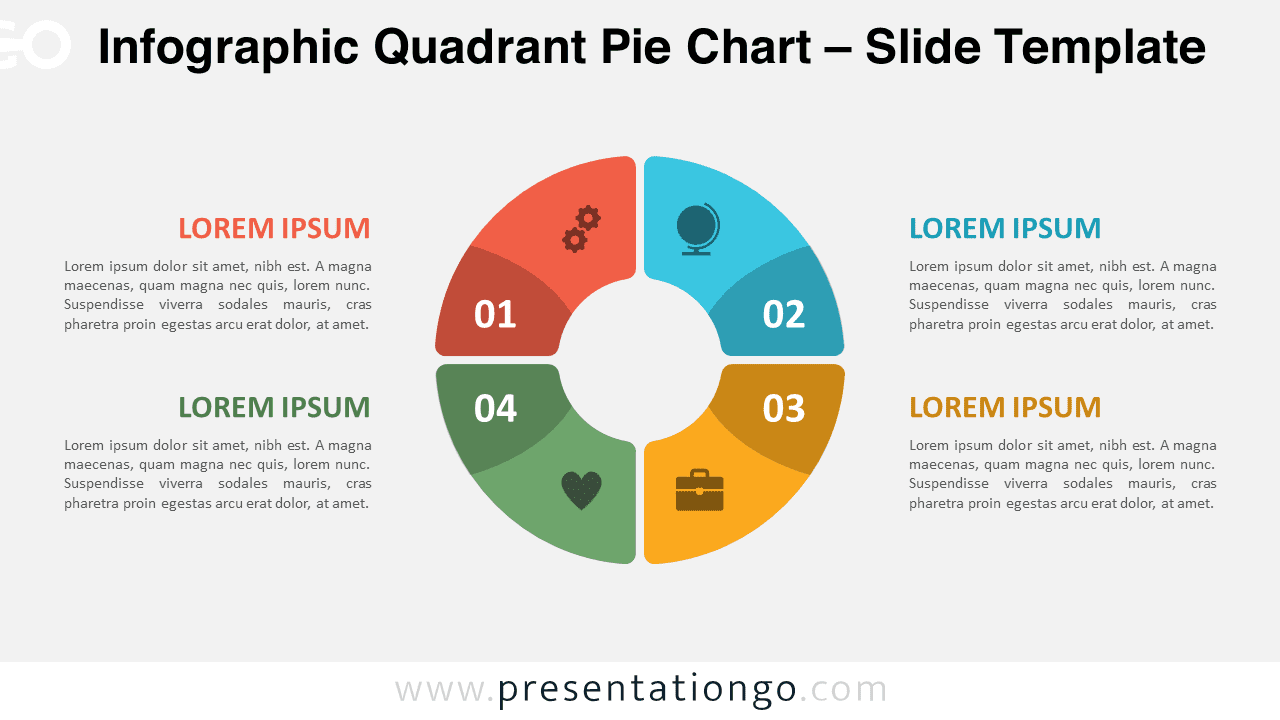
The Infographic Quadrant Pie Chart is a powerful diagram for PowerPoint & Google Slides, designed to showcase information in four sections.
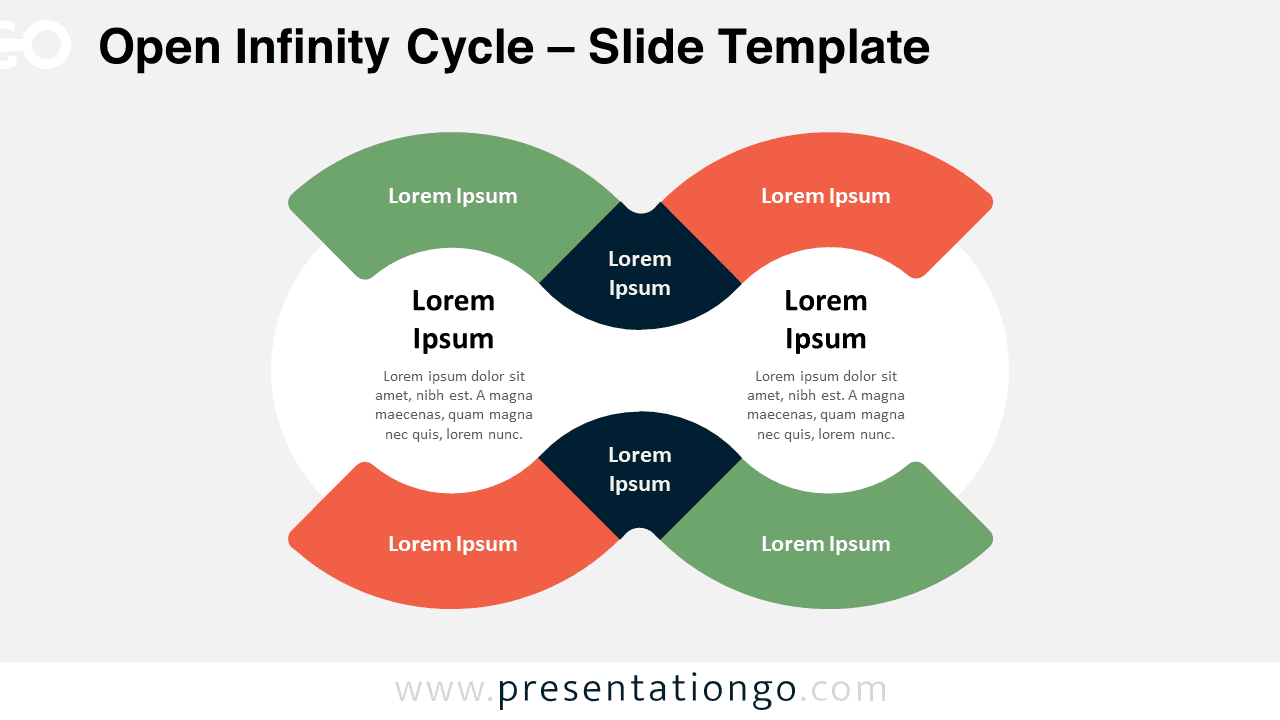
Download the Open Infinity Cycle template for PowerPoint & Google Slides. A unique diagram for open-ended processes and comparing ideas.
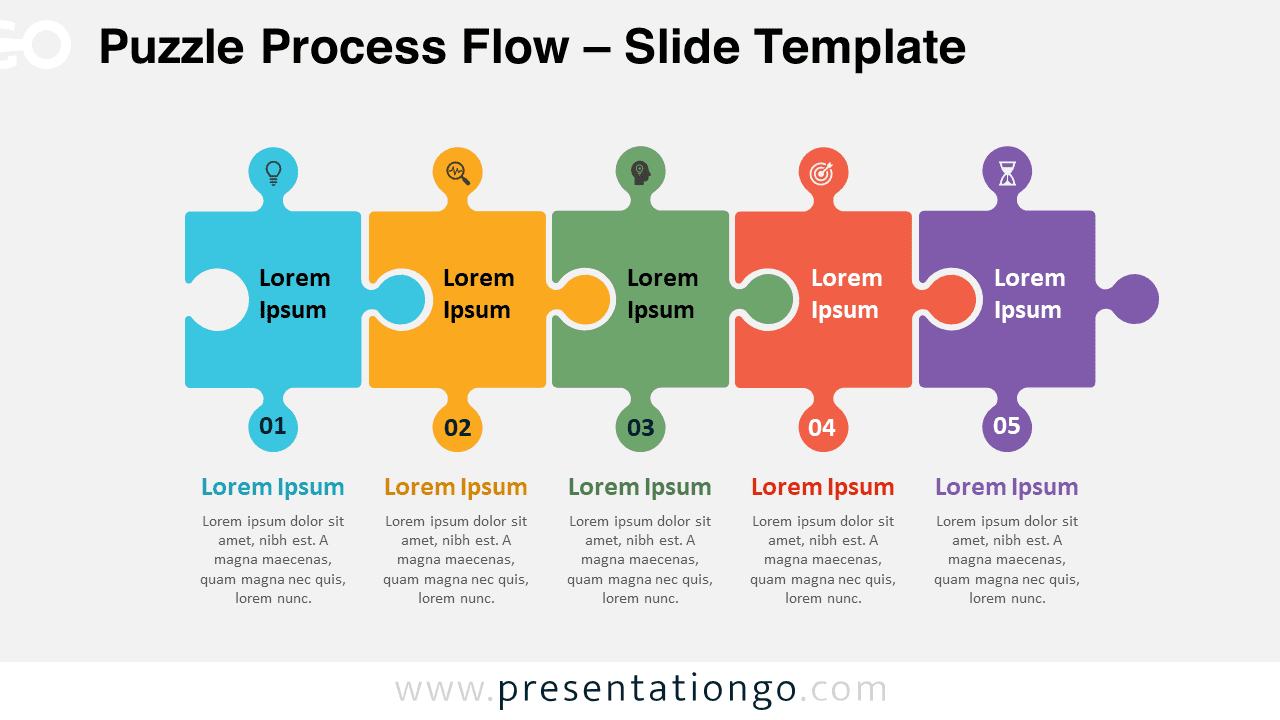
Download the Puzzle Process Flow template for PowerPoint and Google Slides, perfect for illustrating interconnected steps and workflows.
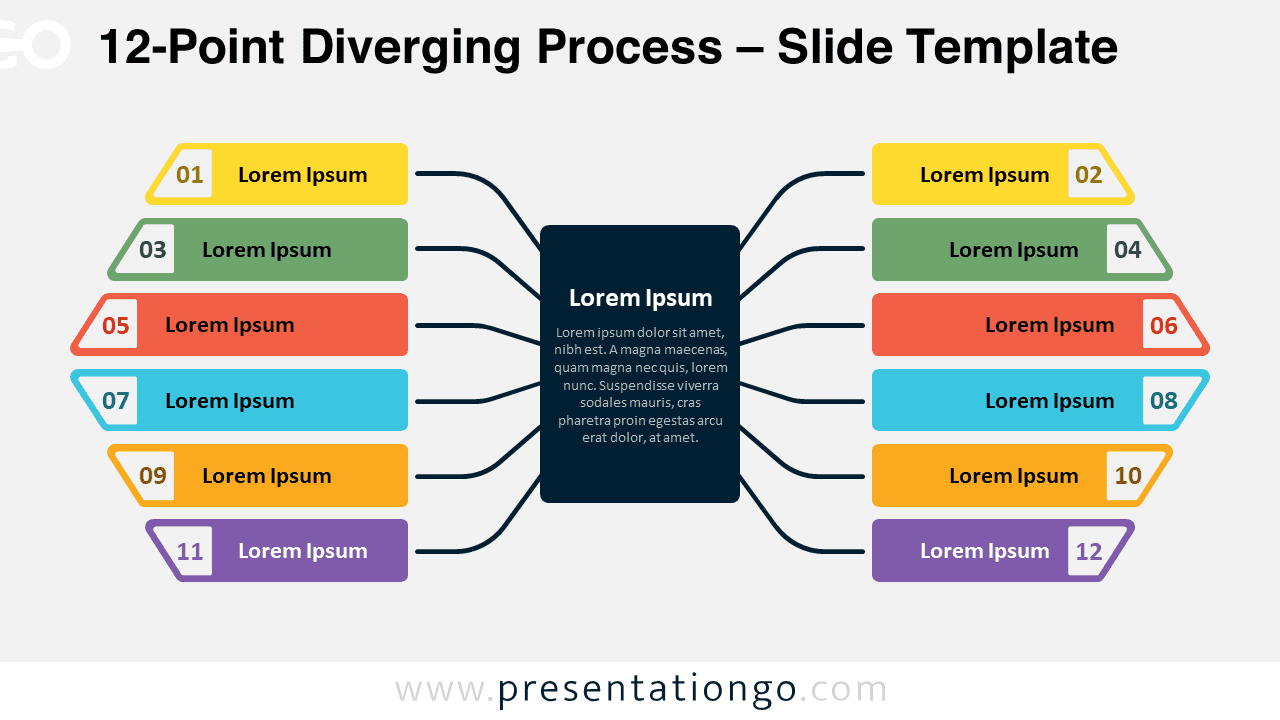
Showcase central ideas and complex strategies using the 12-Point Diverging Process for PowerPoint and Google Slides. Fully customizable.
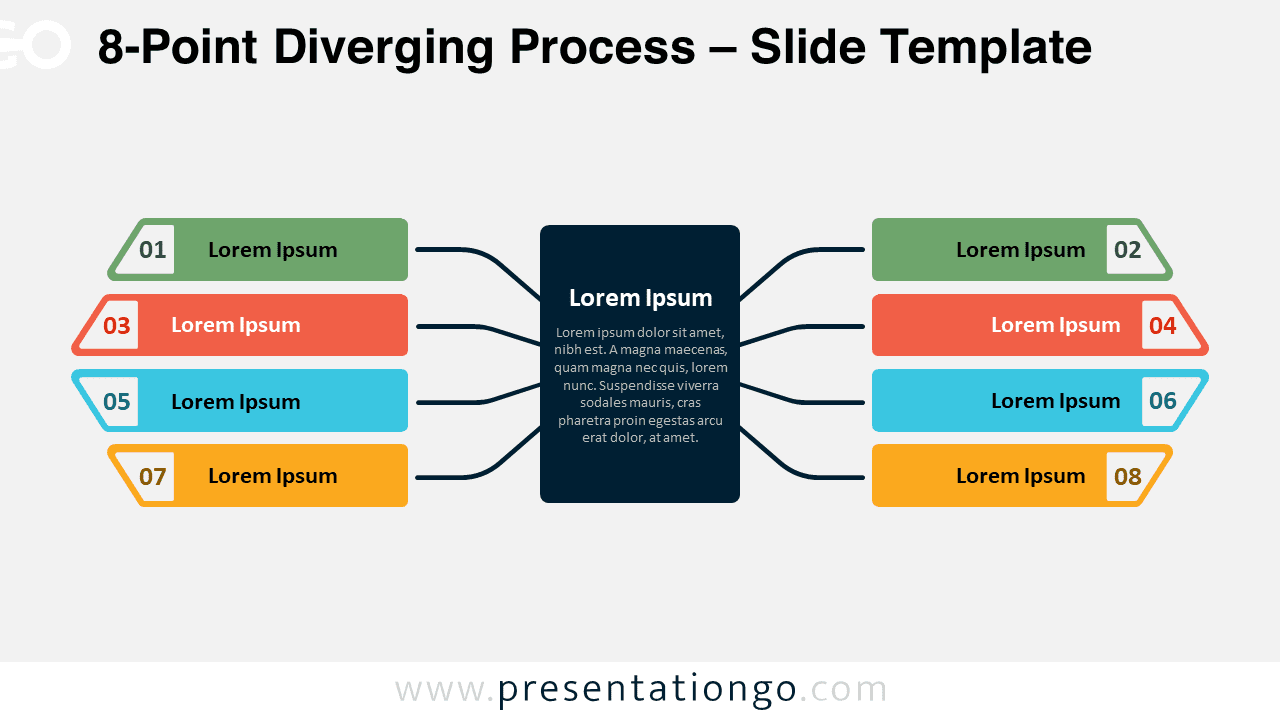
Download the 8-Point Diverging Process template for PowerPoint & Google Slides. Showcase a central concept branching out into eight distinct elements.
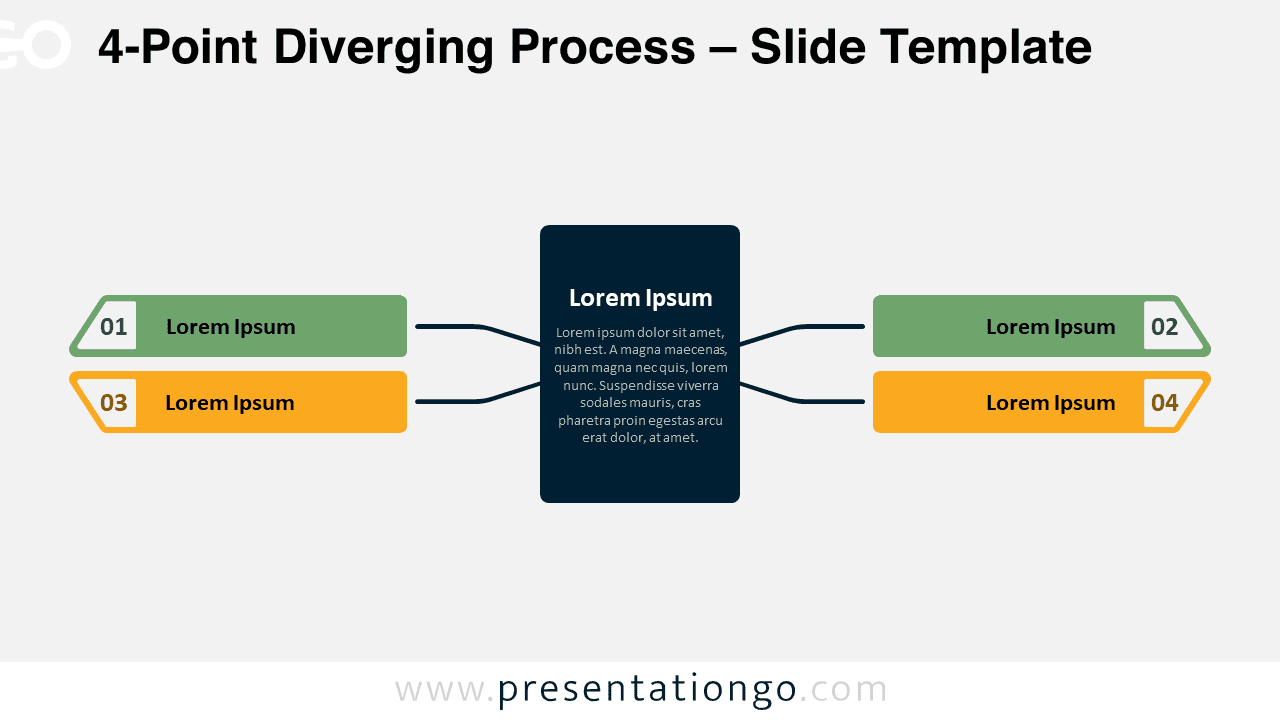
The 4-Point Diverging Process template for PowerPoint & Google Slides showcases 2 symmetrical blocks that diverge from a central point.
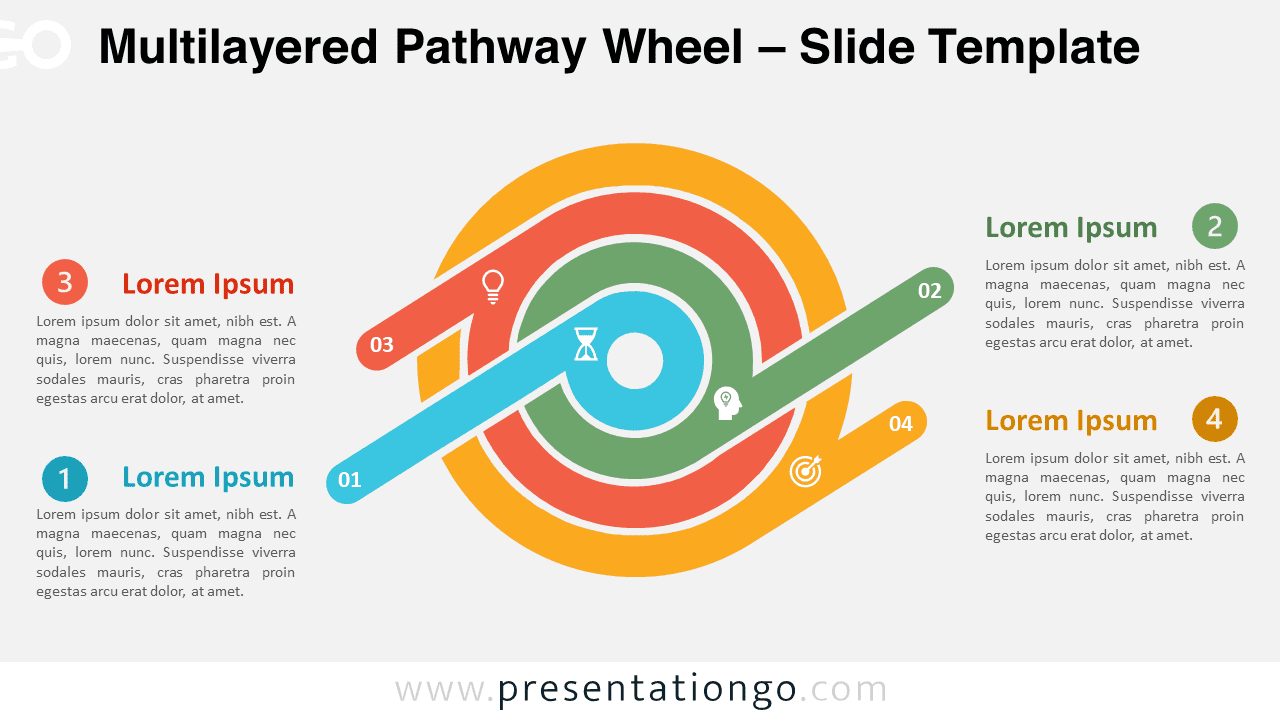
Download the Multilayered Pathway Wheel for PowerPoint and Google Slides, perfect to effectively showcase complex processes and relationships.
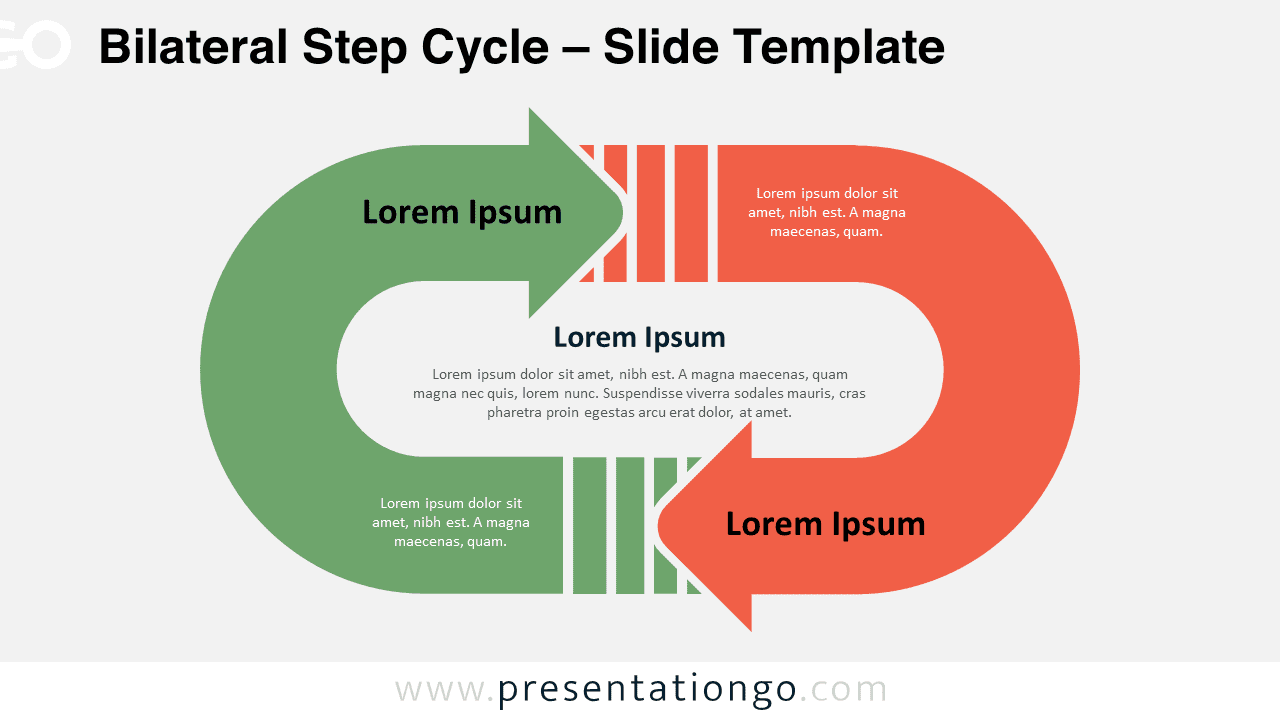
Present binary concepts with the Bilateral Step Cycle PowerPoint and Google Slides template, featuring a continuous 2-step loop design.
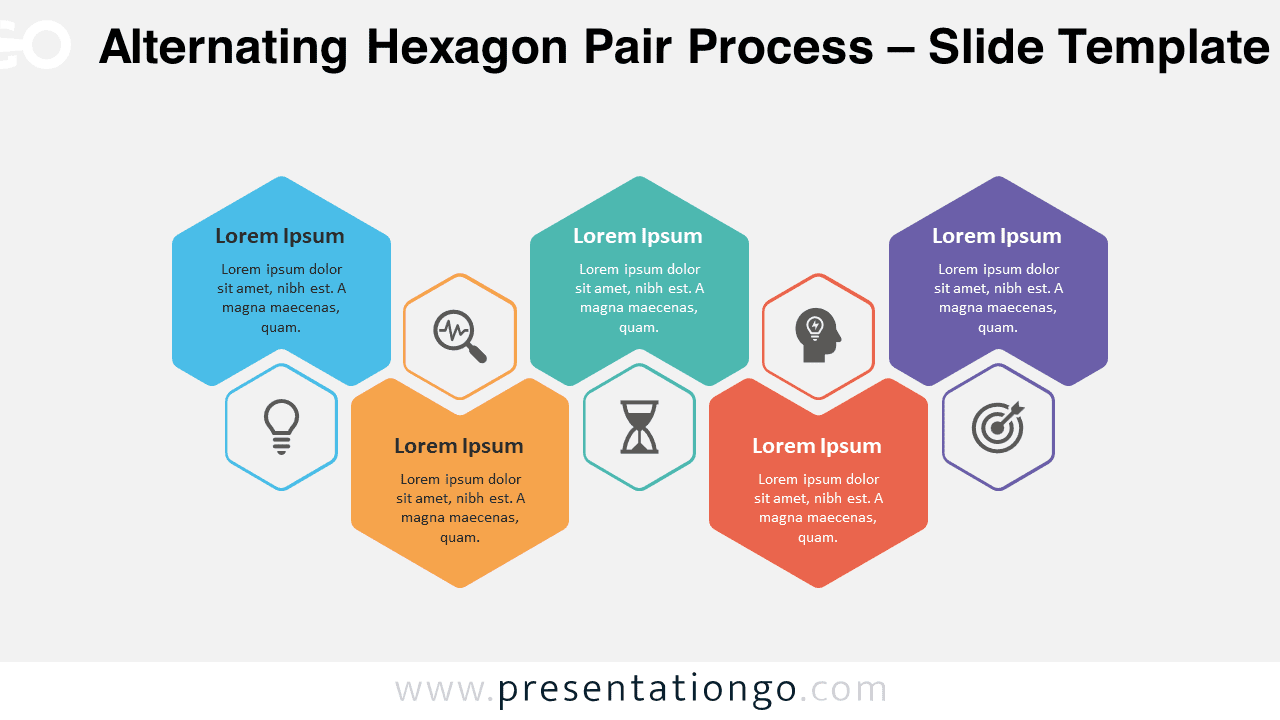
The Alternating Hexagon Pair Process template offers a dynamic 5-step process diagram for PowerPoint and Google Slides. Free download.