Loading resources…
Total 1760 resources
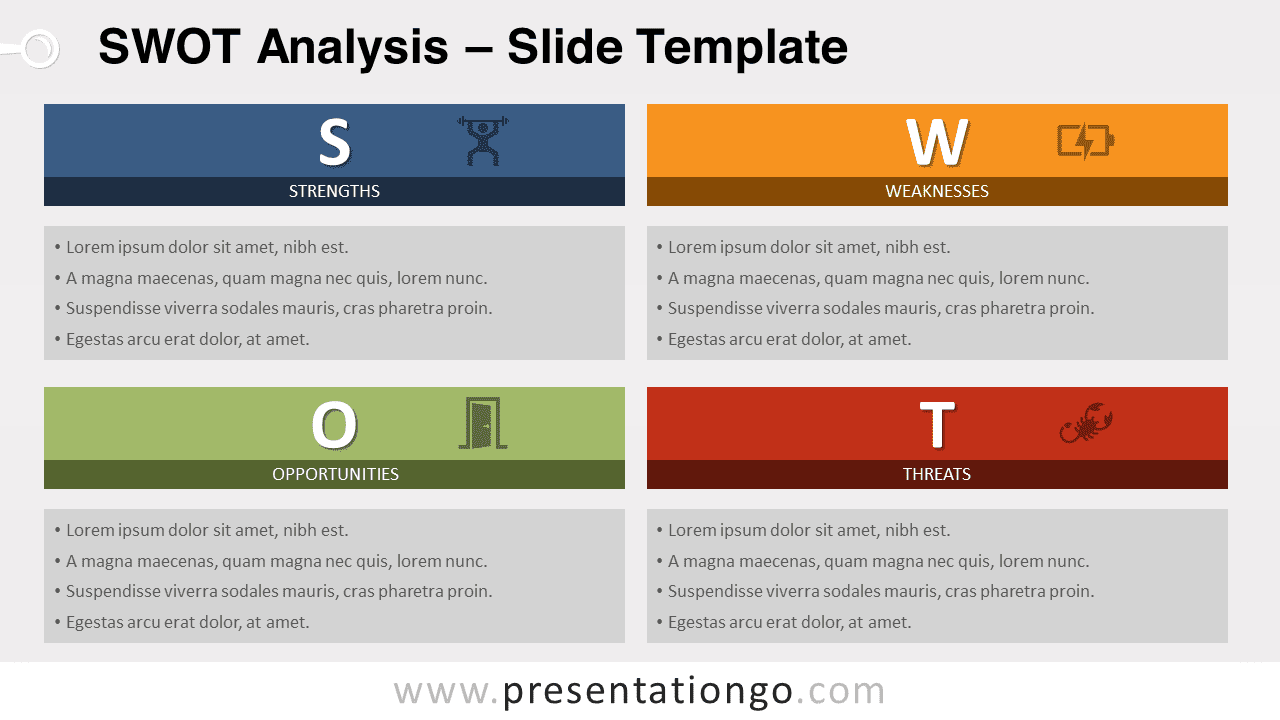
Free SWOT analysis for PowerPoint and Google Slides. Use this template slide to list the strengths, weaknesses, opportunities, and threats.
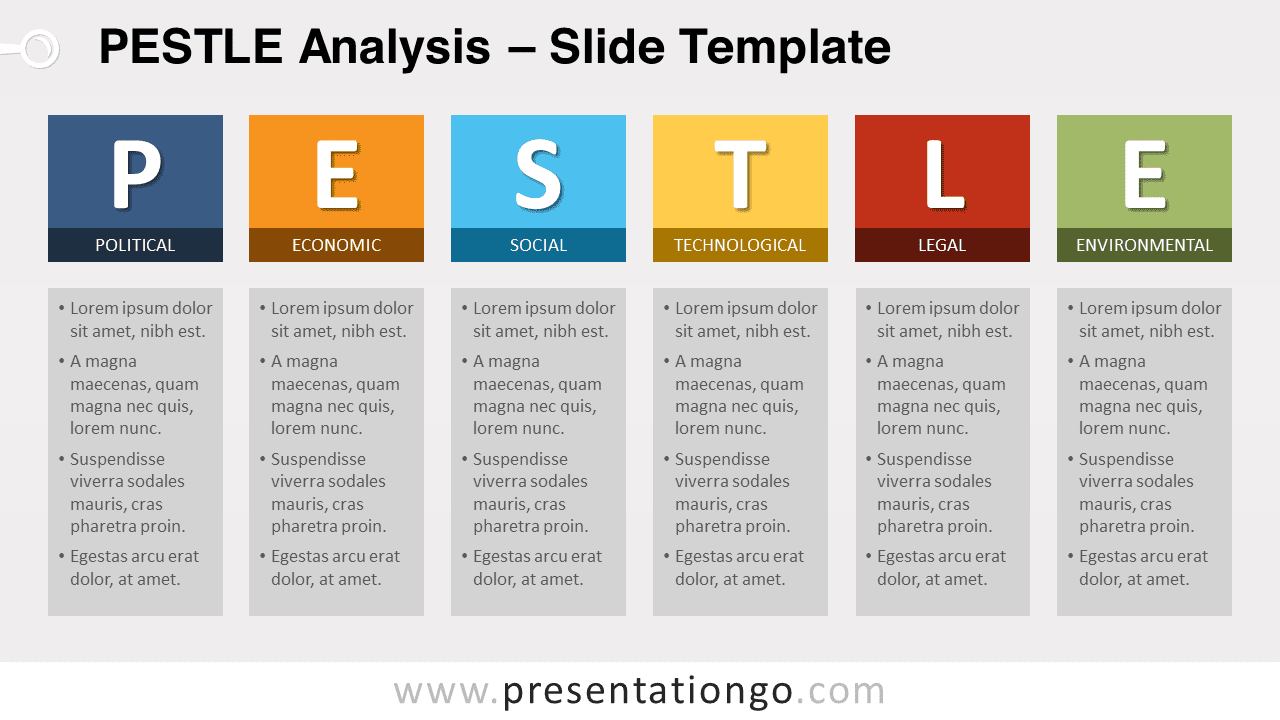
Free PESTLE analysis for PowerPoint and Google Slides. Slide template to identify and assess the key external factors of a business.
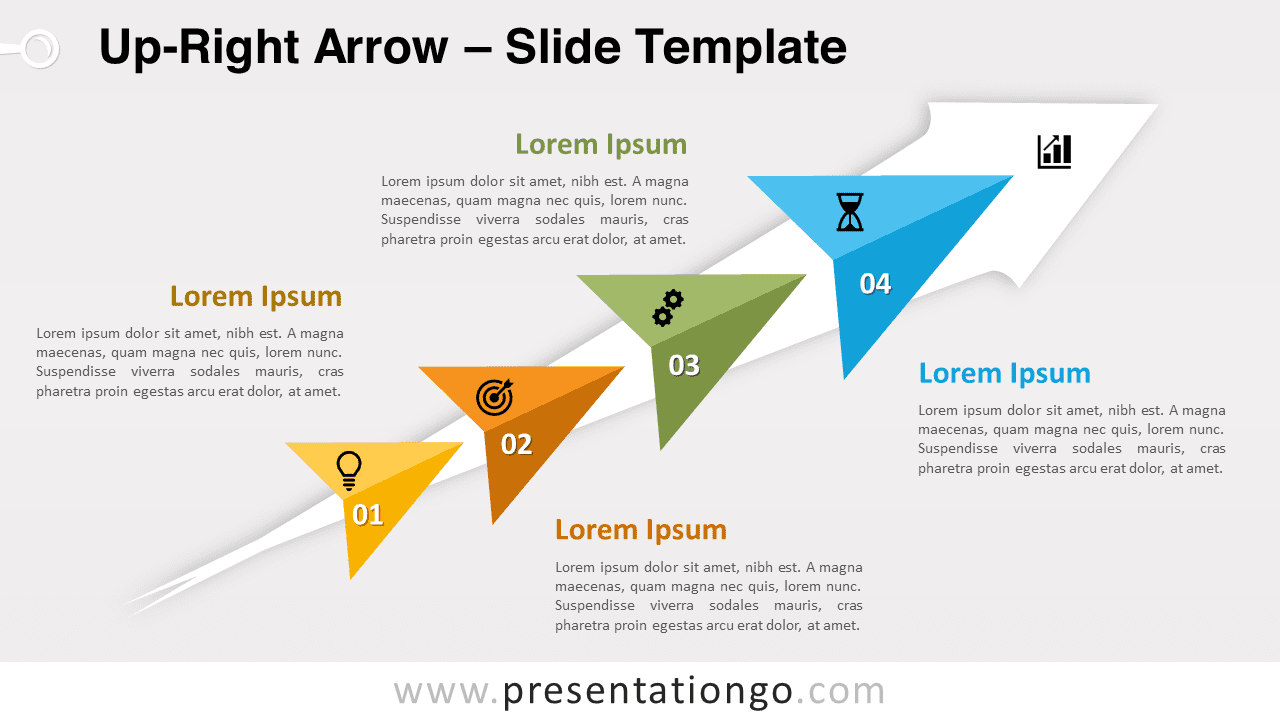
Free up-right arrow for PowerPoint and Google Slides. An increasing continuous process arrow with 4 steps. Editable graphics.
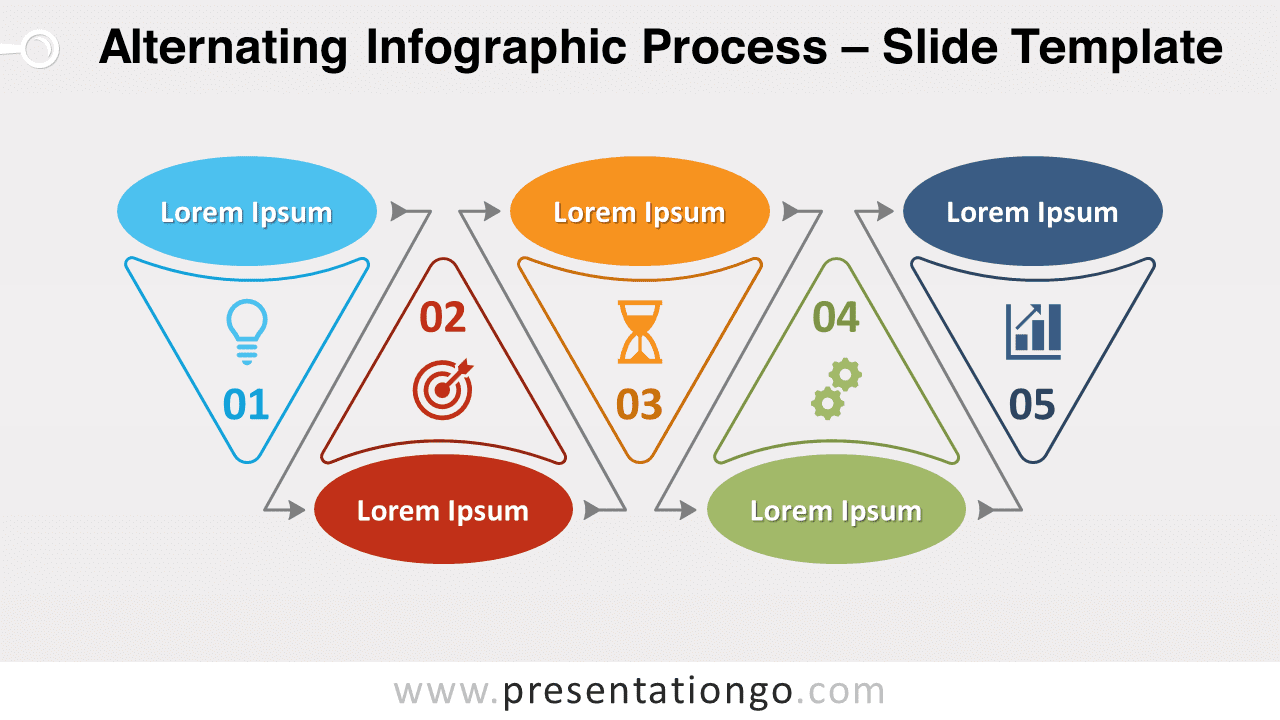
Free alternating infographic process for PowerPoint and Google Slides. An up-and-down series of funnel-shaped steps. Editable graphics.
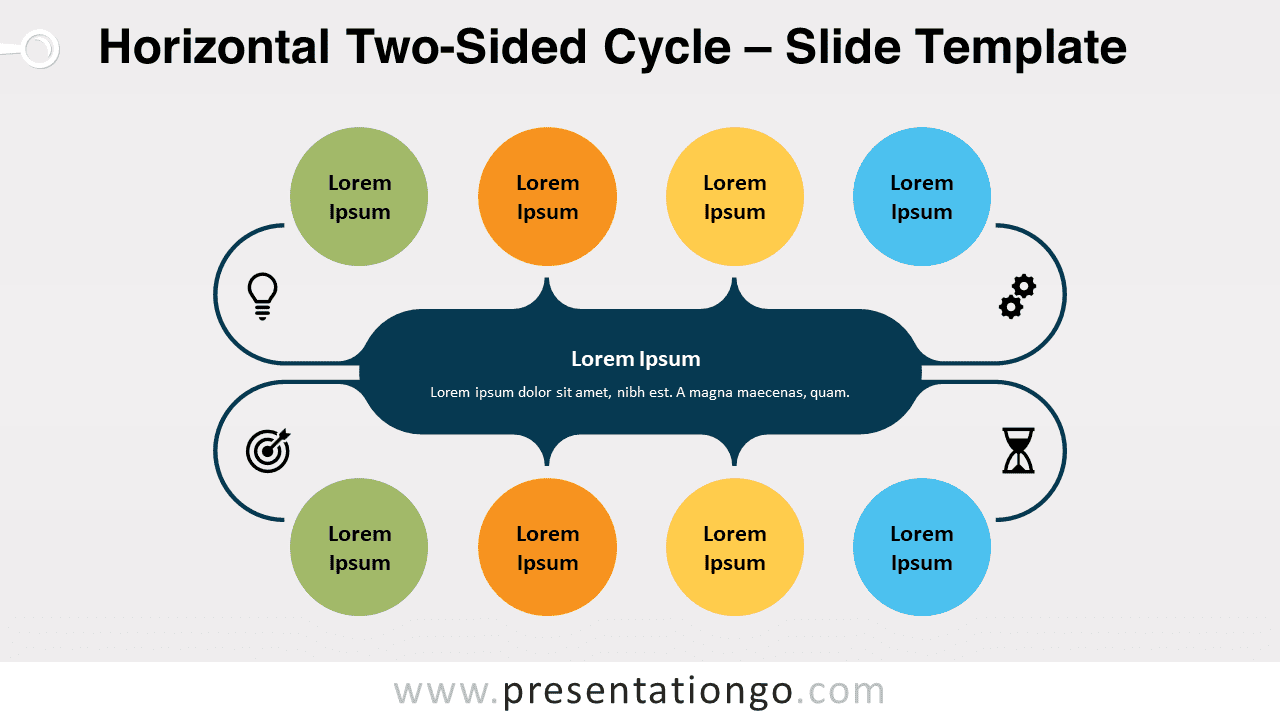
Free horizontal two-sided cycle for PowerPoint and Google Slides. Two circular process diagrams and a central element.
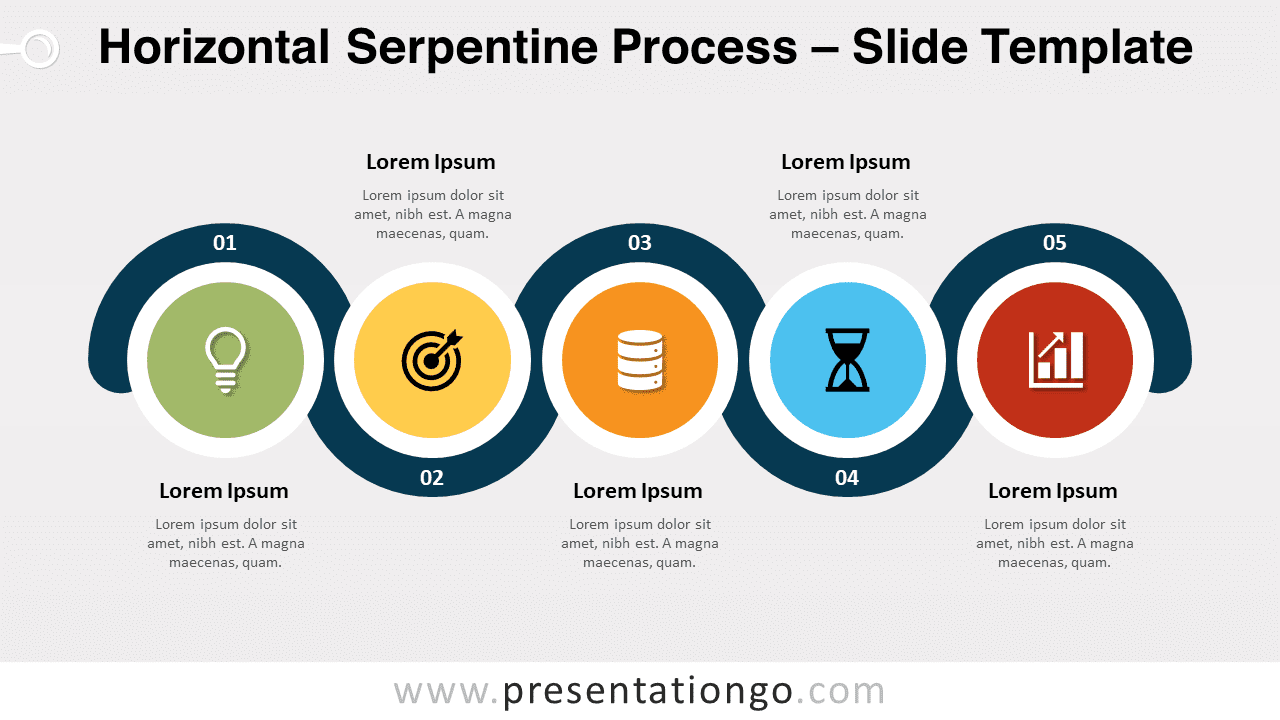
Free horizontal serpentine process for PowerPoint and Google Slides. A series of five circles and a sinuous continuous line.
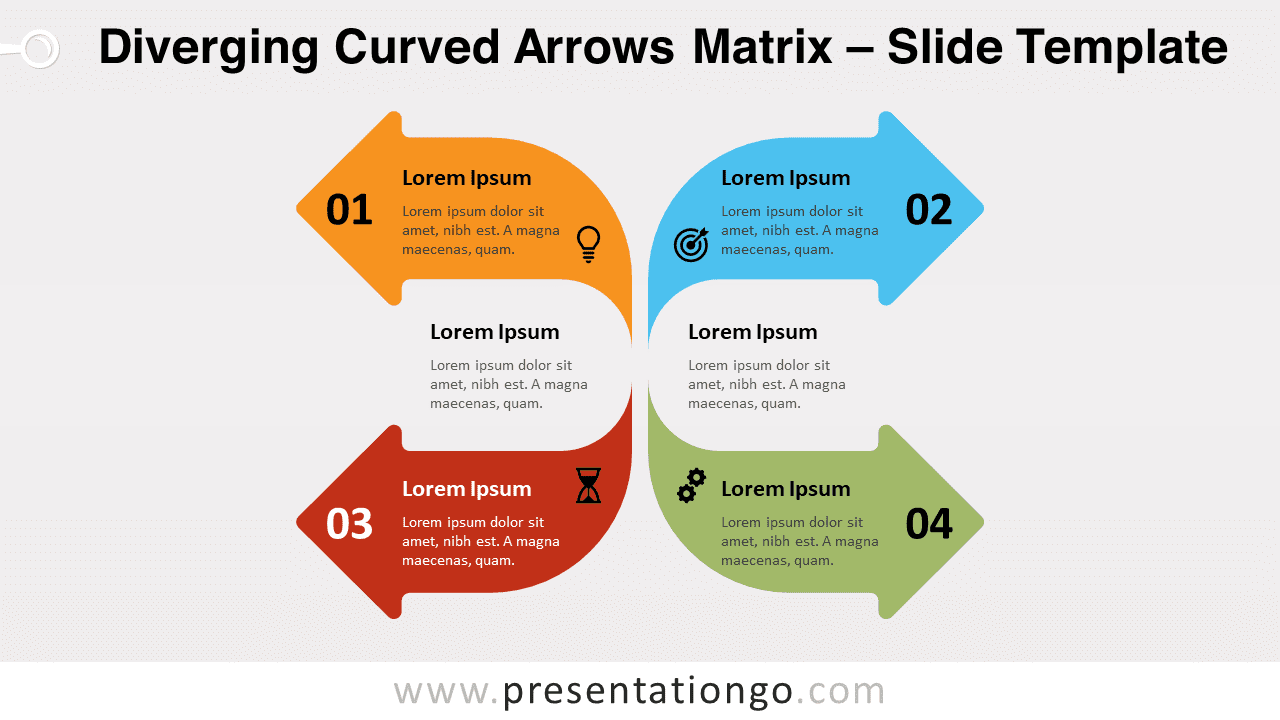
Free diverging curved arrows matrix for PowerPoint and Google Slides. Four arrows point out from a center point. Editable graphics.
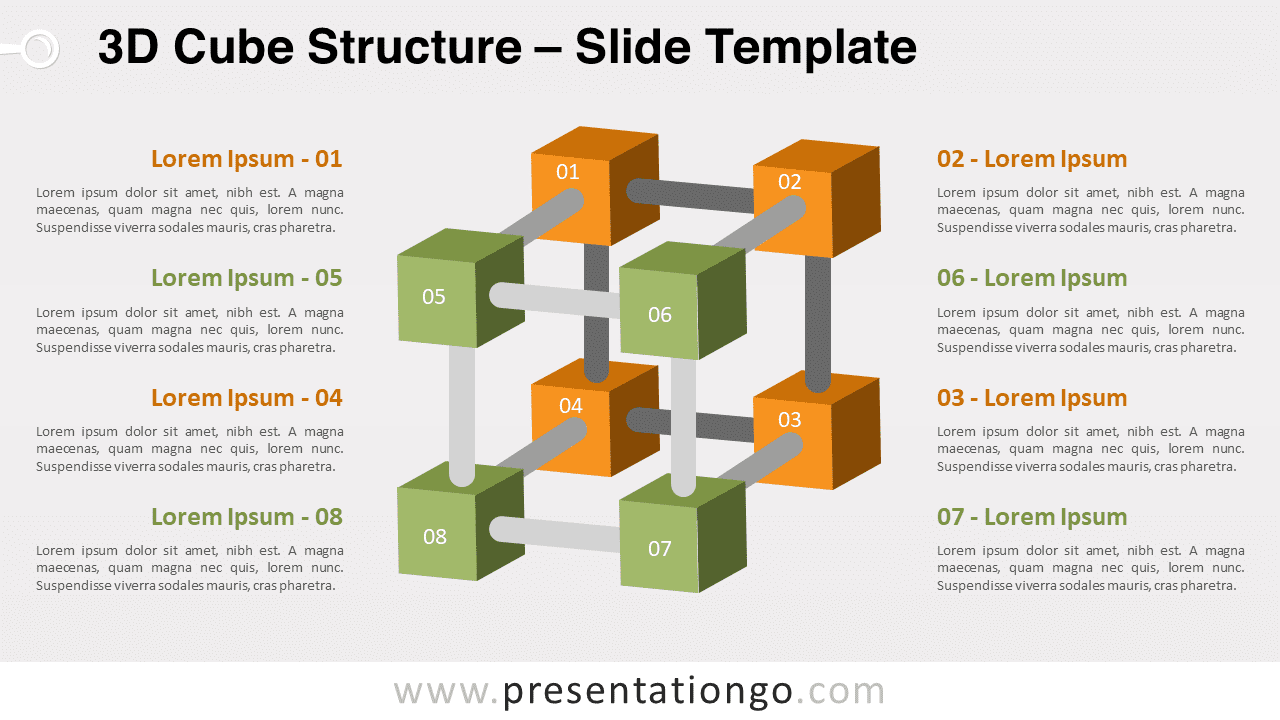
Free 3D cube structure for PowerPoint and Google Slides. A cuboid structure made of 8 cubes. Designed with the 3-D Rotation function (PPTX).
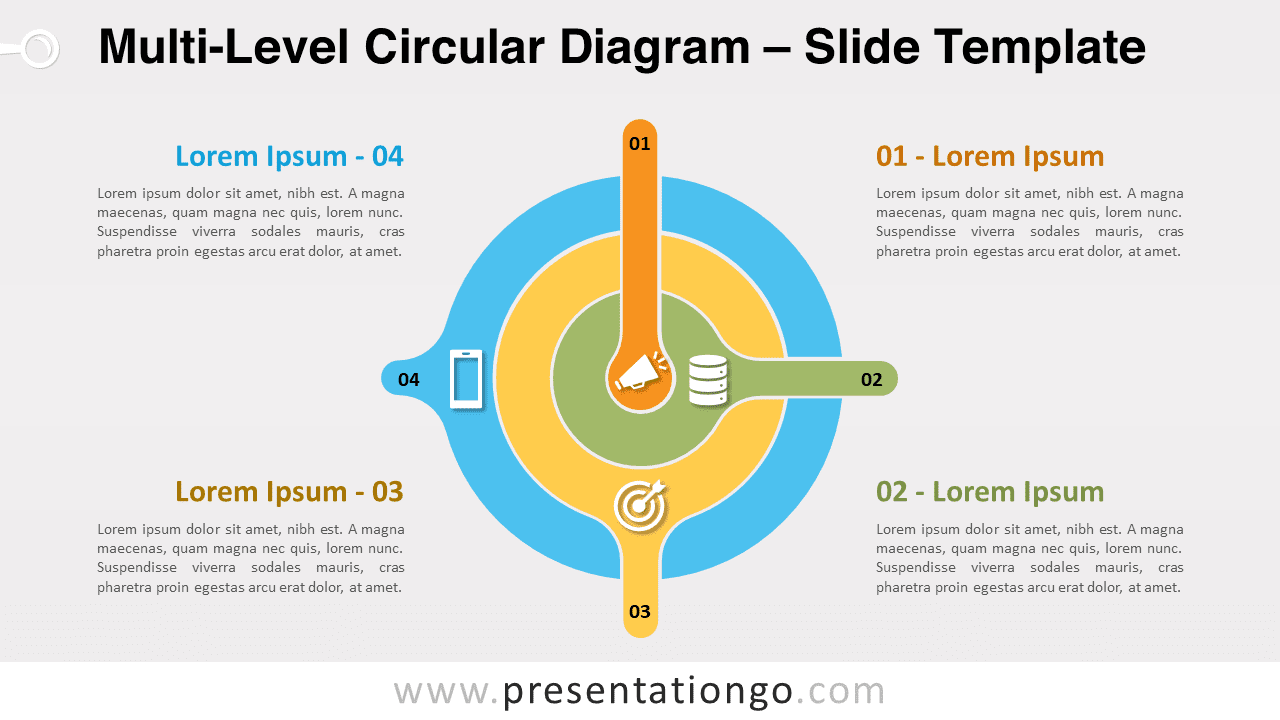
Free multi-level circular diagram for PowerPoint and Google Slides. Infographic with 4 concentric ring shapes of different sizes and colors.
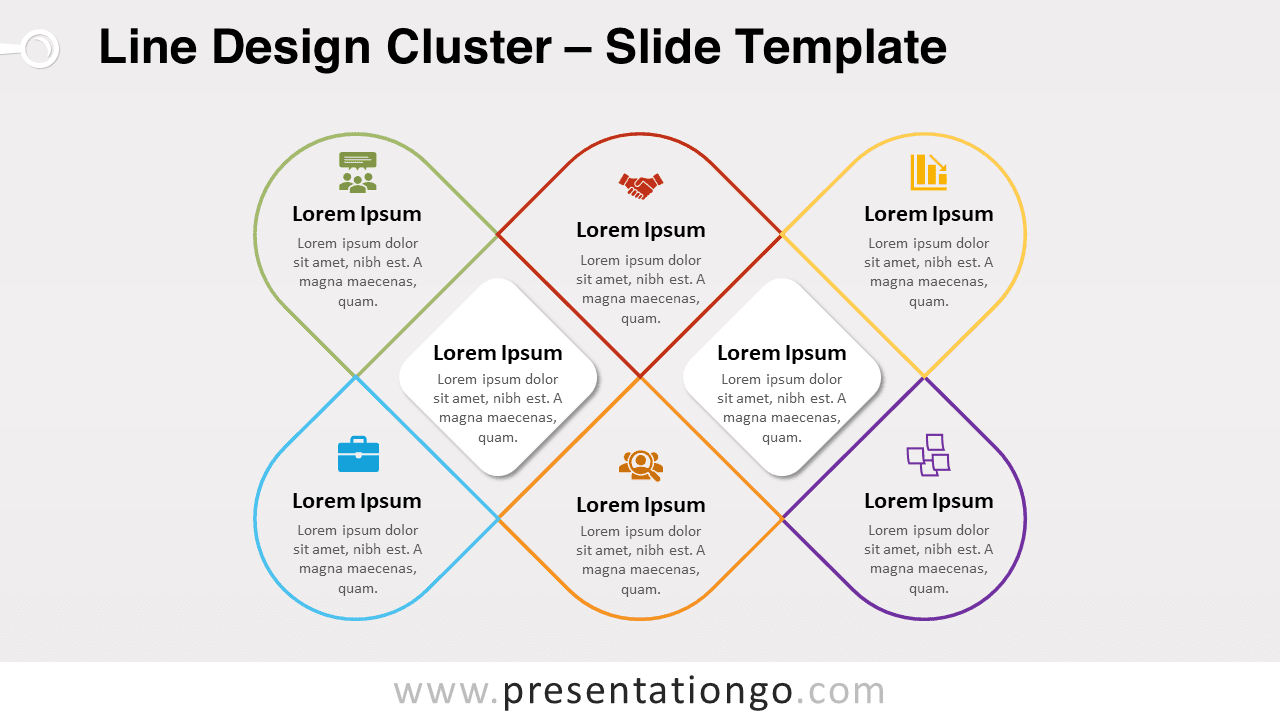
Free line design cluster for PowerPoint and Google Slides. A nice infographic to illustrate 6 or 8 ideas. Editable graphics.
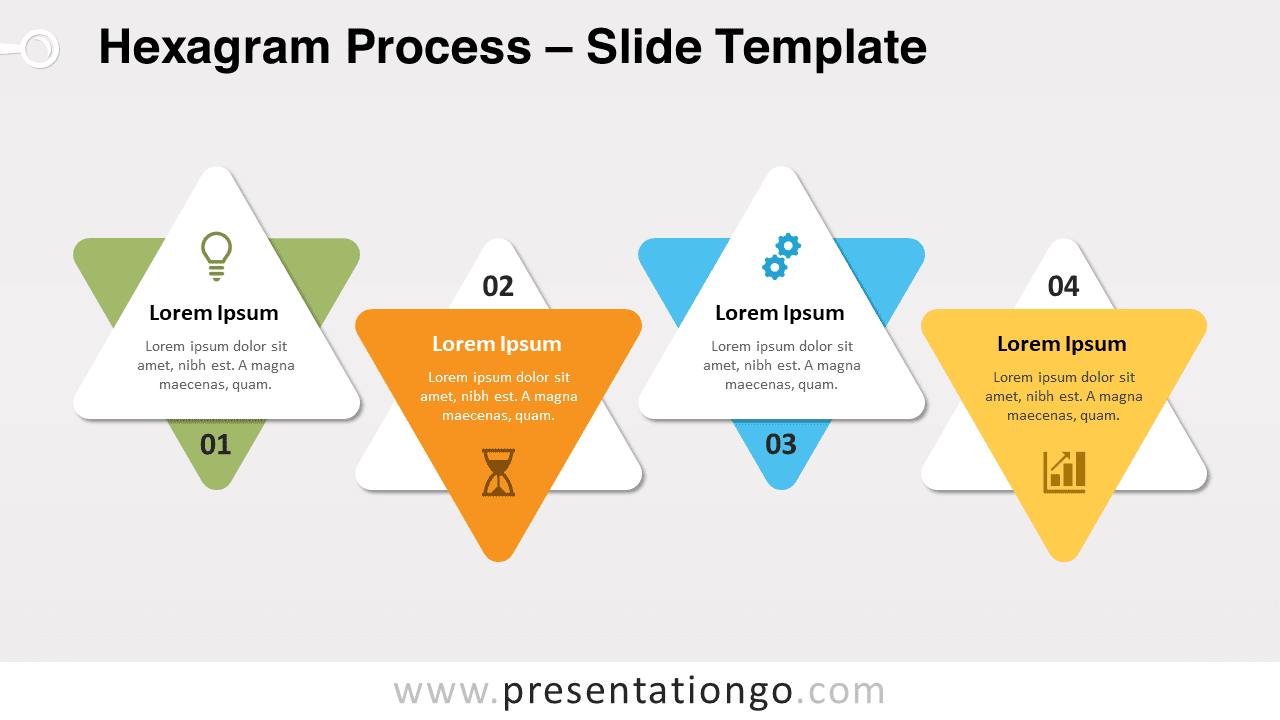
Free hexagram process for PowerPoint and Google Slides. A horizontal series of six-pointed modern stars. Editable graphics.
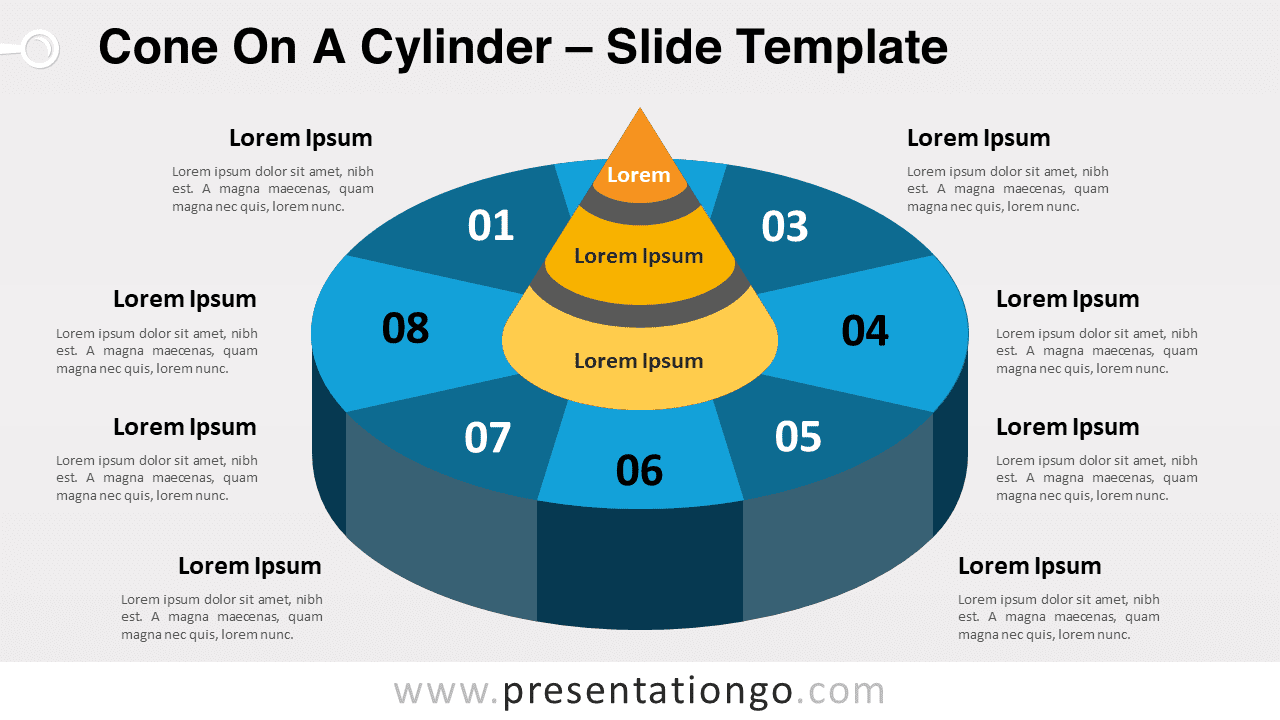
Free cone on a cylinder for PowerPoint and Google Slides. An original cycle diagram with 8 steps or options. Editable graphics.
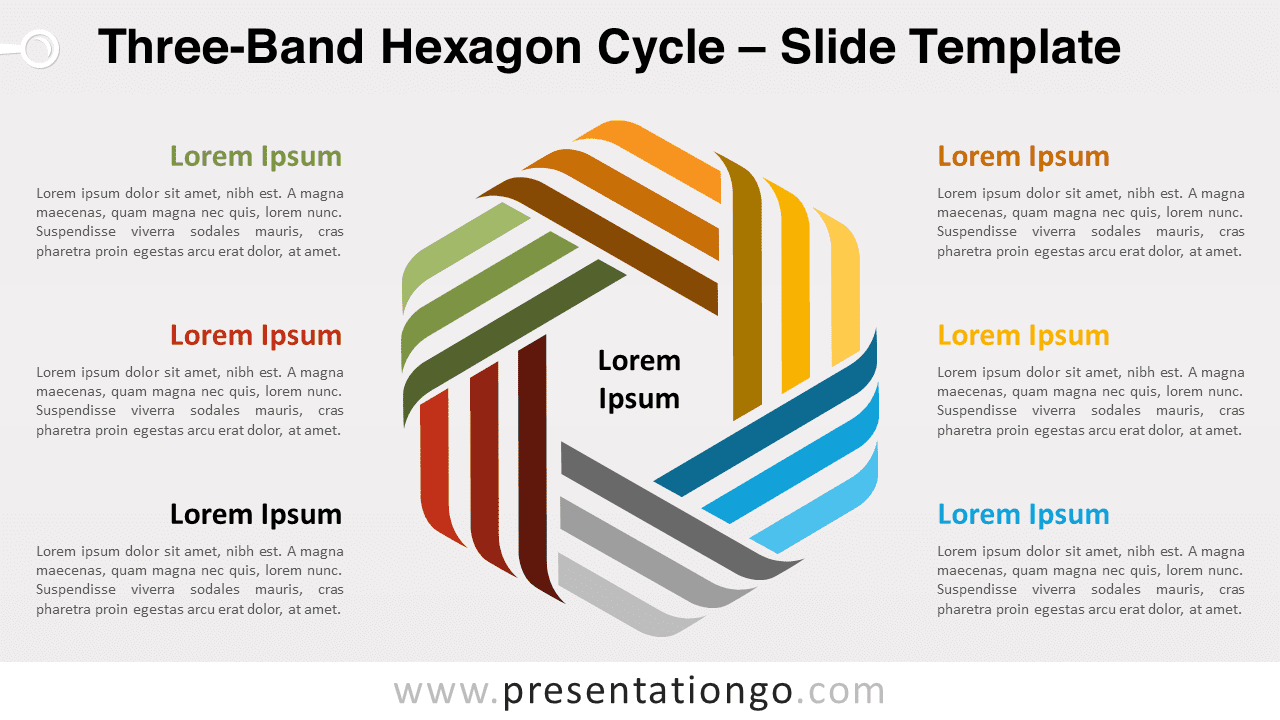
Free three-band hexagon Cycle for PowerPoint and Google Slides. A hexagon cycle process diagram. Editable graphics.
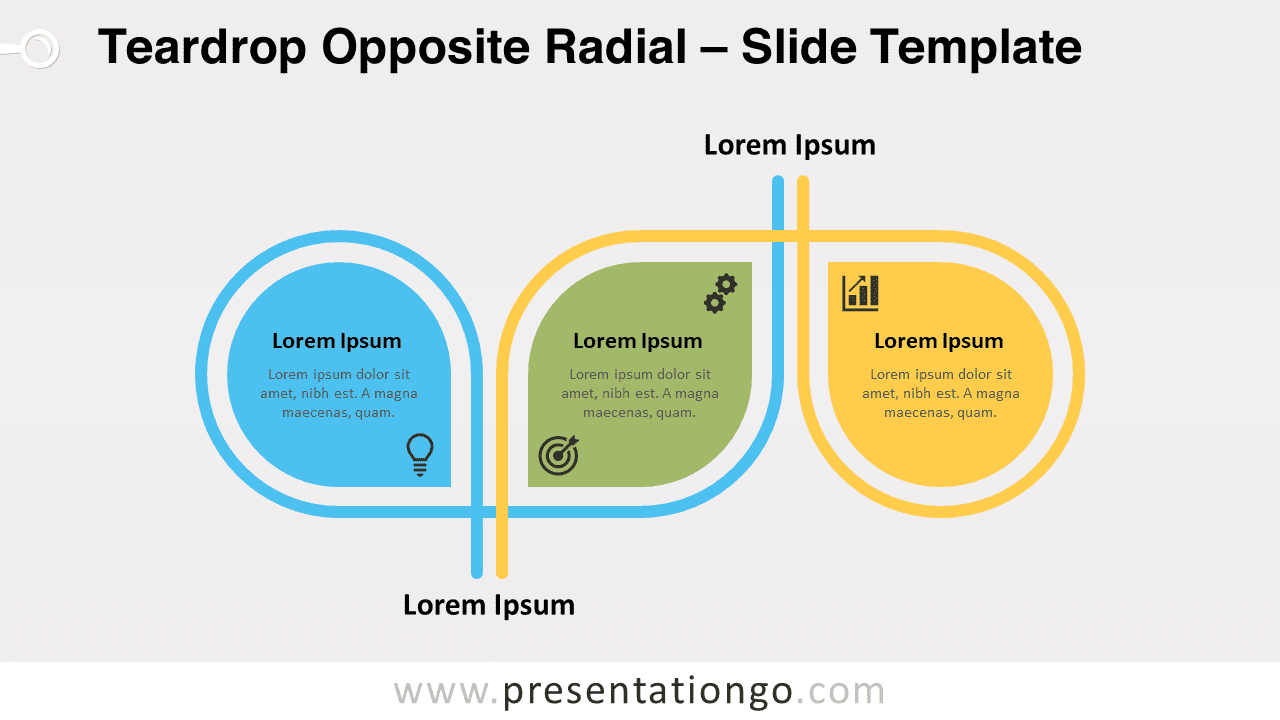
Free teardrop opposite radial for PowerPoint and Google Slides. A geometric radial diagram with 2 teardrop shapes linked to a central idea.
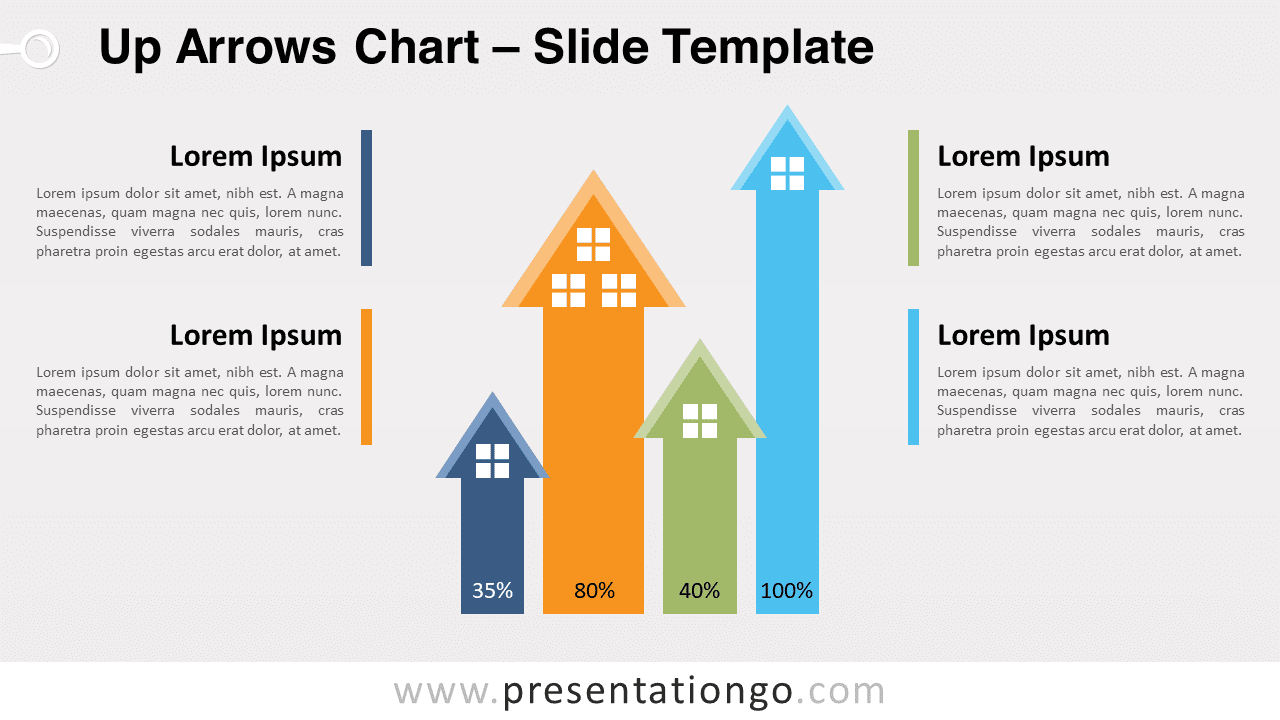
Free up-arrows chart for PowerPoint and Google Slides. Replace your data-driven column charts with easy-to-adjust up-arrows.
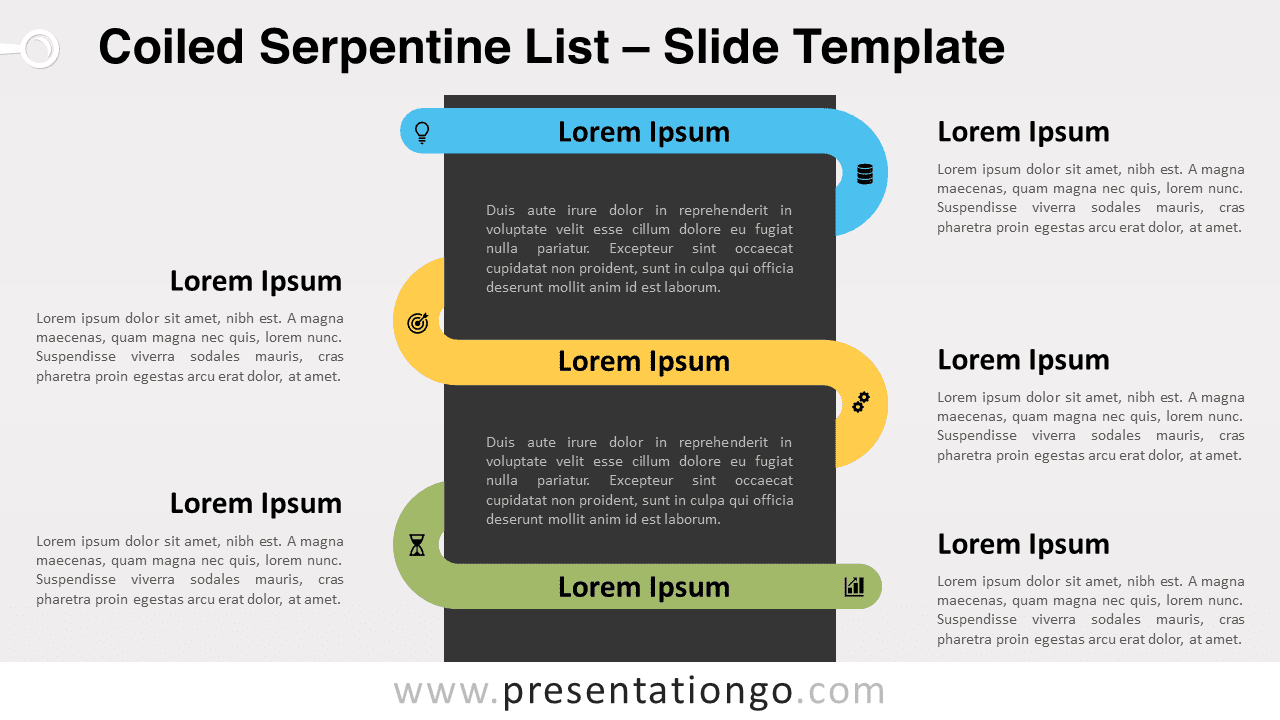
Free coiled serpentine list for PowerPoint and Google Slides. A ribbon wrapped around a vertical pole. Completely editable graphics.
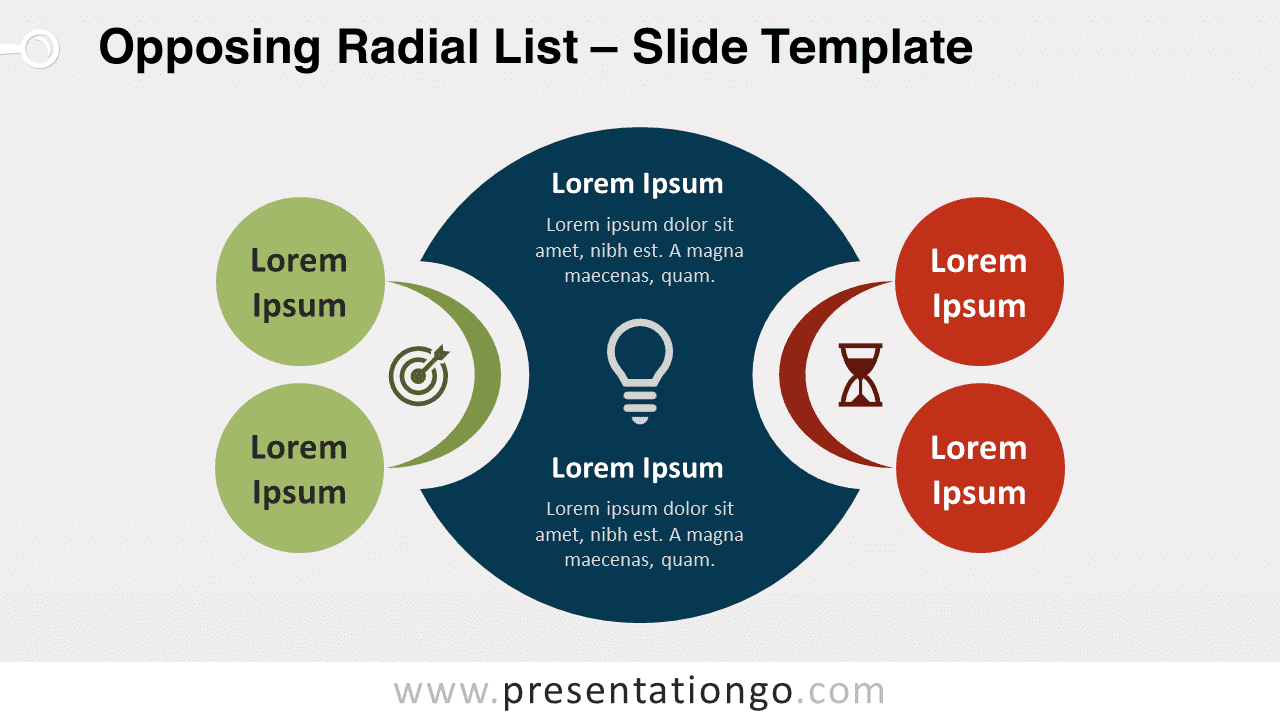
Free opposing radial list for PowerPoint and Google Slides. Use these two sets of two elements to explain a main central idea.
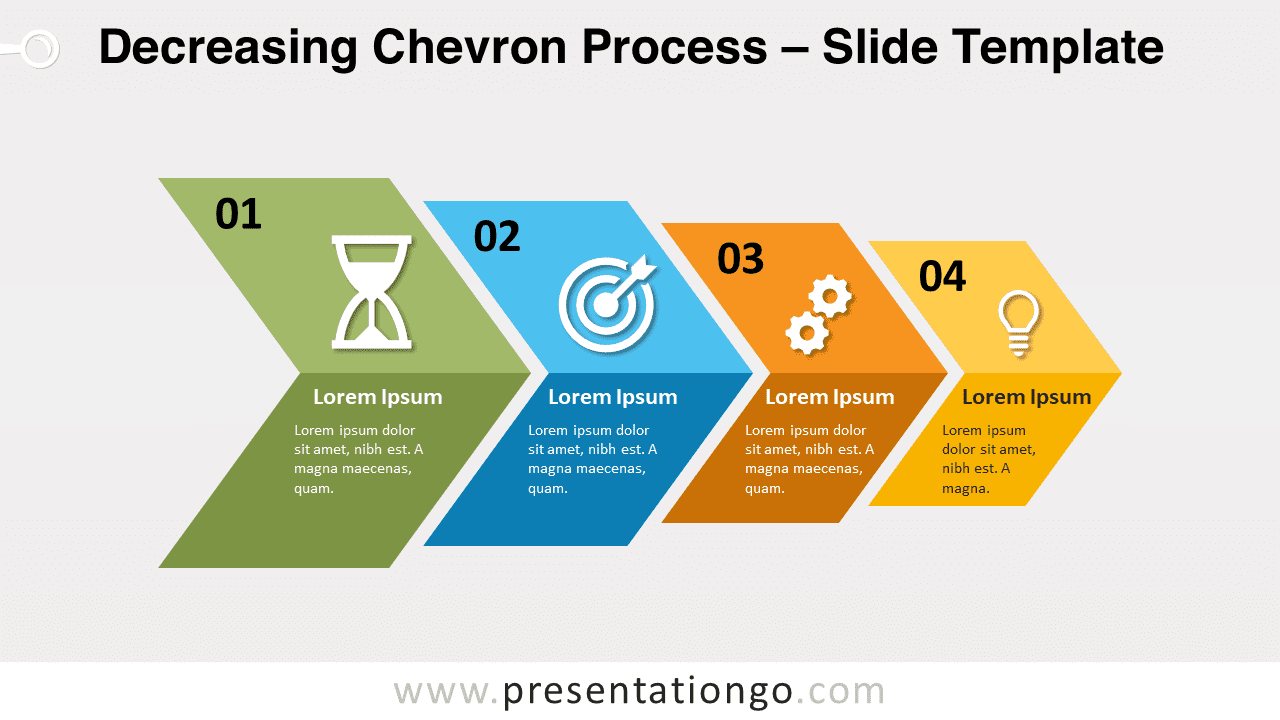
Free decreasing chevron process for PowerPoint and Google Slides. A horizontal series of chevron shapes highlighting a direction.
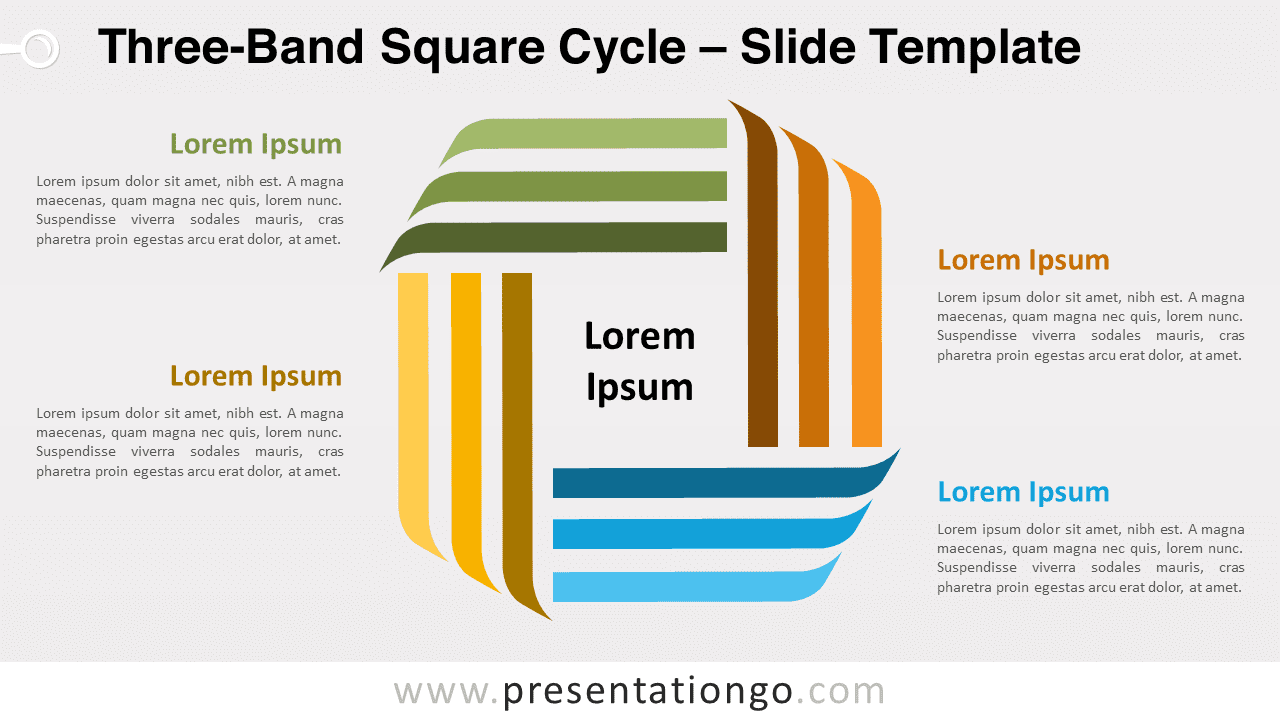
Free three-band square cycle for PowerPoint and Google Slides. A squared diagram with 3 ribbons and folded corners. Editable graphics.
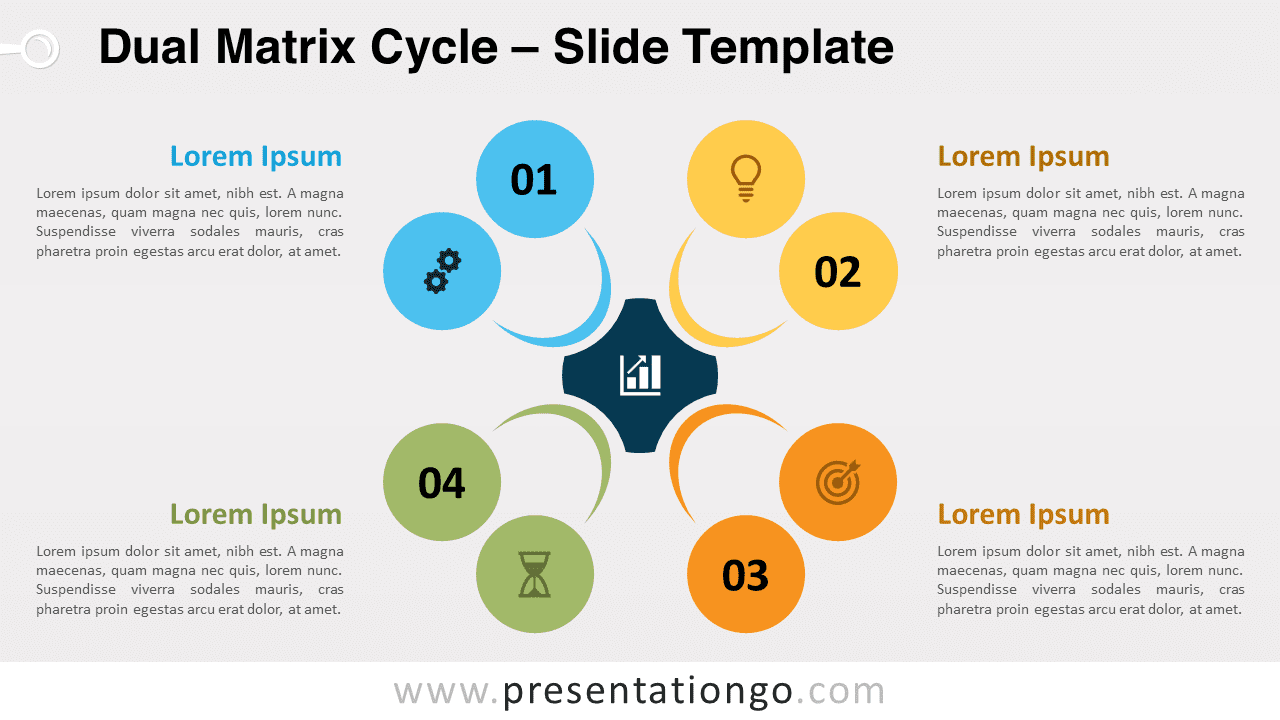
Free dual matrix cycle for PowerPoint and Google Slides. An editable radial diagram with 8 circles to illustrate 4 ideas or concepts.
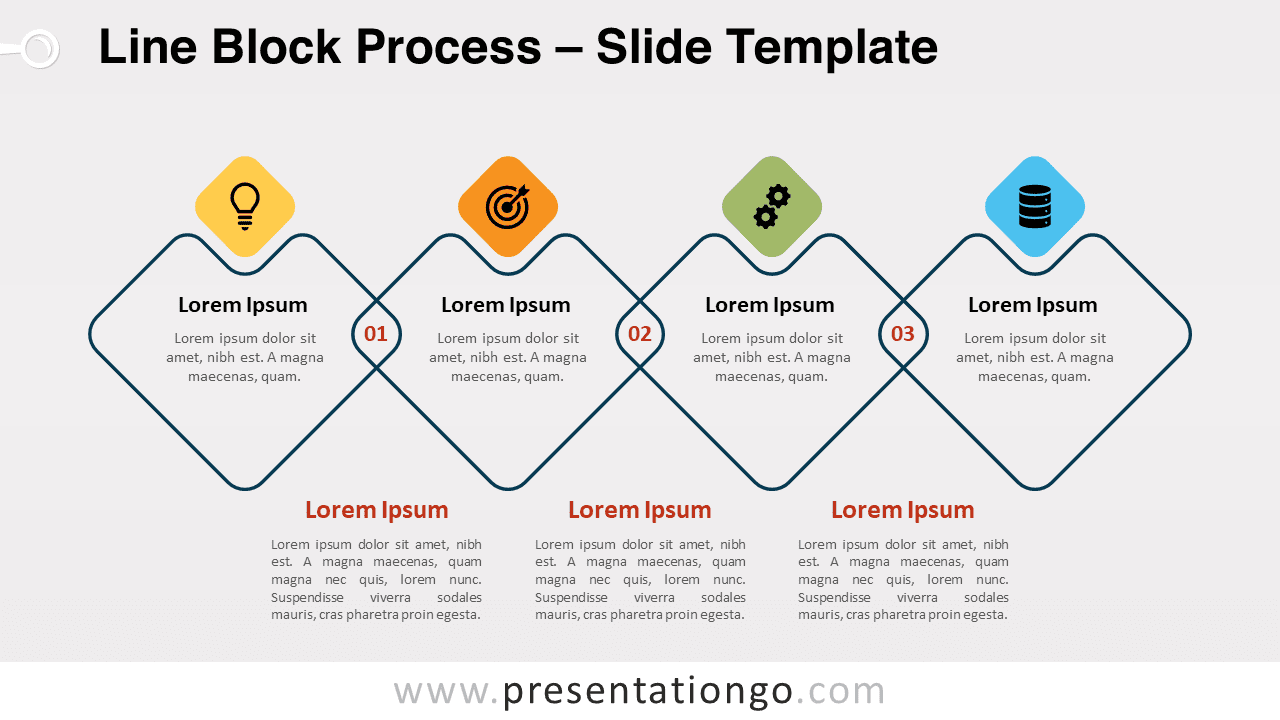
Free line block process for PowerPoint and Google Slides. A horizontal series of line design diamond shapes with icons and numbers.
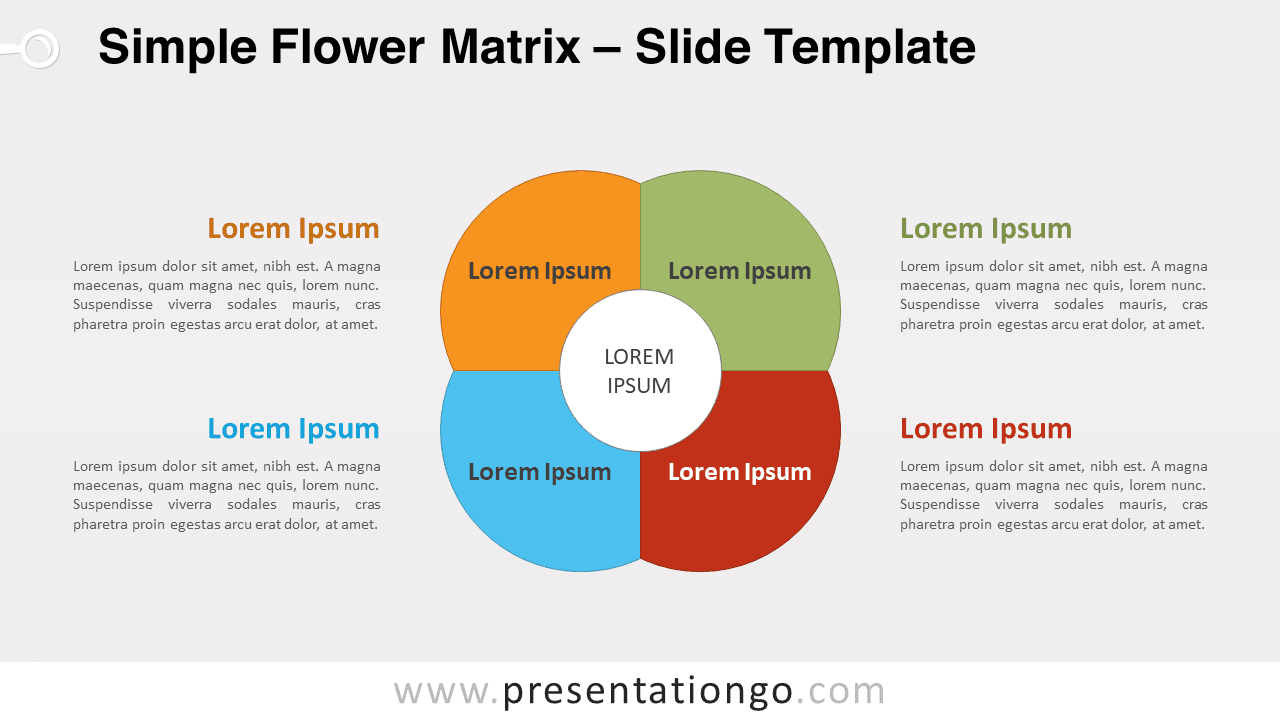
Free simple flower matrix for PowerPoint and Google Slides. Use this straightforward graphic for a matrix or a 4-step circular process.
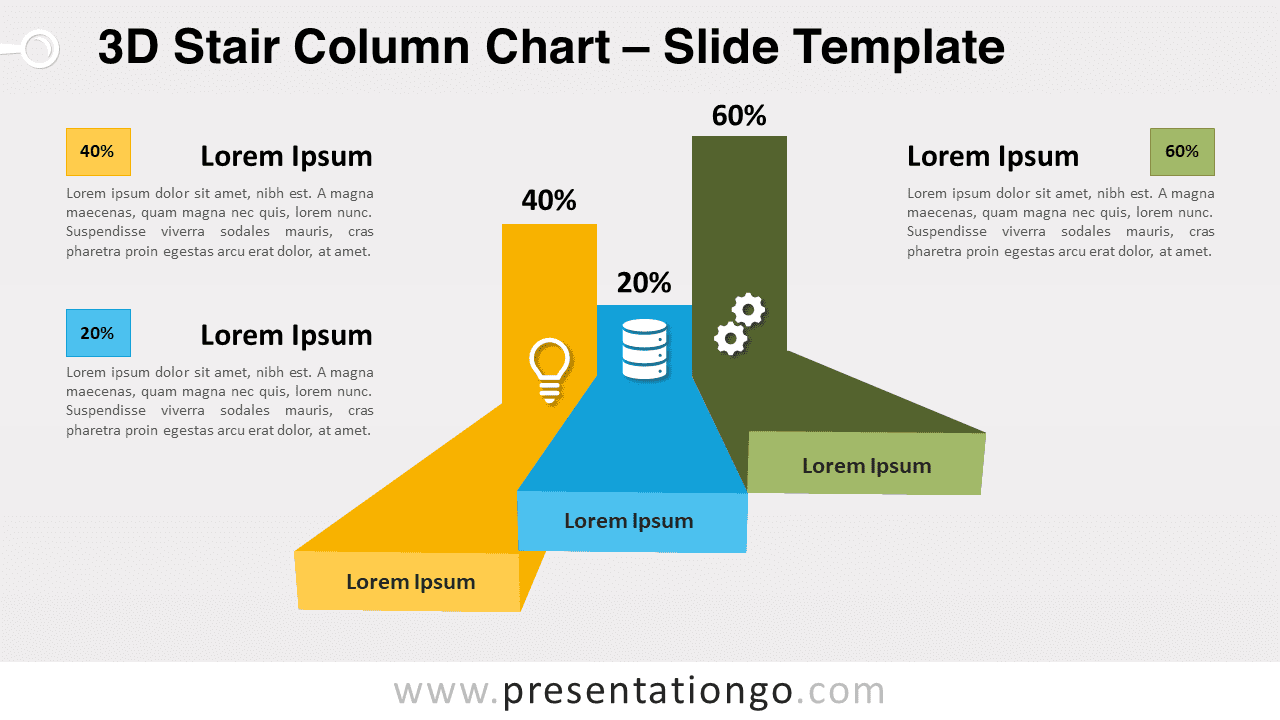
Free 3D stair column chart for PowerPoint and Google Slides. A beautiful data visualization option to showcase 3 categories.
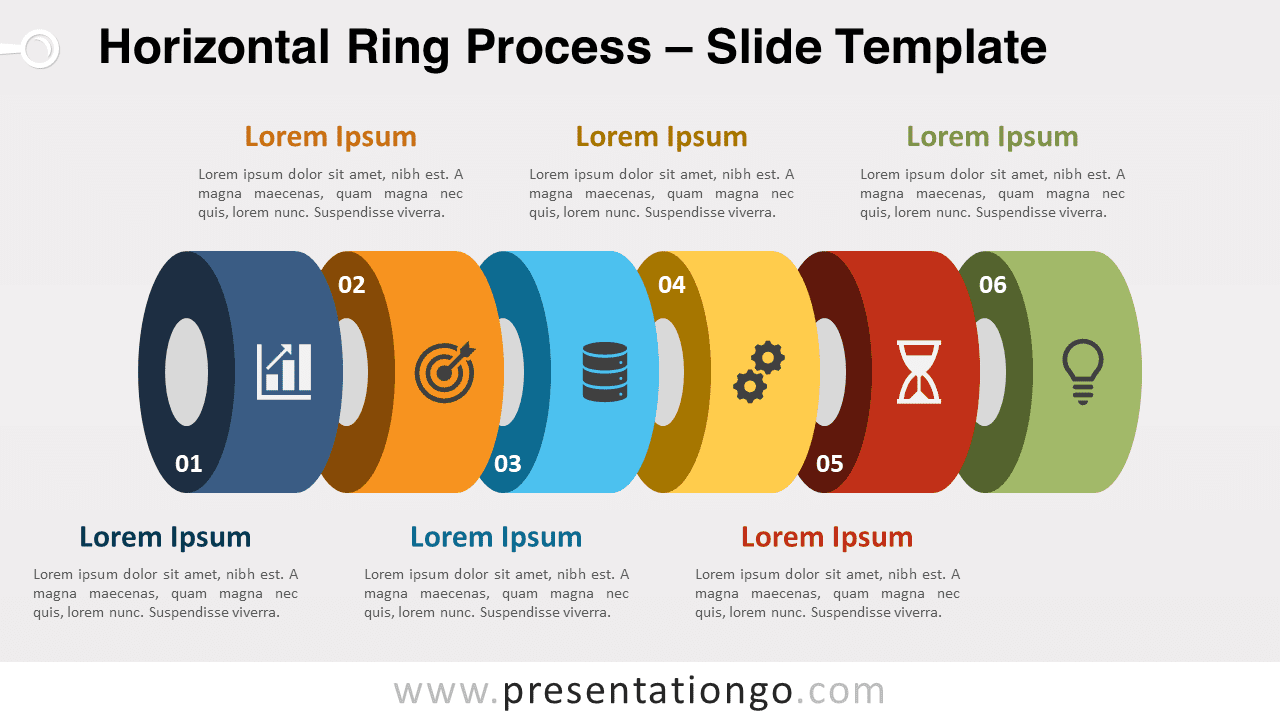
Free horizontal ring process for PowerPoint and Google Slides. A colorful alignment of 3D rings. Editable graphics.