Loading resources…
Total 3480 resources
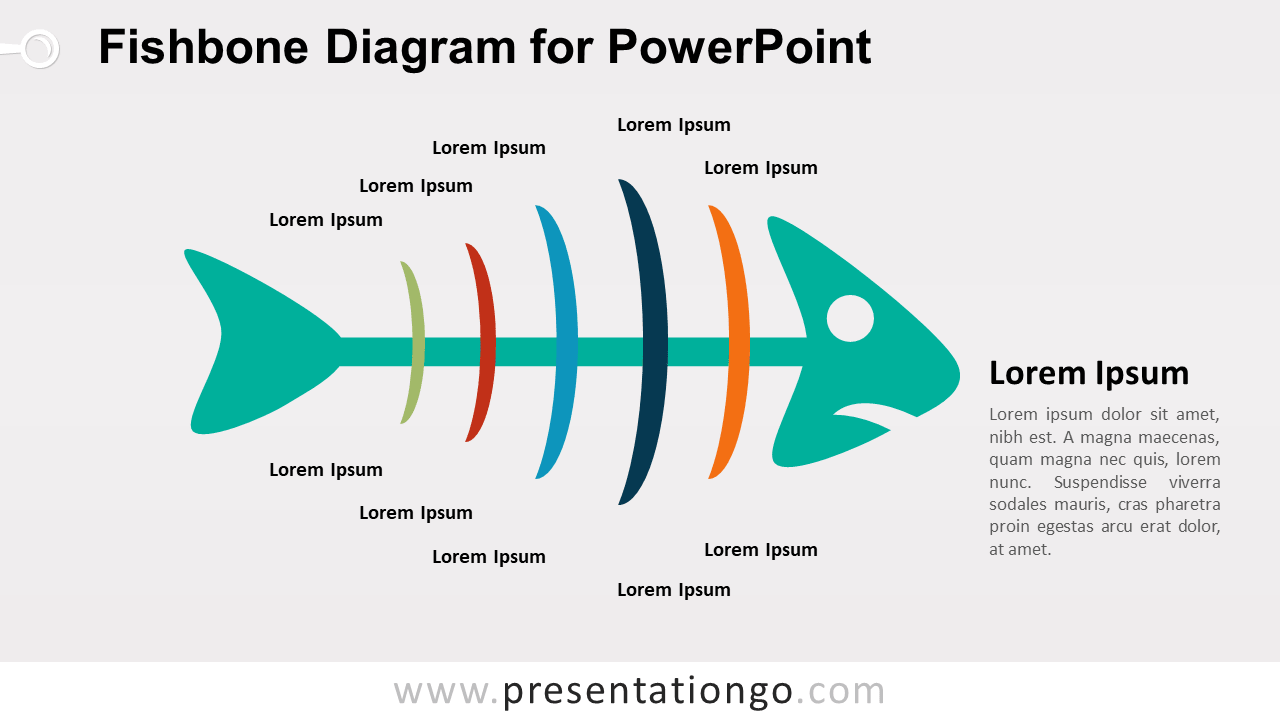
Free cause and effect fishbone diagram template for PowerPoint. Colored graphic design with 5 fish bone shapes. Editable graphics with text placeholder.
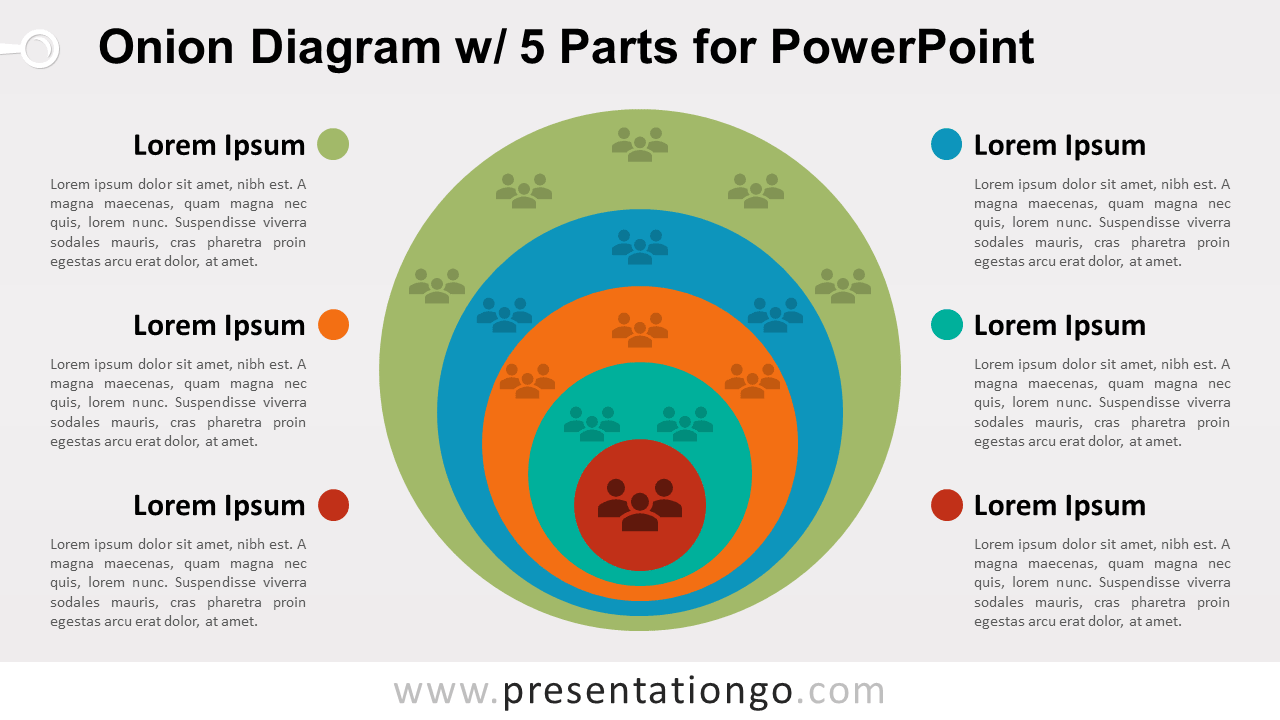
Free onion diagram template for PowerPoint. Colored graphic design using 5 nested circle shapes. Editable graphics with text placeholder. 2 slides.
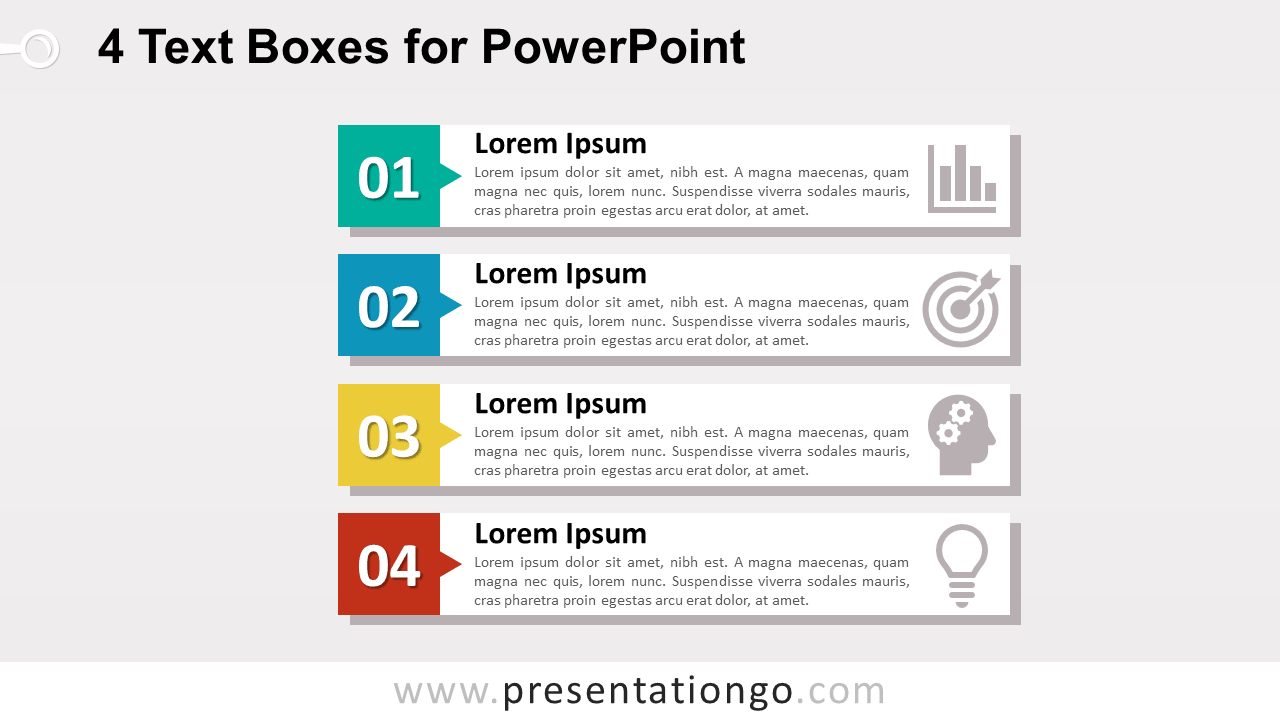
Free text box banners for PowerPoint. Template with 4 vertical block list banners, colored square for numbers/icons and rectangle for the text. 2 slides.
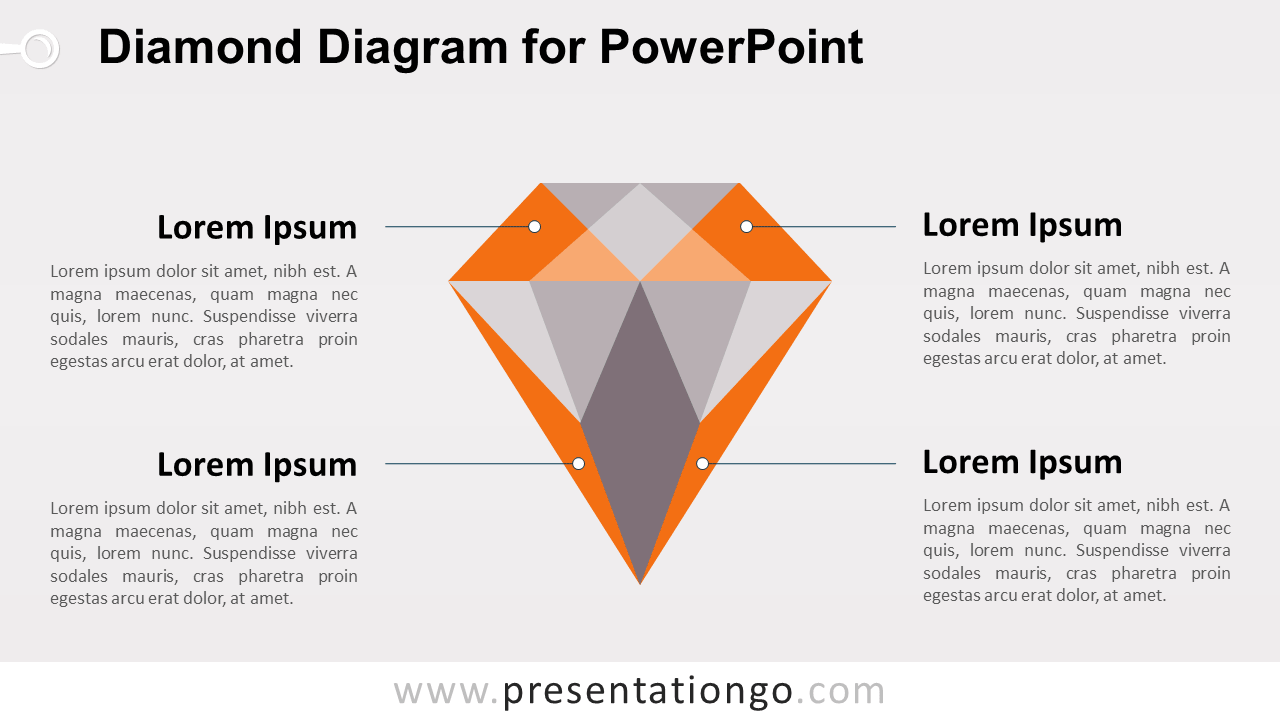
Free diamond diagram for PowerPoint. Colored graphic design using an editable diamond shape. To illustrate different (important) concepts, or as a metaphor.
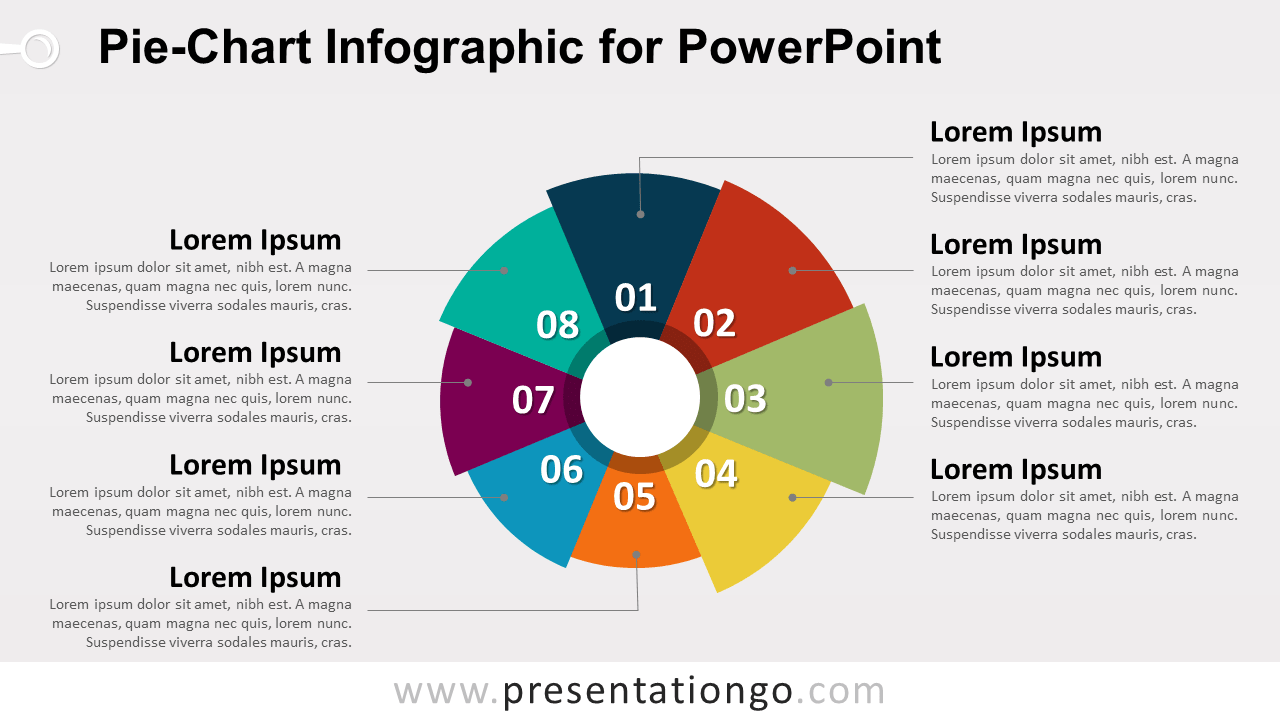
Free pie-chart infographic for PowerPoint. Colored graphic design with 8 editable parts or steps. Emphasizes the growing importance of interconnected parts.
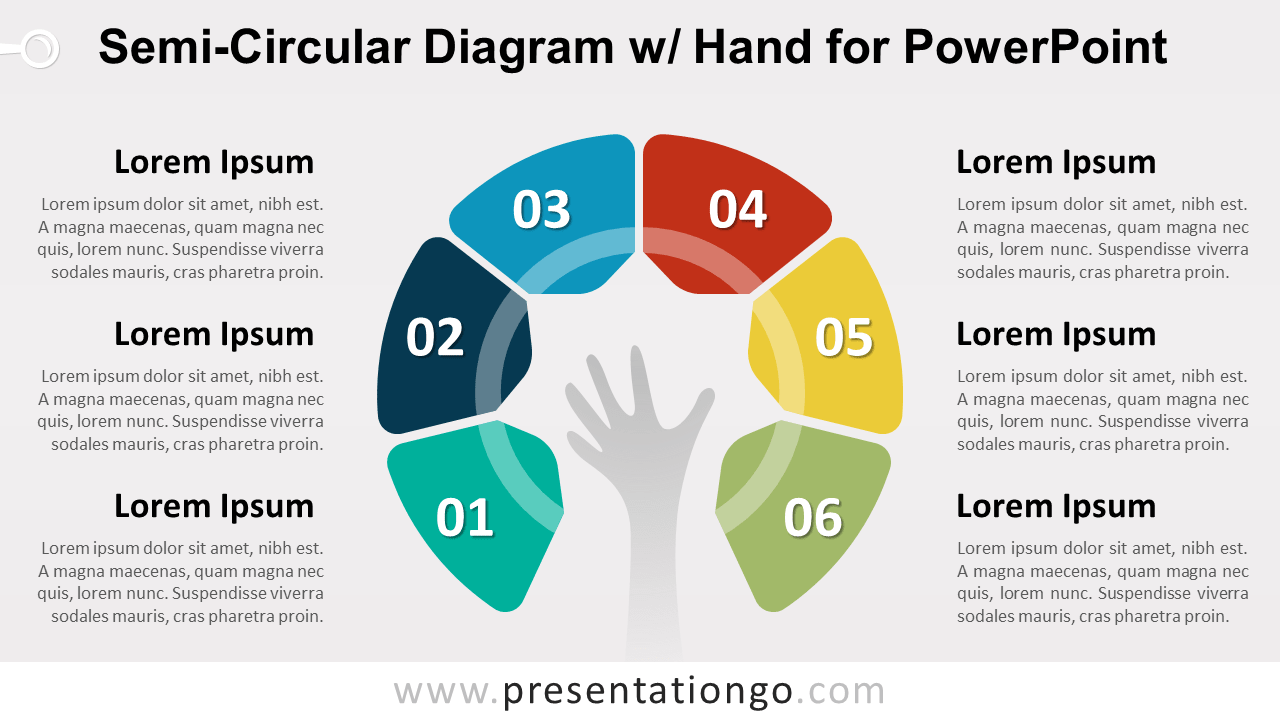
Free semi-circular diagram for PowerPoint. Colored graphic design with 6 steps and a hand in the center. Editable graphics.
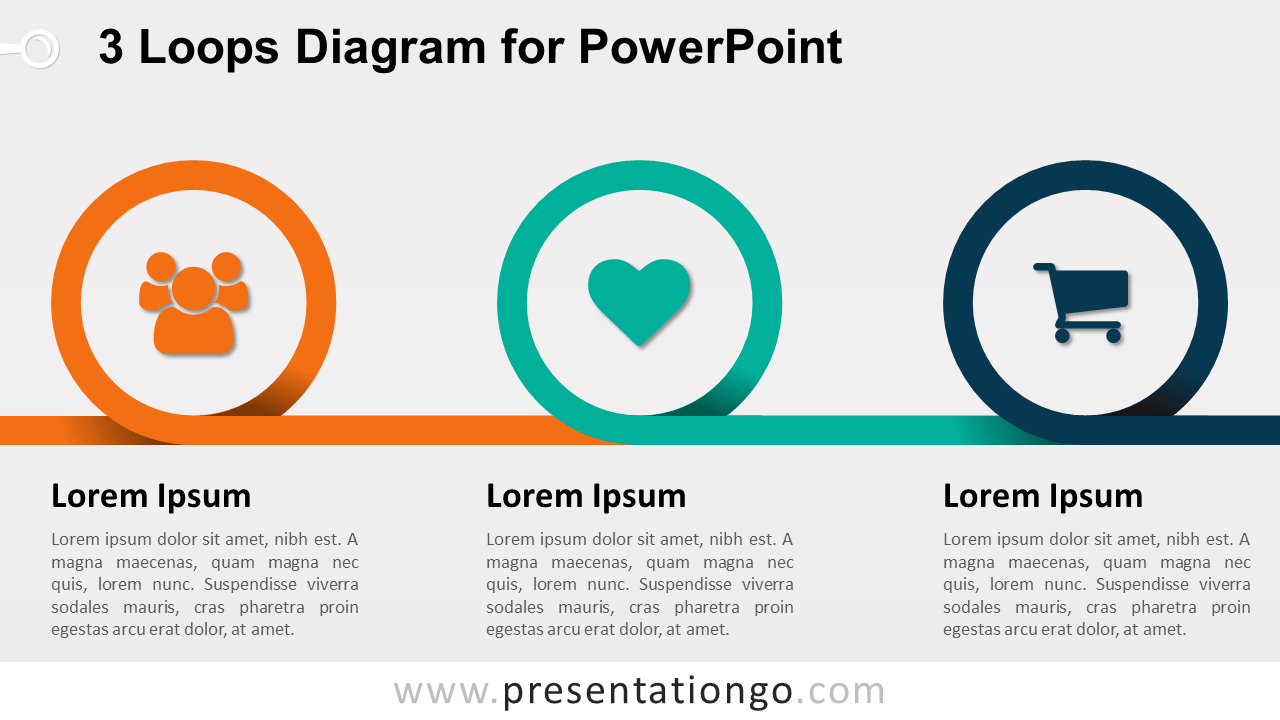
Free horizontal coil spring diagram with 3 loops for PowerPoint. For a progression or 3 sequential steps in a task, process, or workflow.
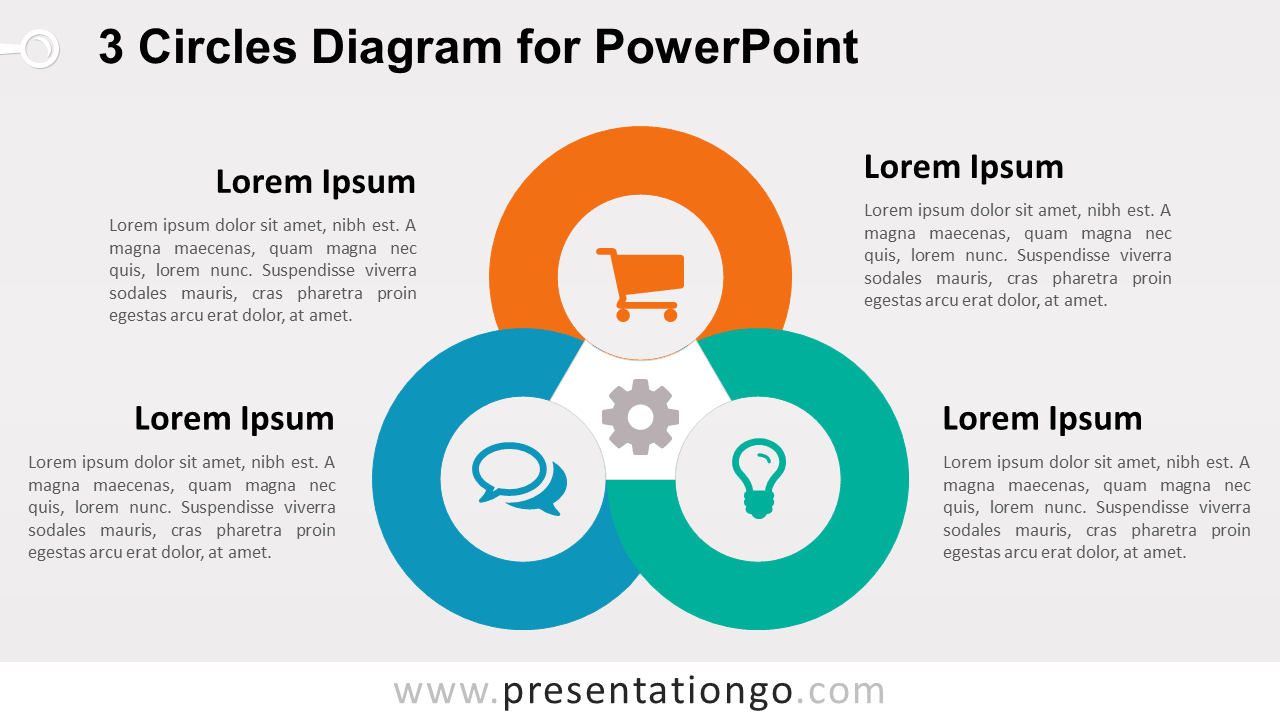
Free diagram with 3 interconnected circles for PowerPoint. Great to show overlapping or interconnected ideas or concepts. Alternative to the Venn diagram.
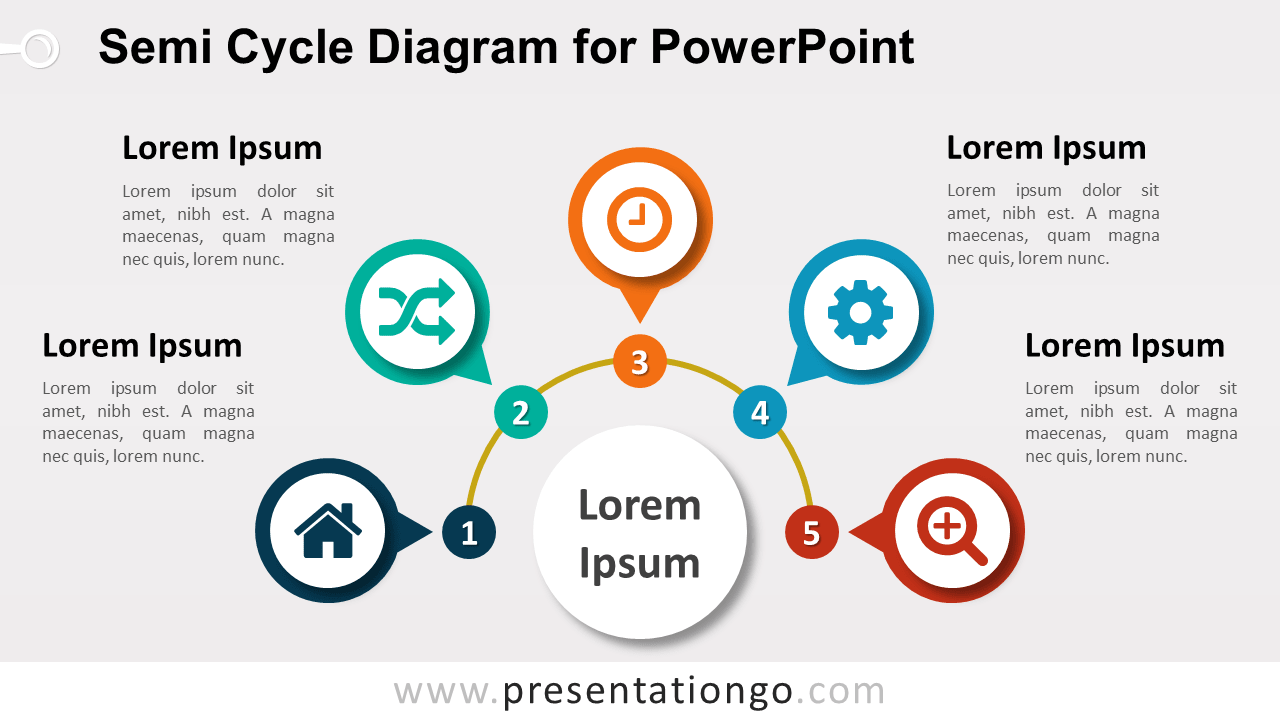
Free semi-cycle diagram for PowerPoint. Infographic design with 5 circular stages. Great as a timeline or to represent a series of interconnected ideas.
Free semi-cycle diagram for PowerPoint. Colored infographic design with 5 circular stages. Sequence of 5 stages, tasks, or events in a circular flow.
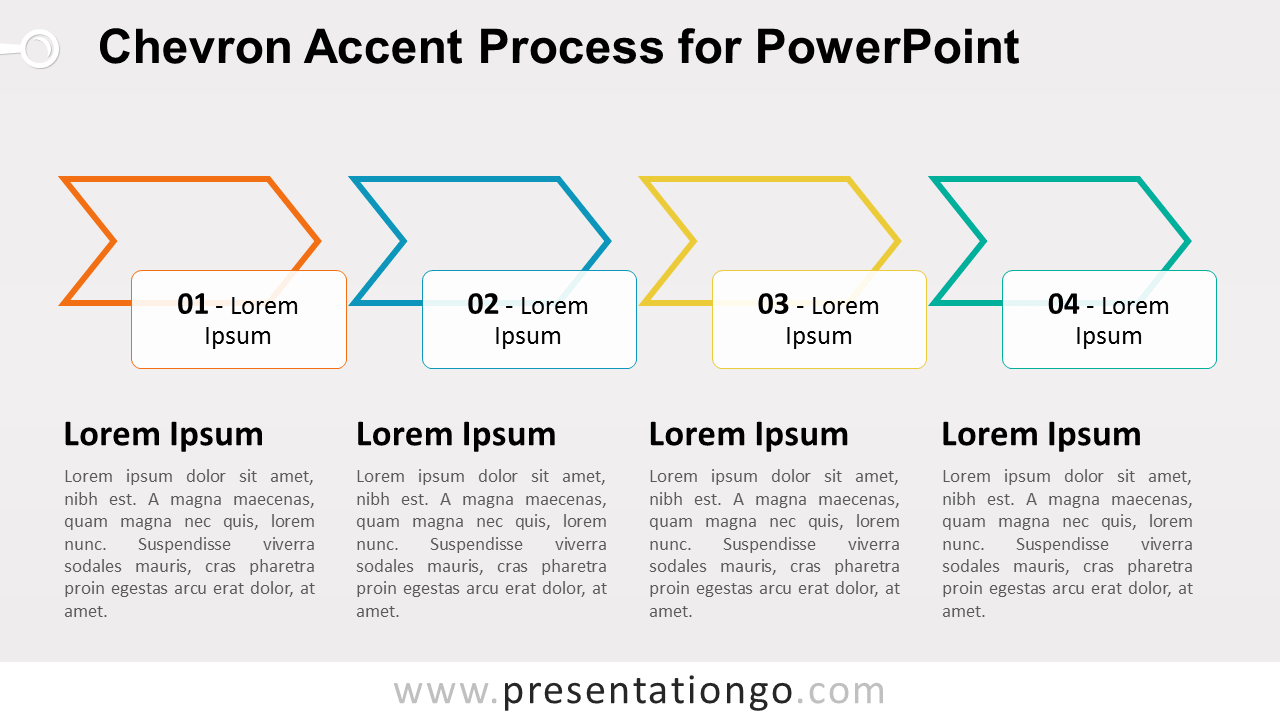
Free chevron accent process for PowerPoint. SmartArt graphic layout. Use this diagram to show sequential steps in a task, process, or workflow.
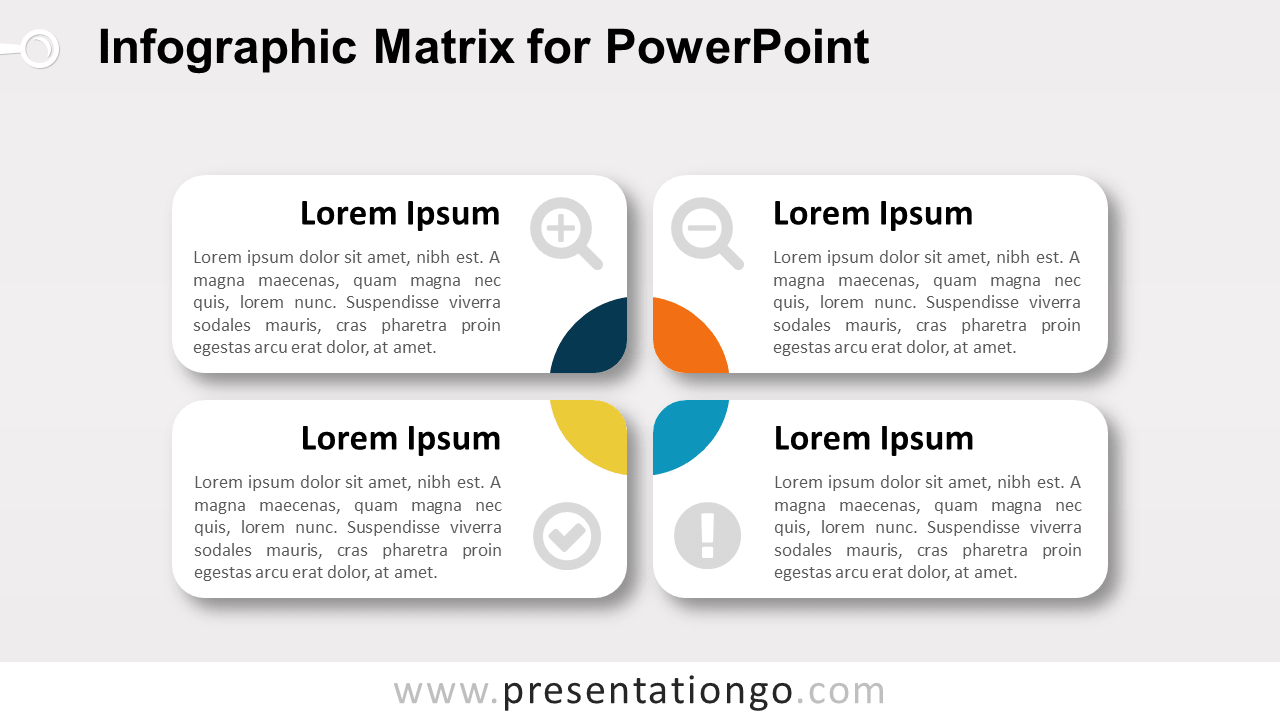
Free infographic matrix for PowerPoint. Editable graphics. Great to be used for business or marketing matrices like BCG, SWOT, Ansoff.
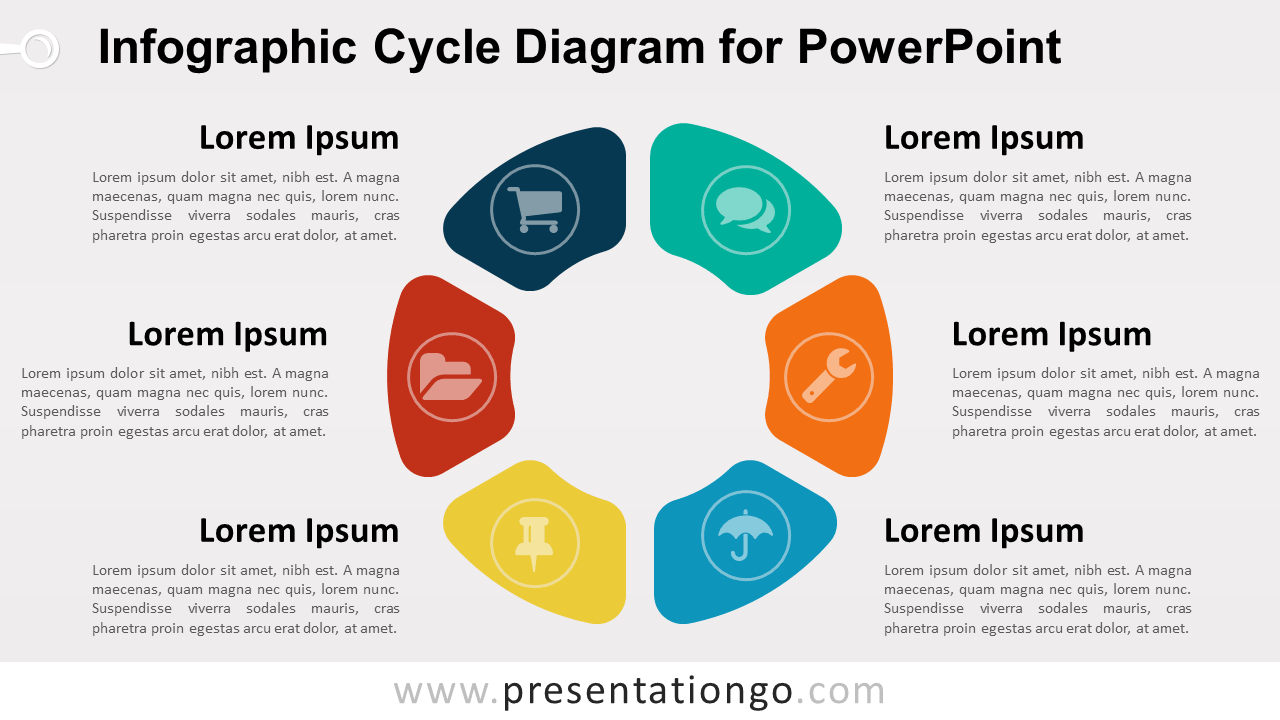
Free infographic cycle diagram for PowerPoint. Colored graphic design with 6 circular stages. Continuing sequence of 6 stages or events.
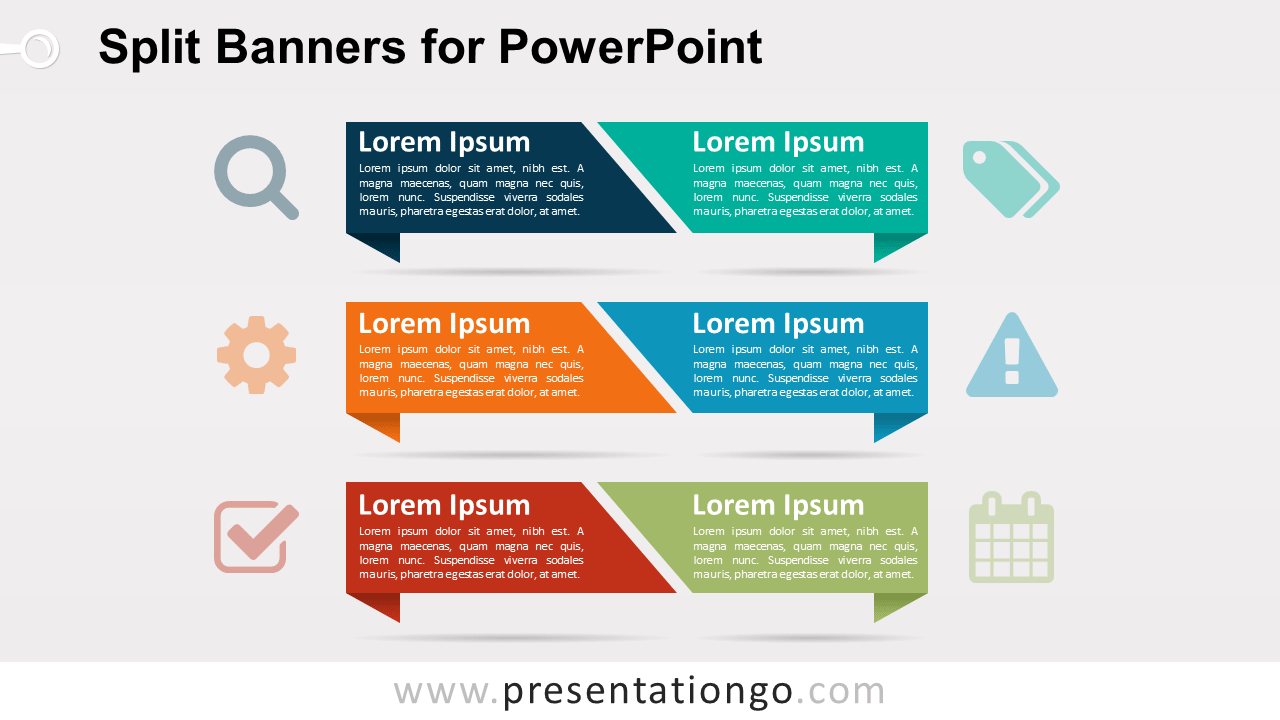
Free split banners with text for PowerPoint. 3 diagonally cut horizontal colored banners (or ribbons), with shadow effect. Editable graphics.
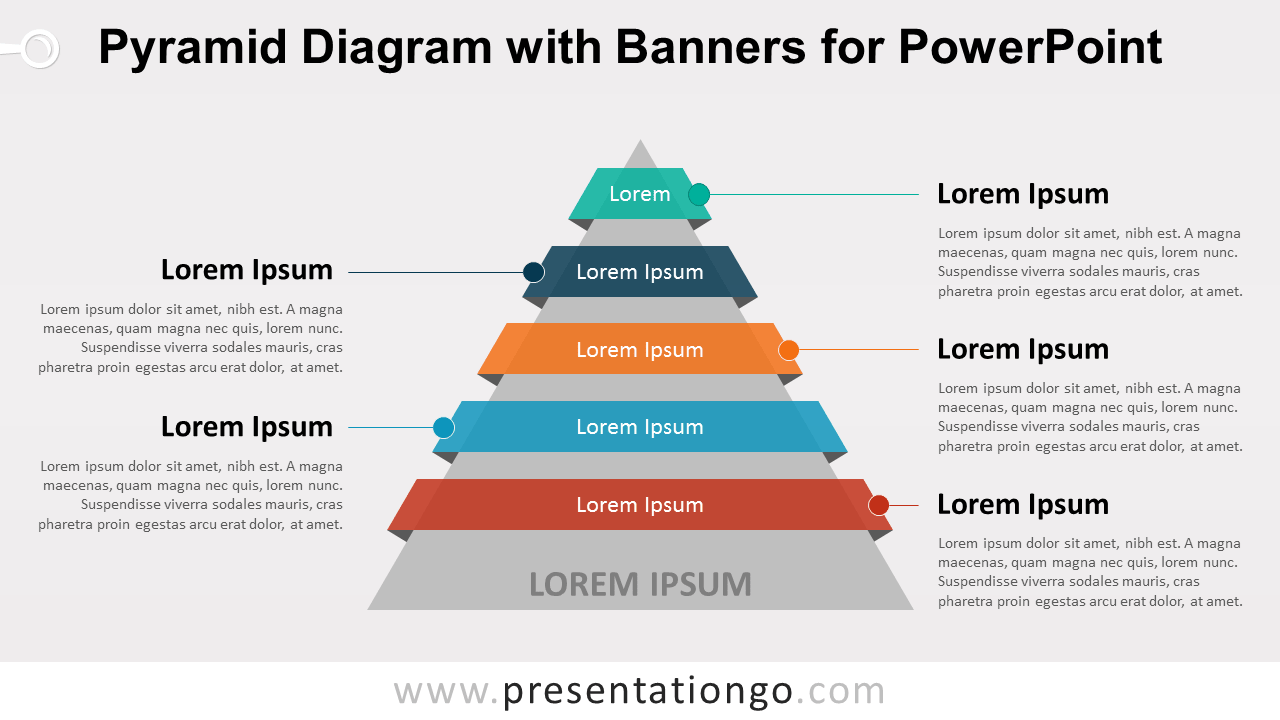
Free pyramid diagram with banners or ribbons for PowerPoint. Use this to show interconnected, or hierarchical relationships of 5 elements.
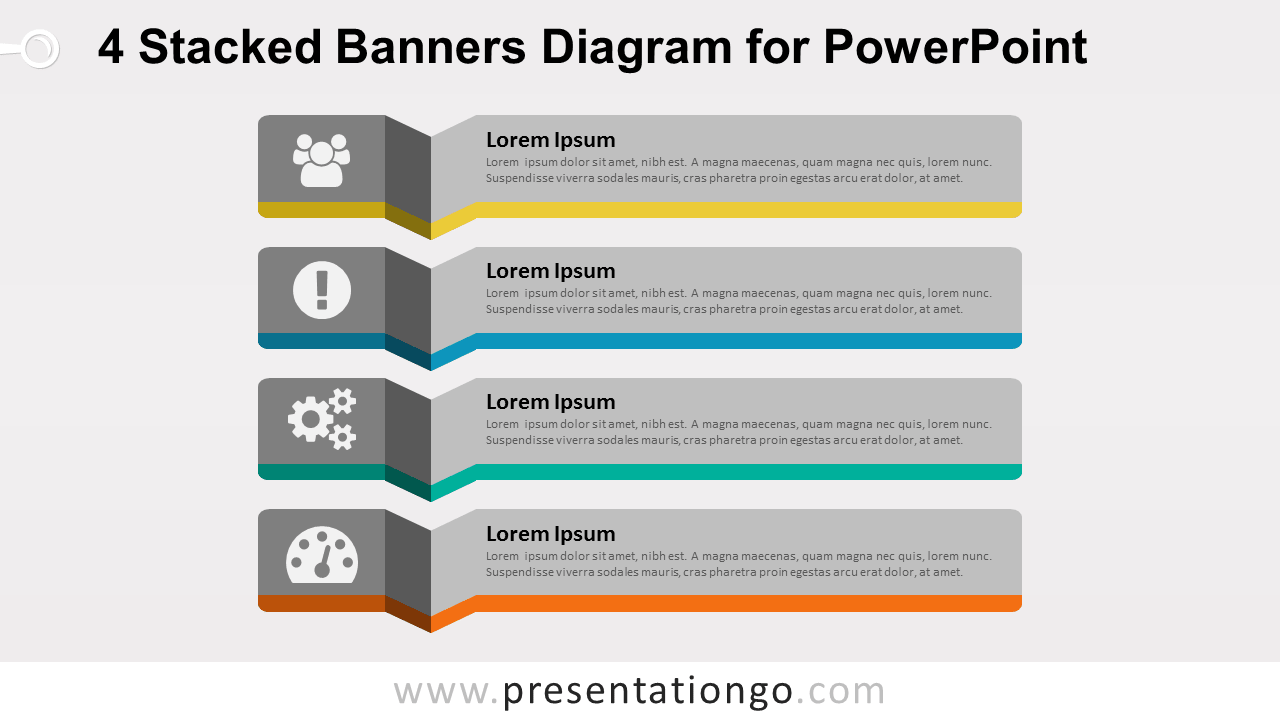
Free 4 stacked banners template for PowerPoint. Colored graphic design. Great to illustrate 4 ideas, concepts or groups of information.
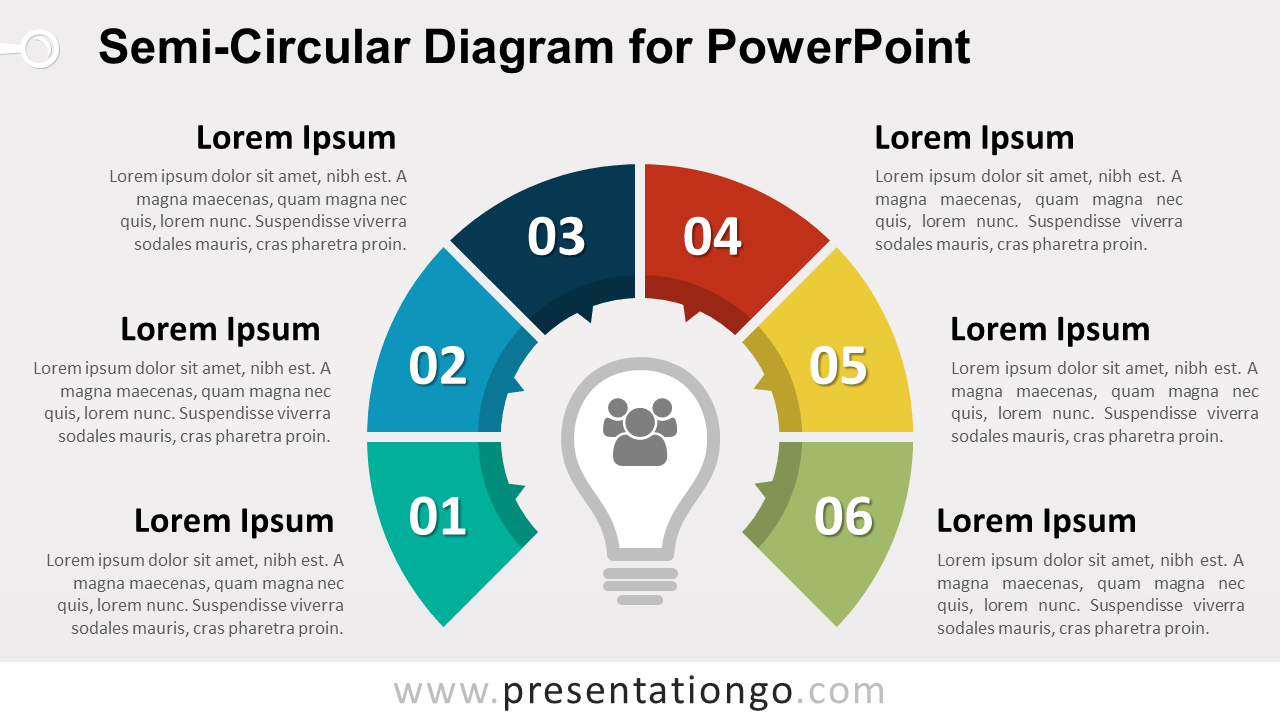
Free semi-circular diagram for PowerPoint. Colored graphic design with 6 steps and a light bulb in the center. Editable graphics.
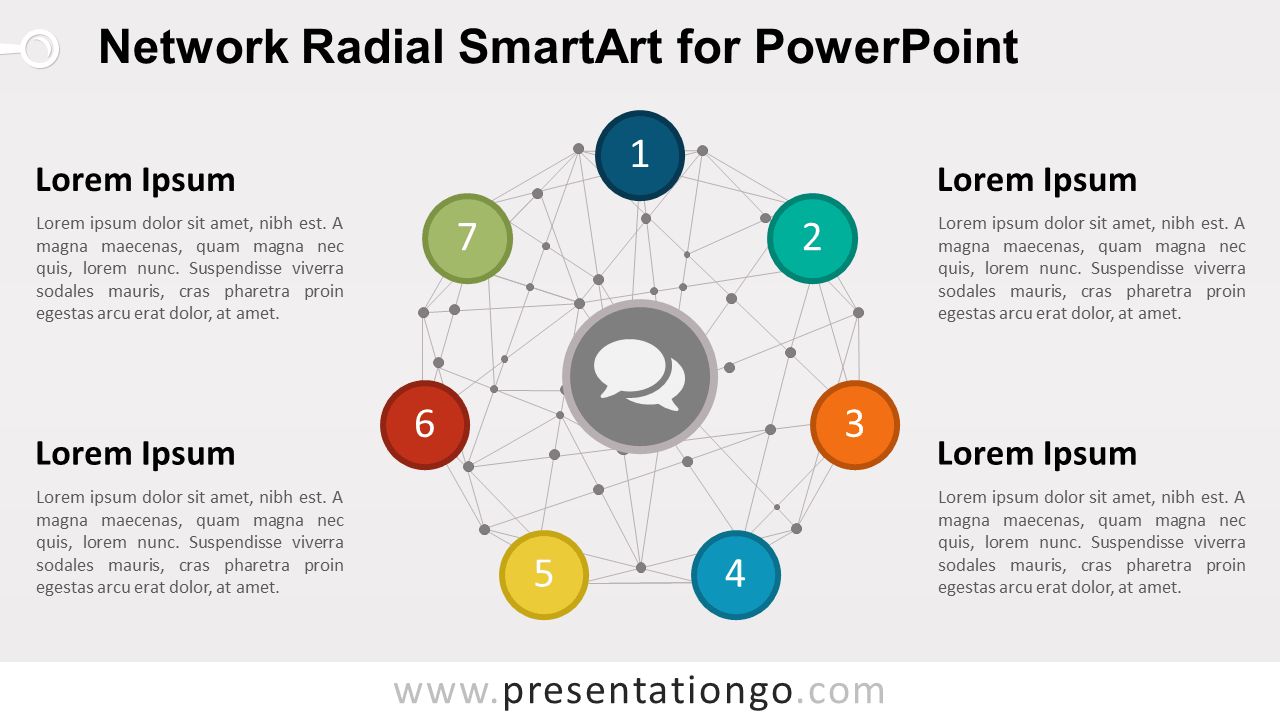
Free radial template with network for PowerPoint. Radial SmartArt graphic with a wire-frame network sphere. Colored graphic design.
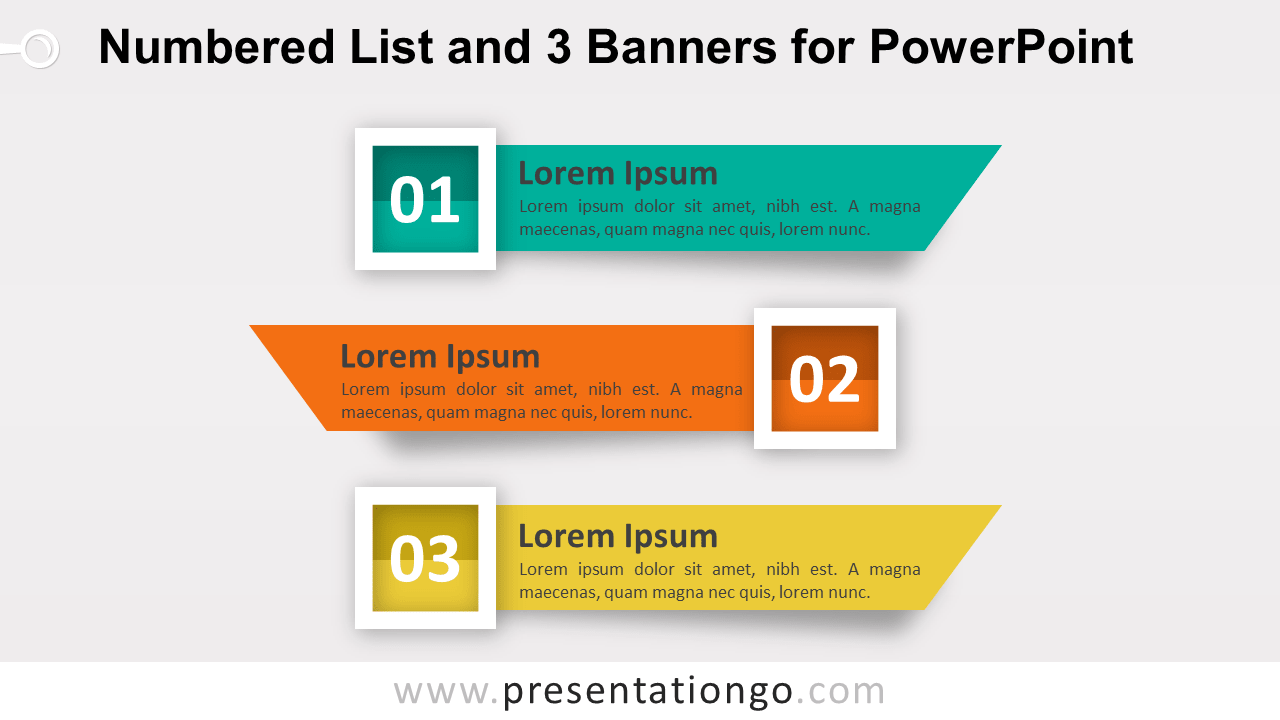
Free 3 numbered list template with 3 banners or ribbons for PowerPoint. Colored graphic design. Editable graphics with text placeholder.
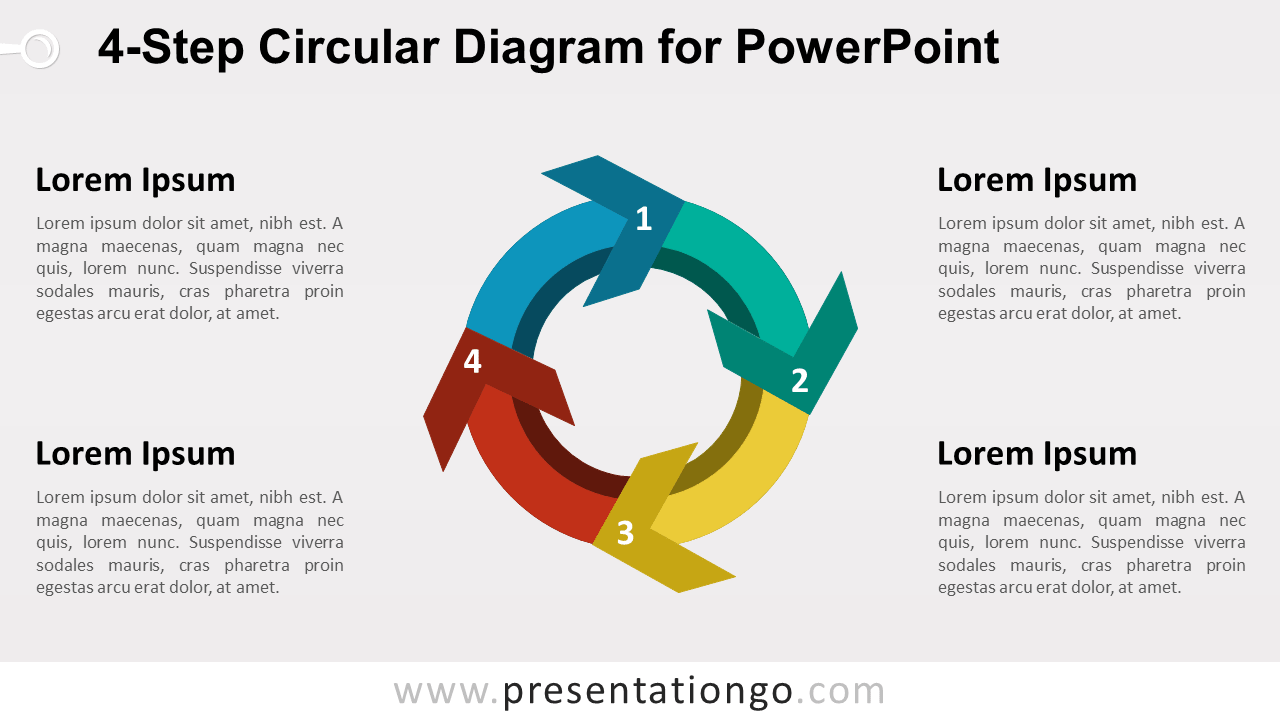
Free circular process diagram for PowerPoint with 4 steps (arrows). Illustrates a continuing sequence of stages in a circular flow.
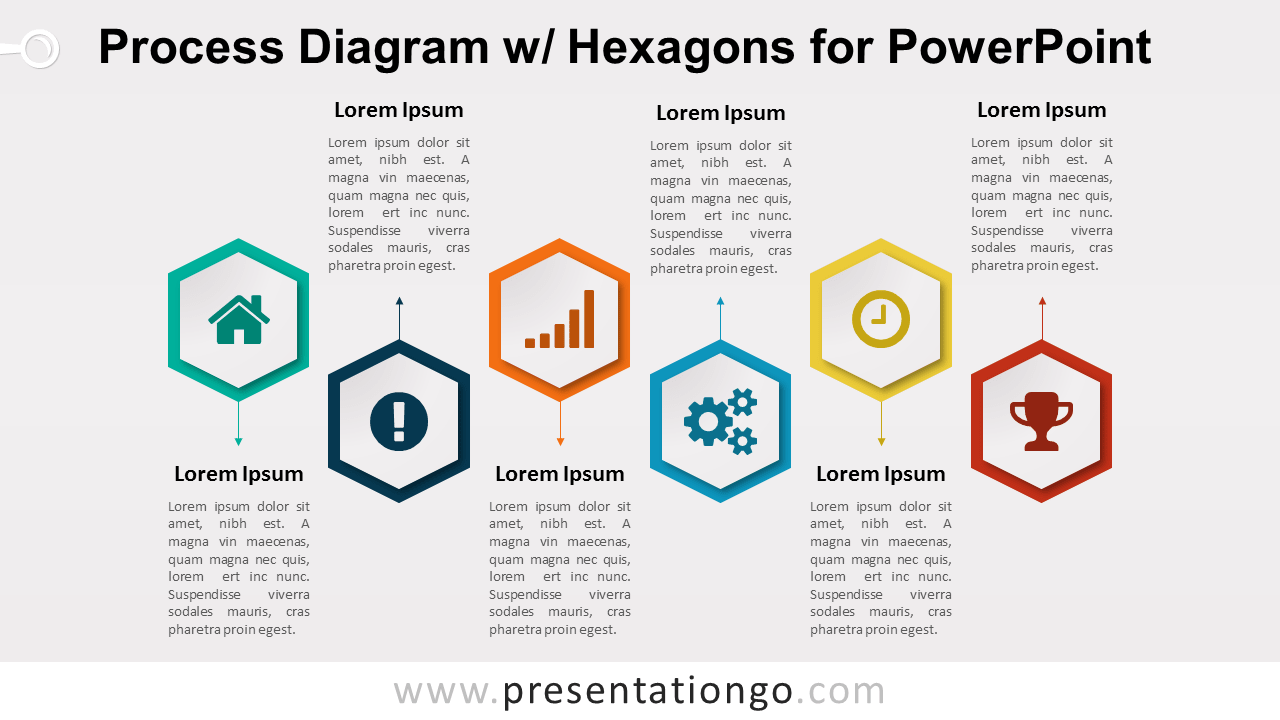
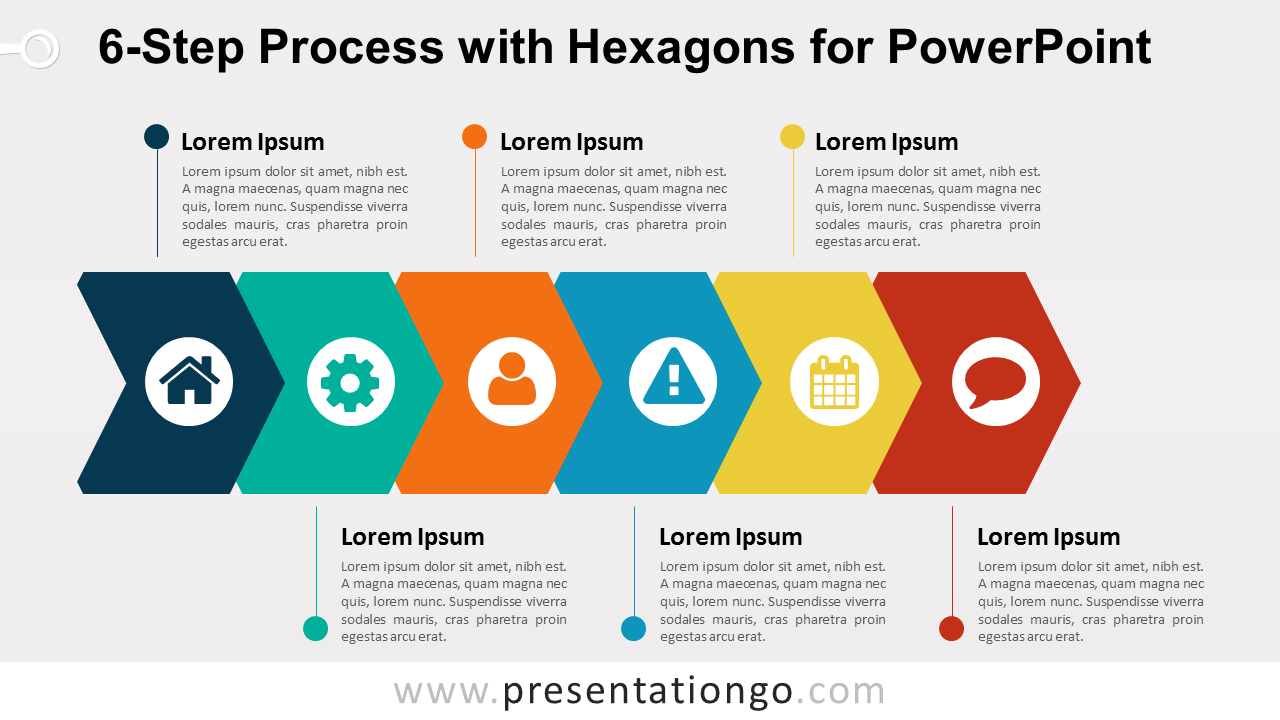
Free process diagram for PowerPoint with hexagon shapes horizontally aligned and stacked. Colored graphic design with 6 options.
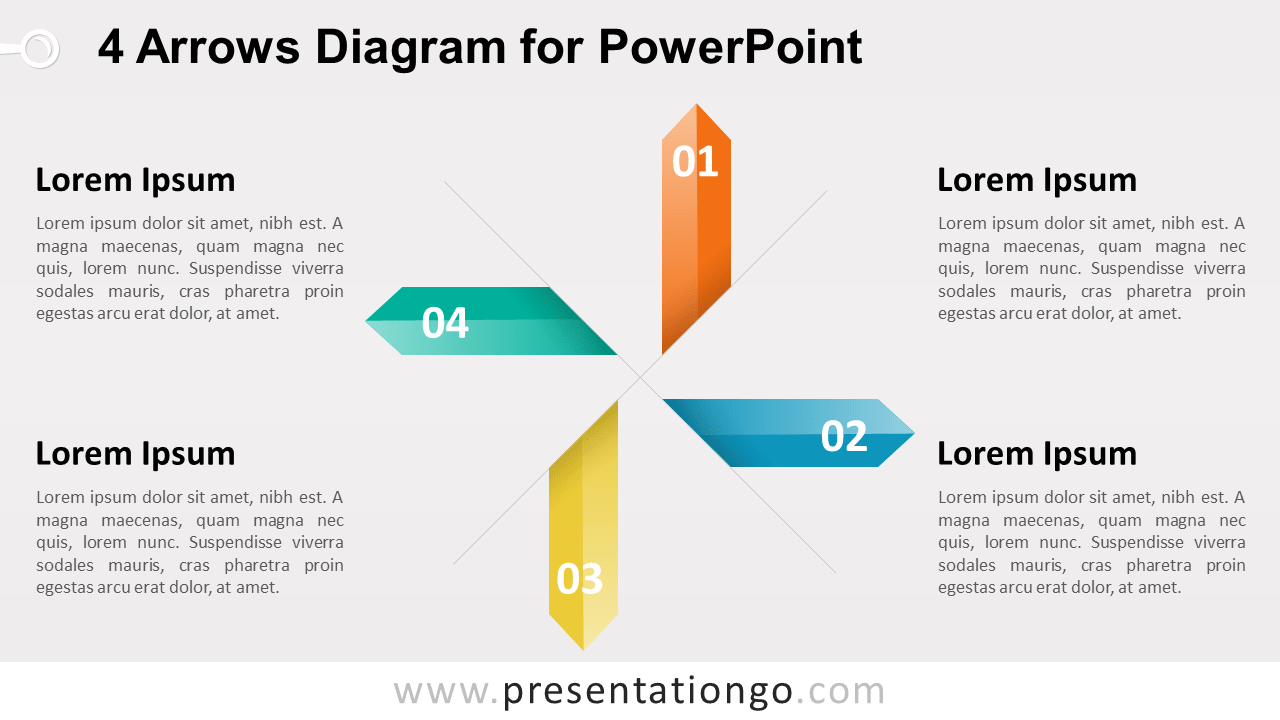
Free diagram for PowerPoint with 4 (pentagon) arrows pointing away from the center. Use this template to illustrate 4 ideas, concepts or as a matrix.
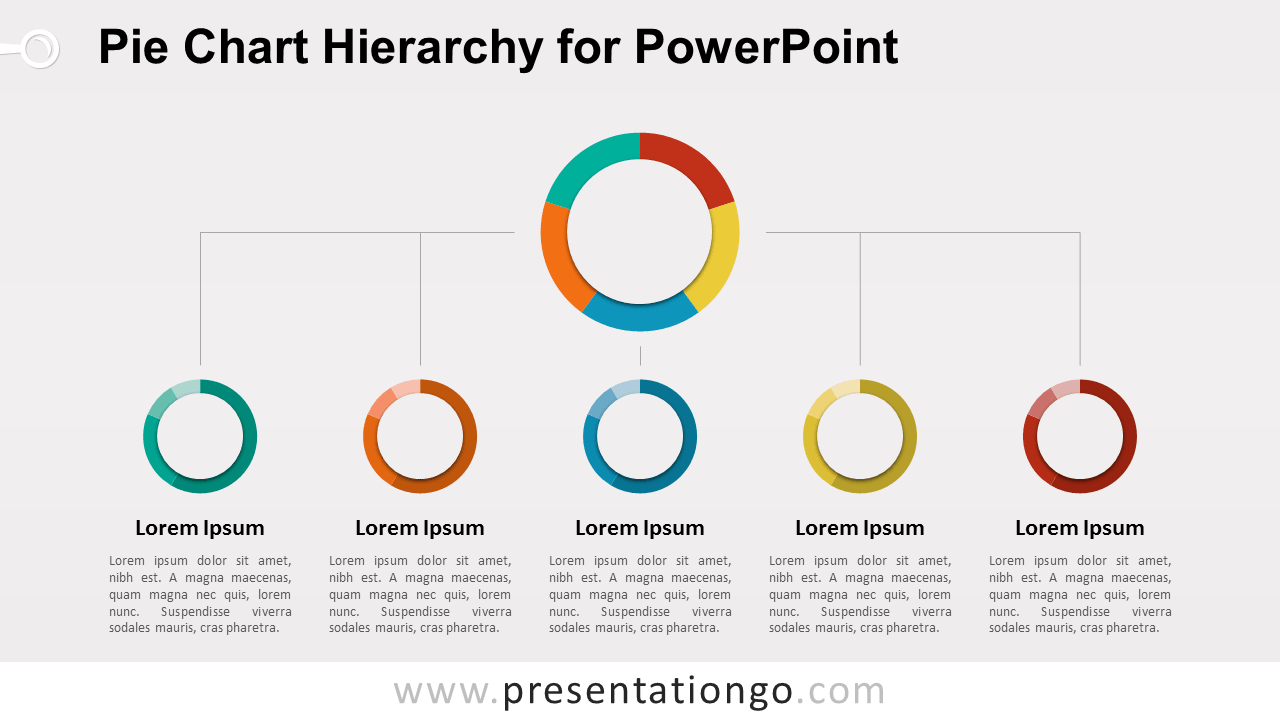
Free vertical hierarchy diagram for PowerPoint with data-driven pie-charts. Shows hierarchical relationships between various (quantitative) information.
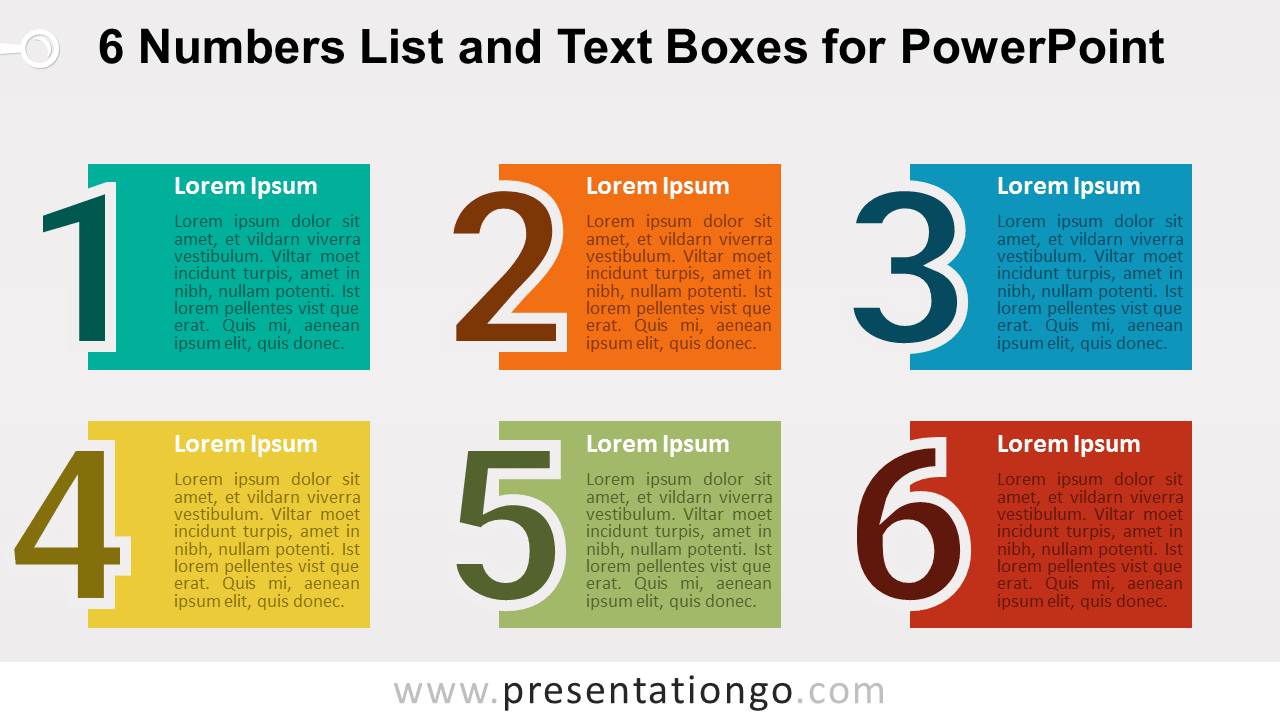
Free 6 number list template for PowerPoint. Colored graphic design with 6 numbers and text boxes. Great to replace the classic bullet point list. 2 slides.