Loading resources…
Total 3480 resources
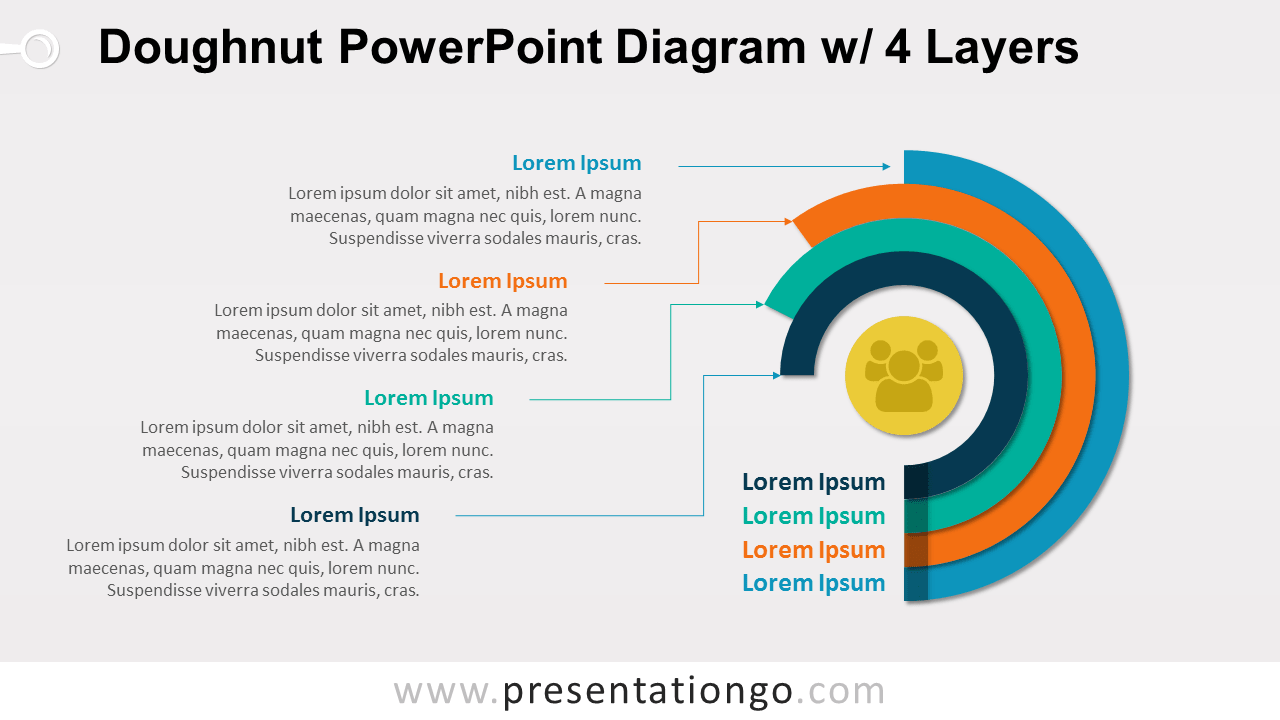
Free doughnut diagram with 4 layers for PowerPoint. Colored graphic design with 4 options. Editable graphics with text placeholder.
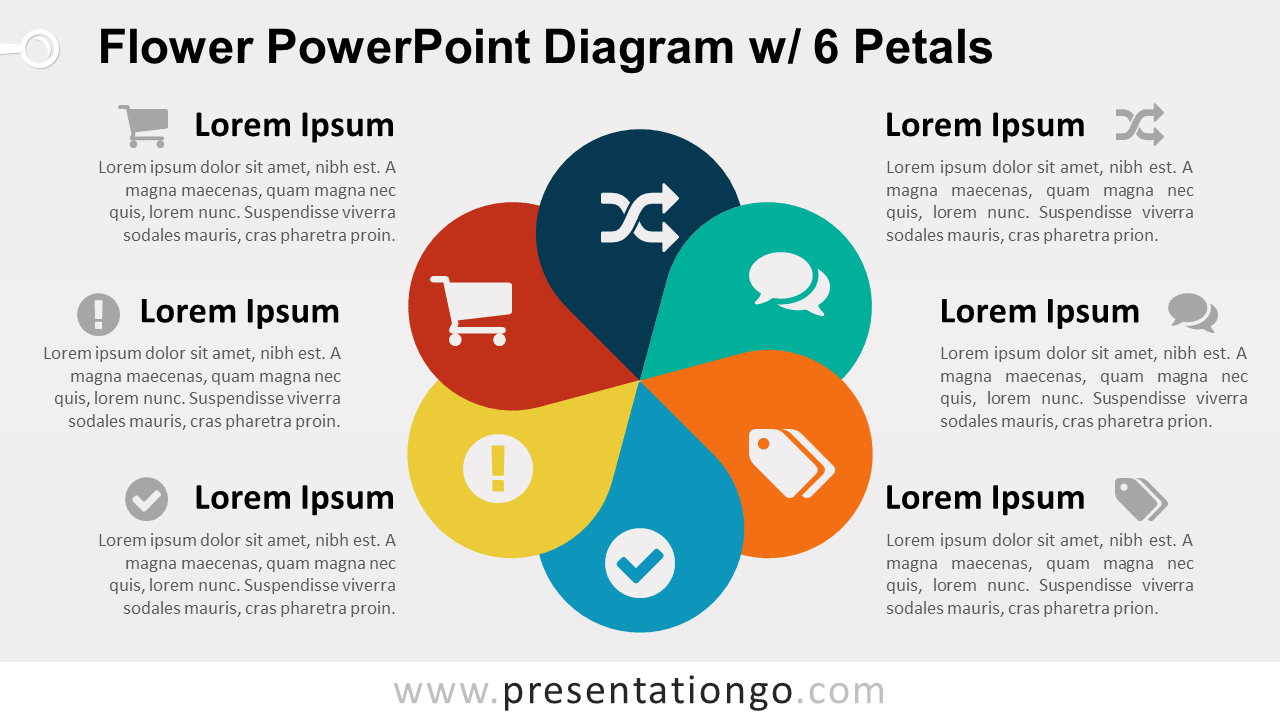
Free flower diagram with 6 petals for PowerPoint. Colored graphic design with 6 options. Editable graphics with text placeholder. Made with teardrop shapes.
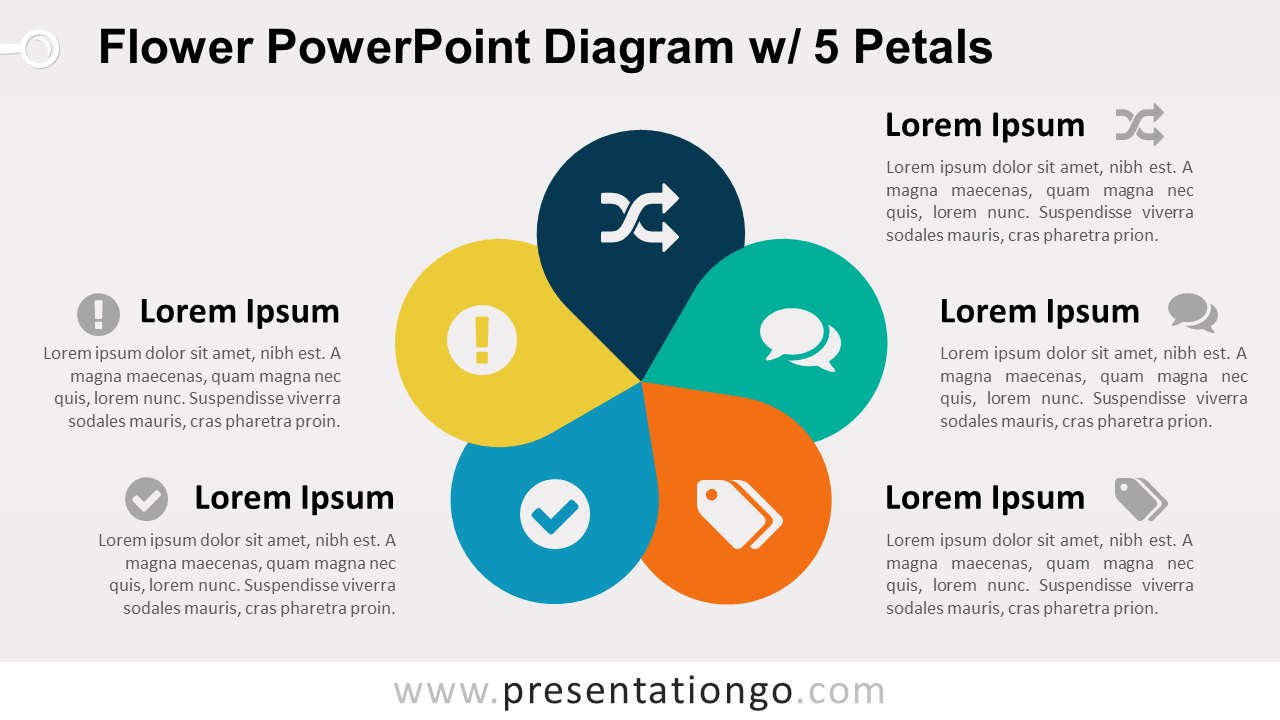
Free flower diagram with 5 petals for PowerPoint. Colored graphic design with 5 options. Editable graphics with text placeholder. Made with teardrop shapes.
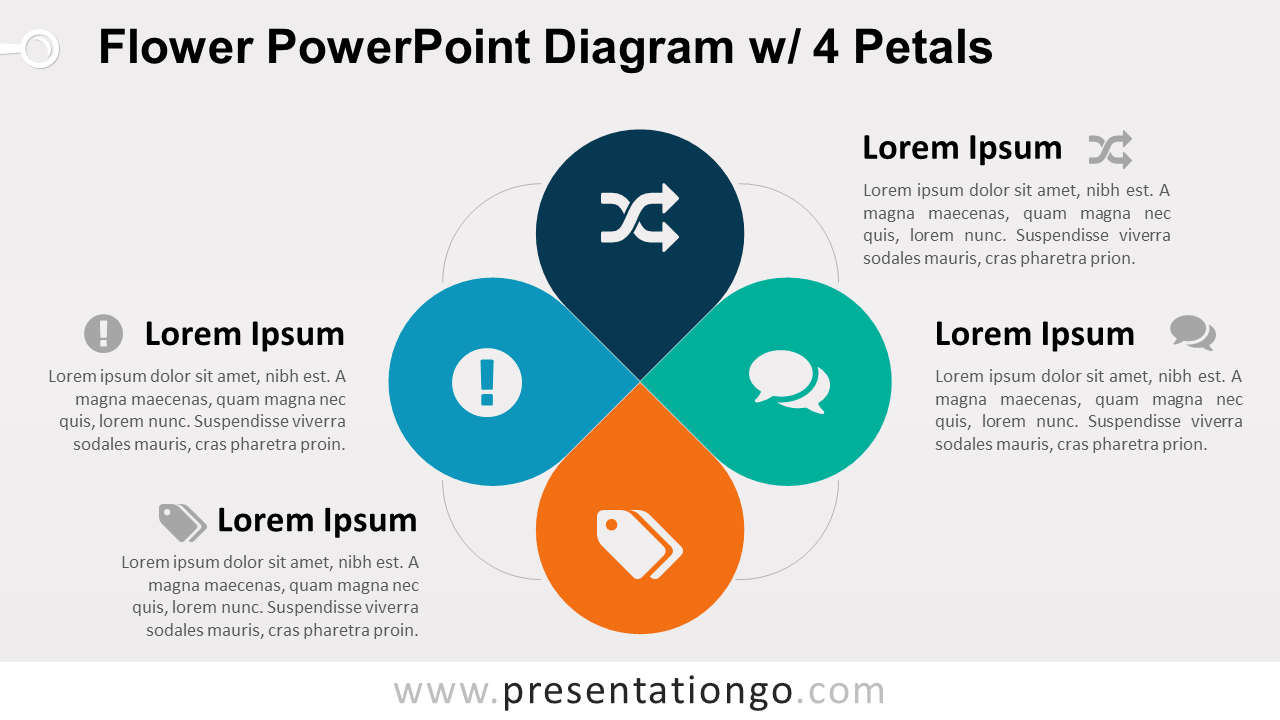
Free flower diagram with 4 petals for PowerPoint. Colored graphic design with 4 options. Editable graphics with text placeholder. Made with teardrop shapes.
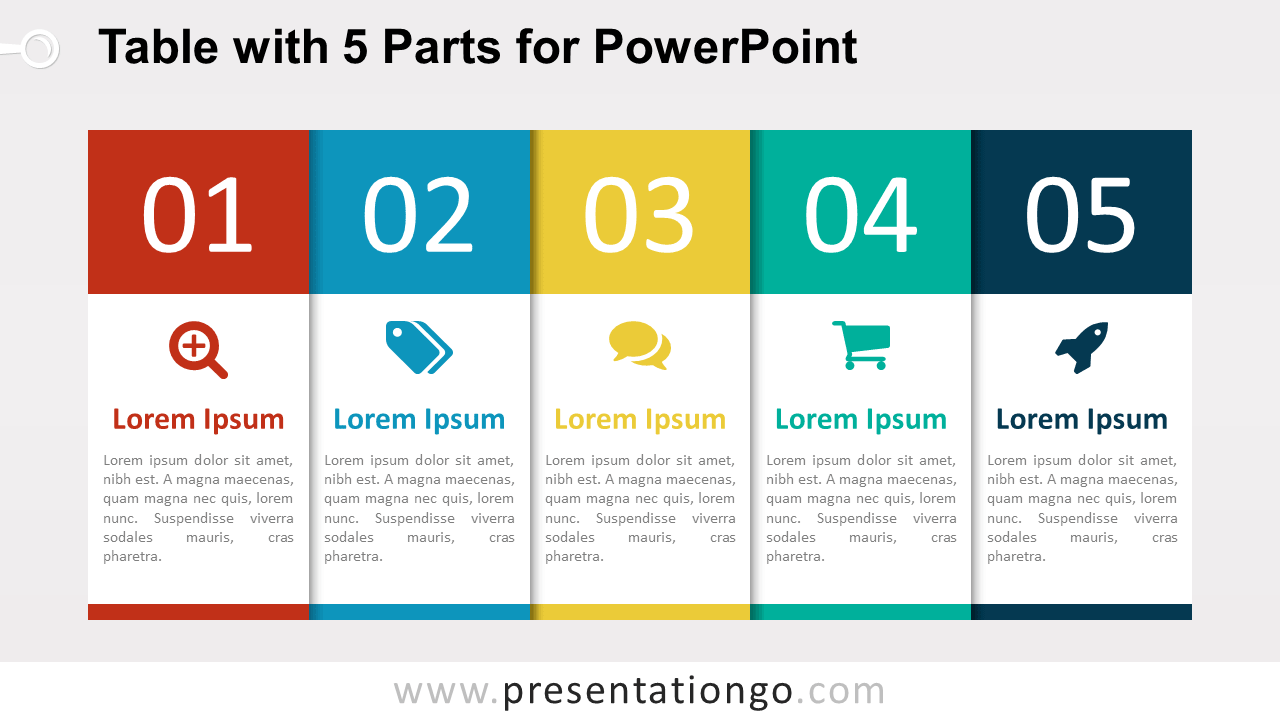
Free 5-part table diagram for PowerPoint. Editable. 5 steps, options or ideas. Also great for a 5-step timeline or for a table of contents with 5 parts.
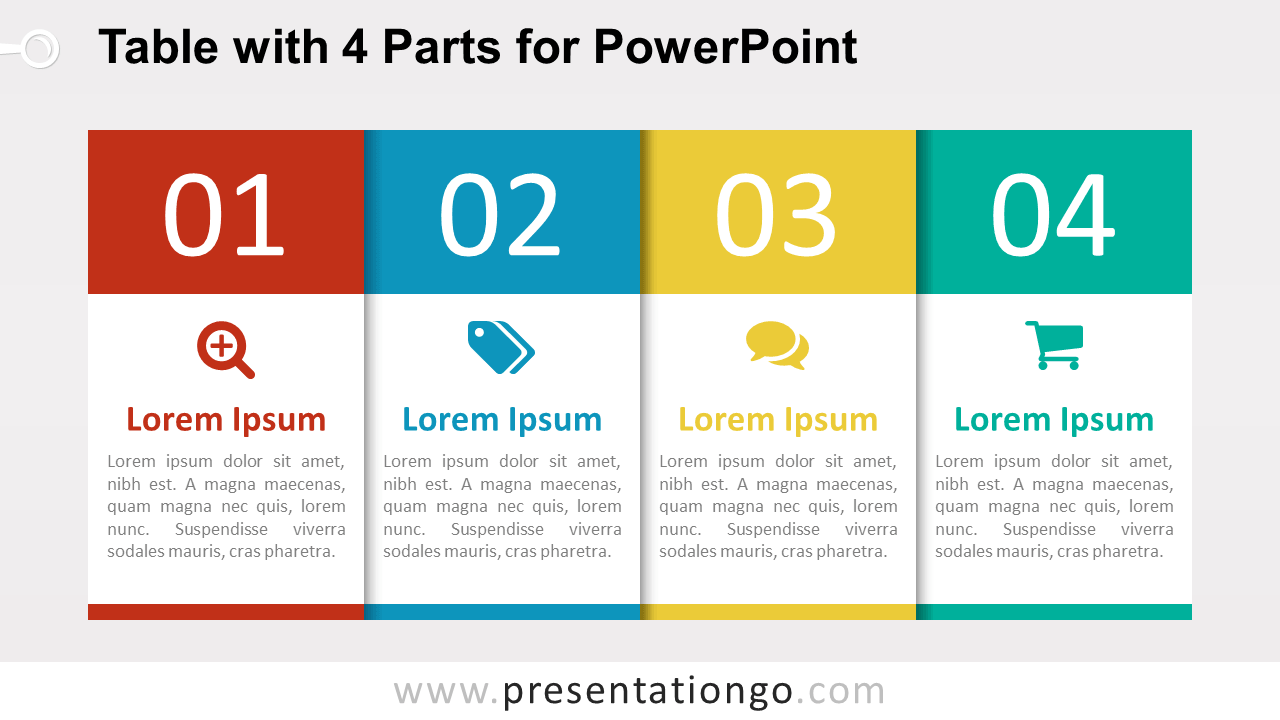
Free 4-part table diagram for PowerPoint. Editable. 4 steps, options or ideas. Also great for a 4-step timeline or for a table of contents with 4 parts.
Free 6-layer cuboid diagram for PowerPoint. 6 stacked 3D cuboid colored shapes. To illustrate 6 steps, ideas or concepts or conversions. Editable shapes.
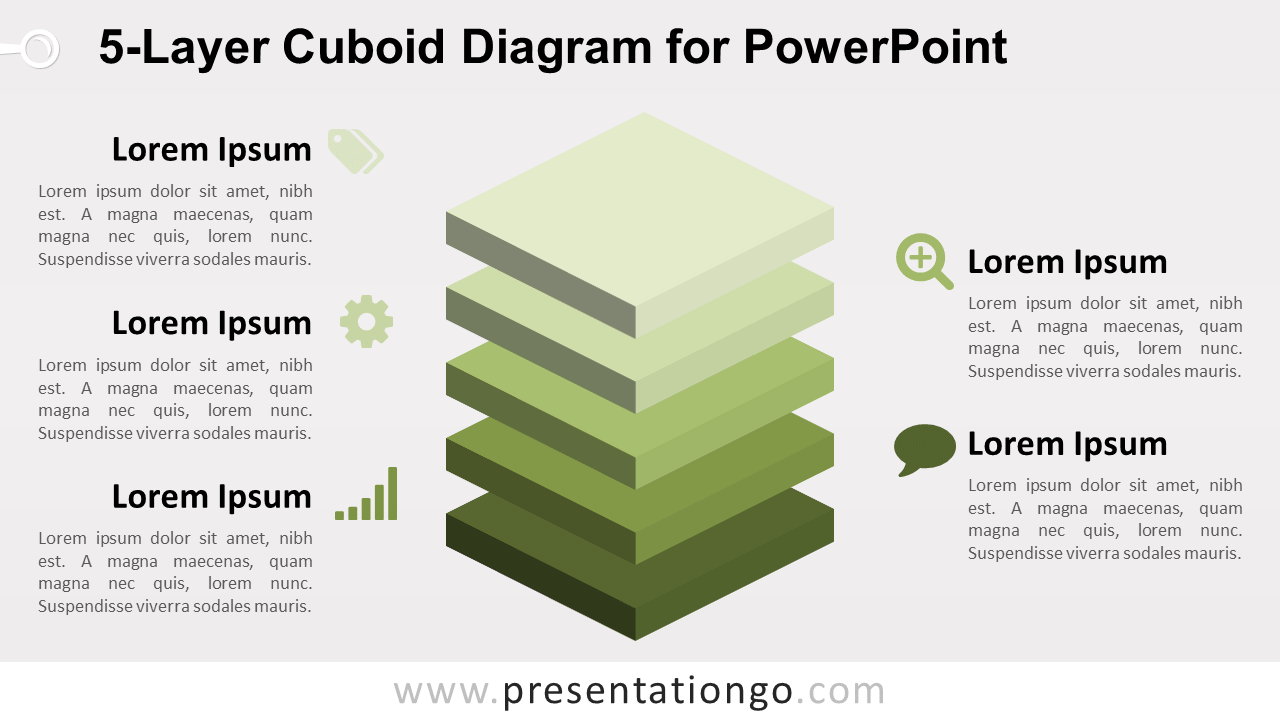
Download the 5-Layer Cuboid Diagram for PowerPoint with five editable 3D layers and text areas for hierarchies, components, priorities, or concepts.
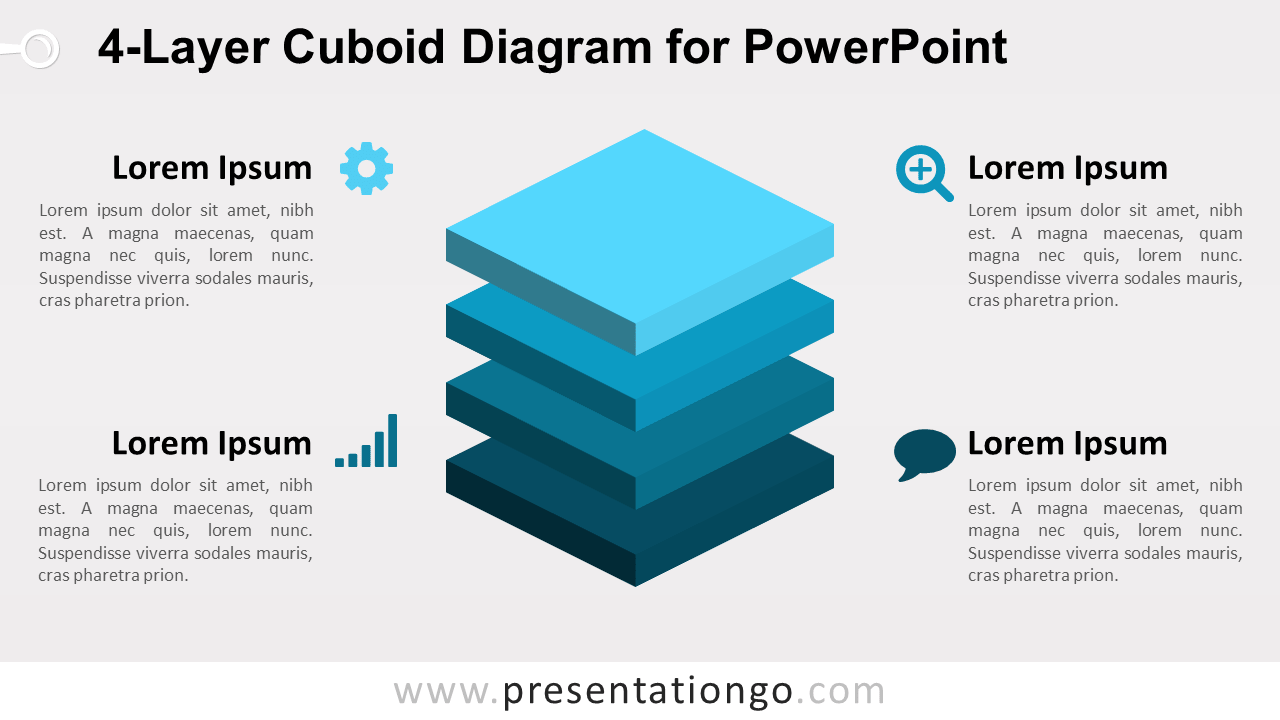
Download the 4-Layer Cuboid Diagram for PowerPoint with four editable 3D layers and text areas for levels, components, priorities, or concepts.
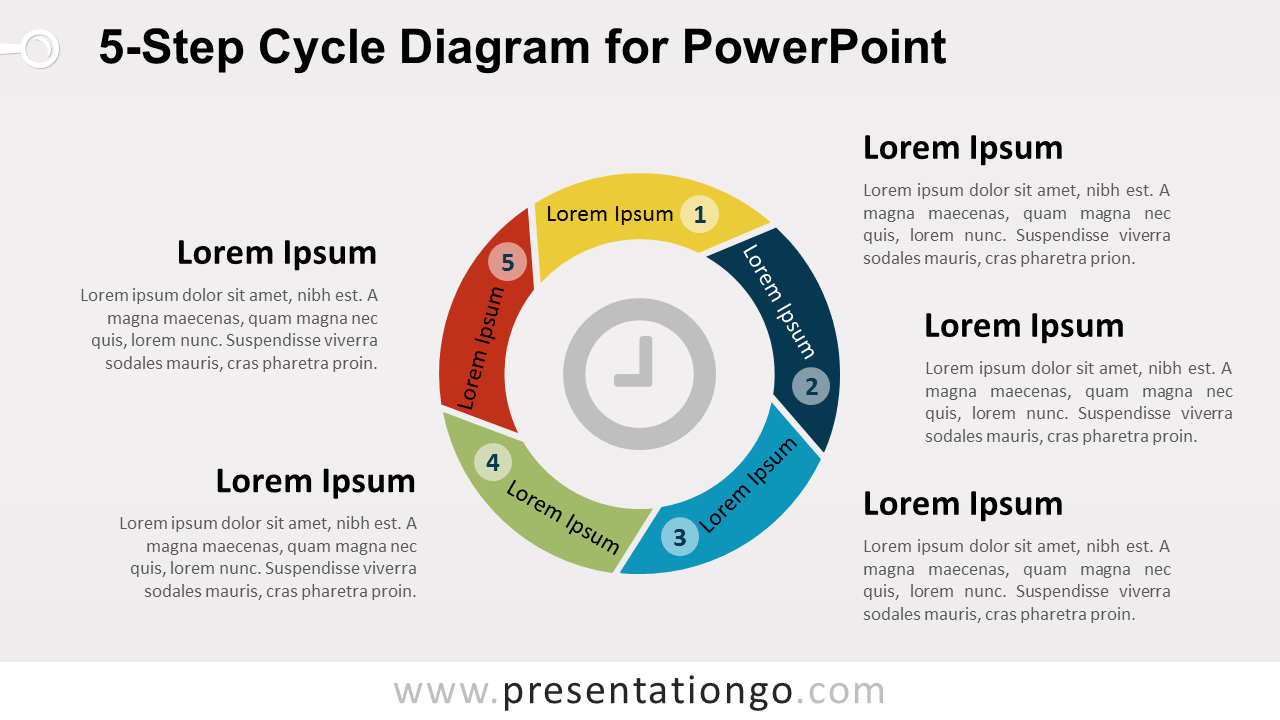
Download the 5-Step Cycle Diagram for PowerPoint with five editable stages, numbered segments, text areas, and a circular layout for recurring processes.
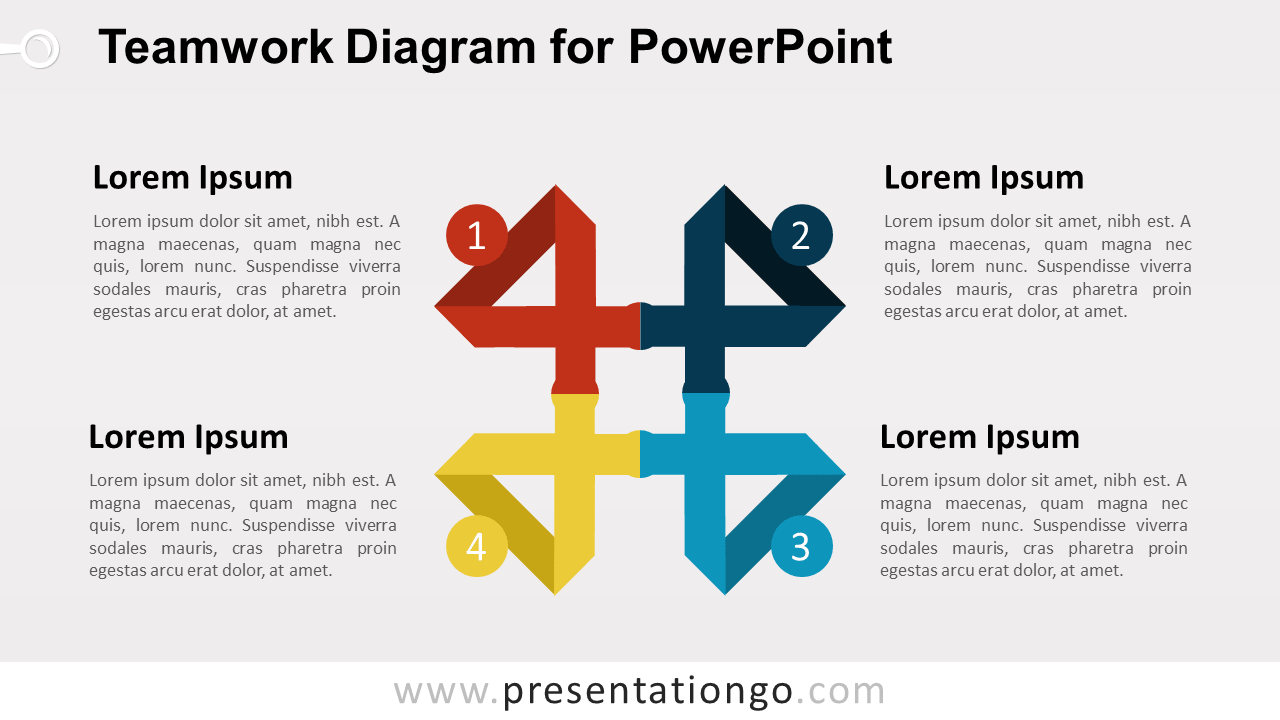
Download the Teamwork Matrix Diagram for PowerPoint with four editable interconnected sections and text areas for roles, teams, tasks, or priorities.
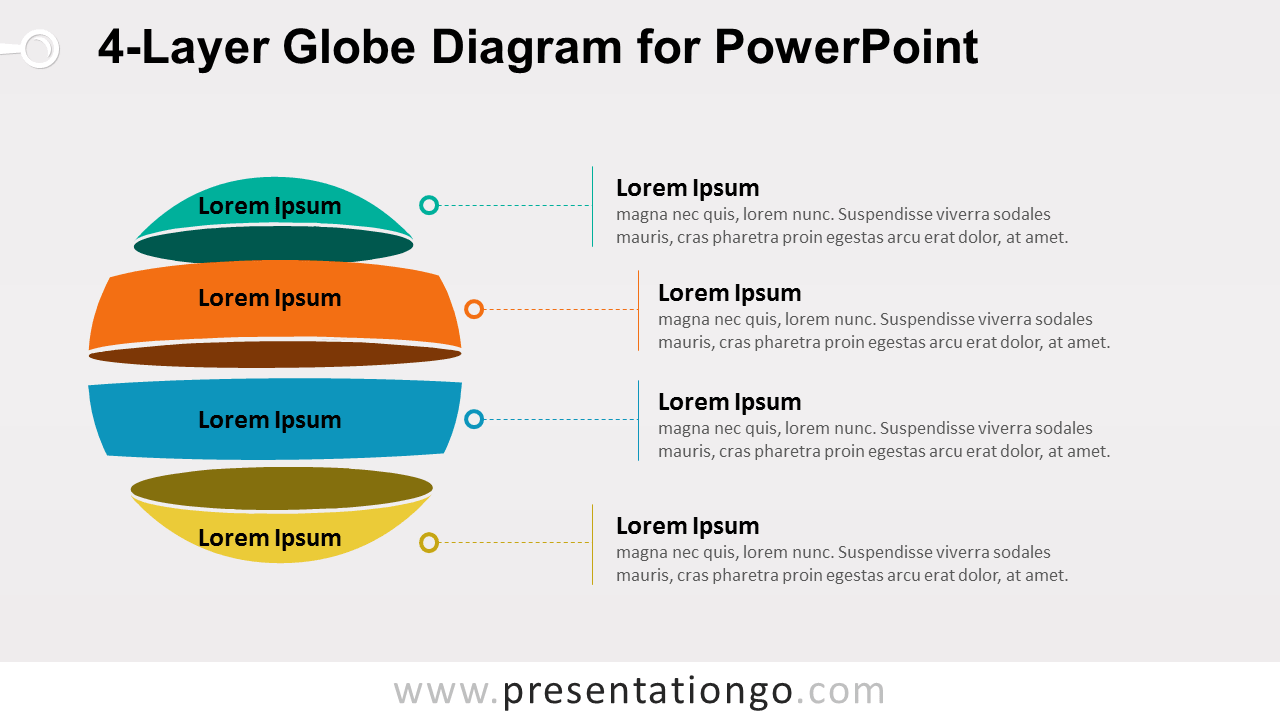
Download the 4-Layer Globe Diagram for PowerPoint with four editable sections, connected text areas, and a layered spherical structure for key concepts.
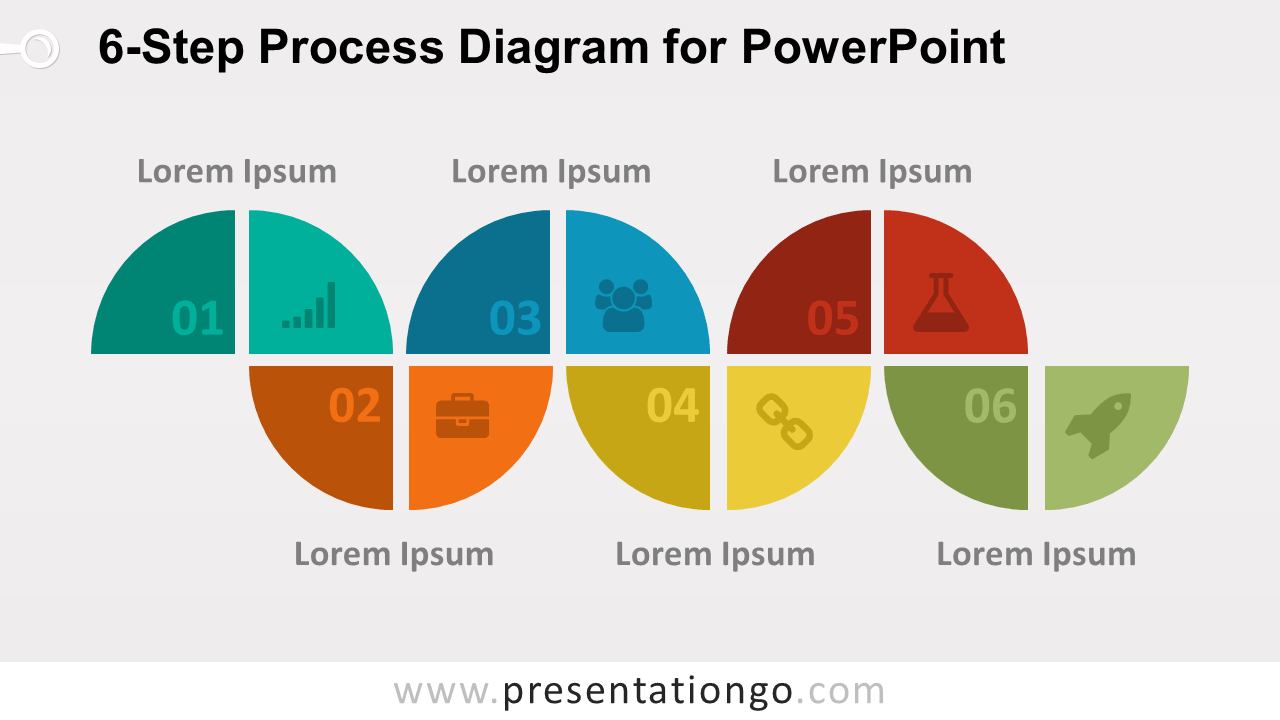
Download the 6-Step Process Diagram for PowerPoint with six editable stages, numbered sections, icon placeholders, and text areas for workflows.
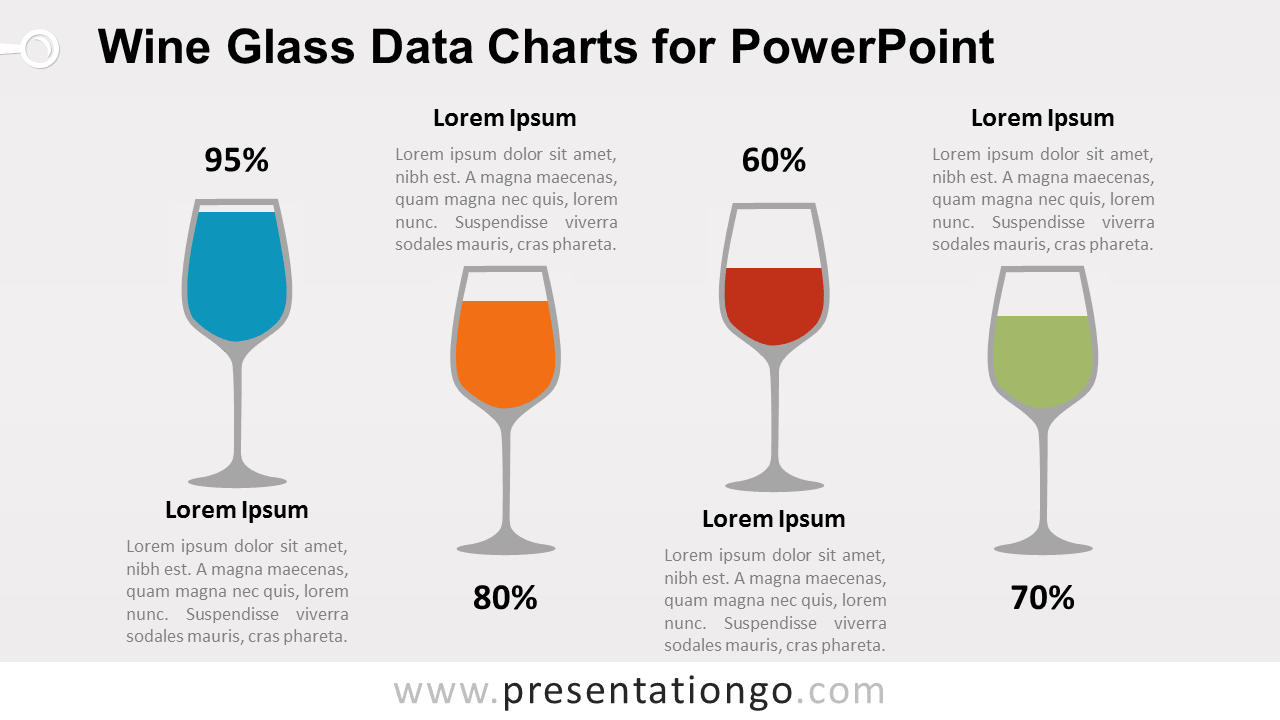
Download Wine Glass Charts for PowerPoint with editable data-driven charts, 2 slides, and wine glass visuals for percentage comparison presentations.
Free chemical tube test charts for PowerPoint. 2 tube tests with on a stand. Data-driven charts. Great for healthcare, science, business PPTX presentations.
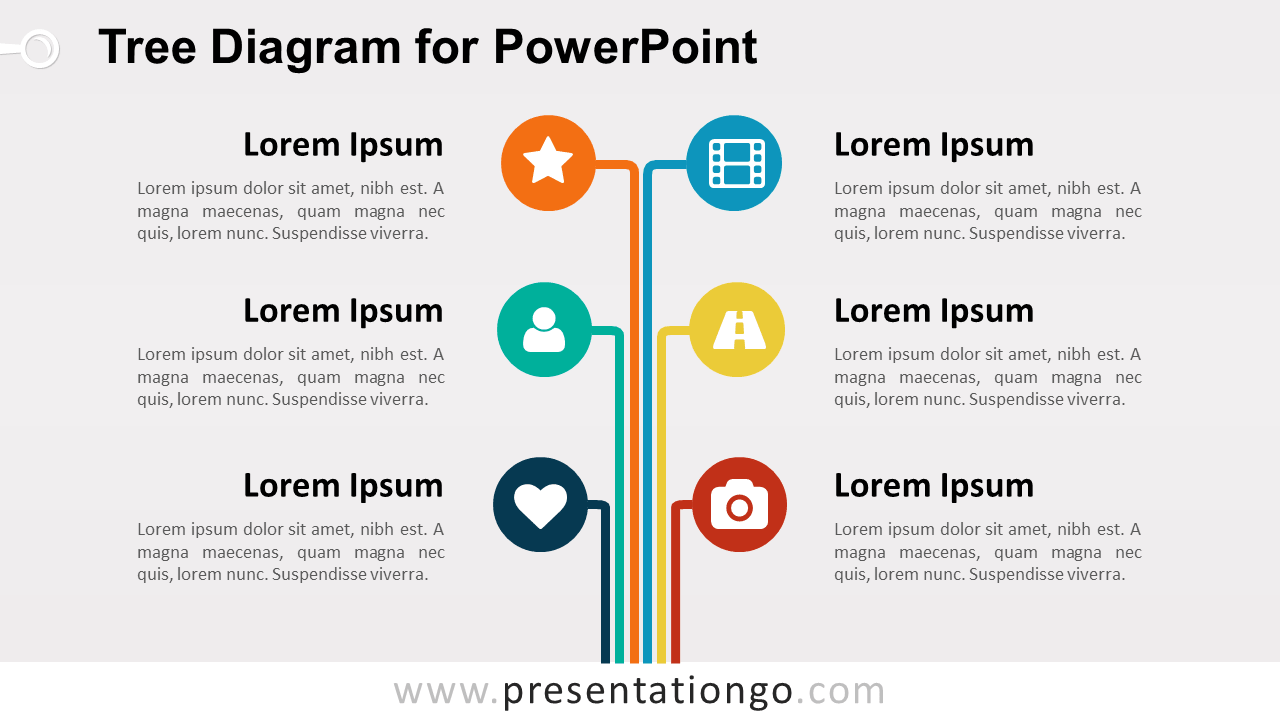
Download the Tree Diagram for PowerPoint with six editable branches, icon placeholders, and text areas for categories, roles, topics, and key concepts.
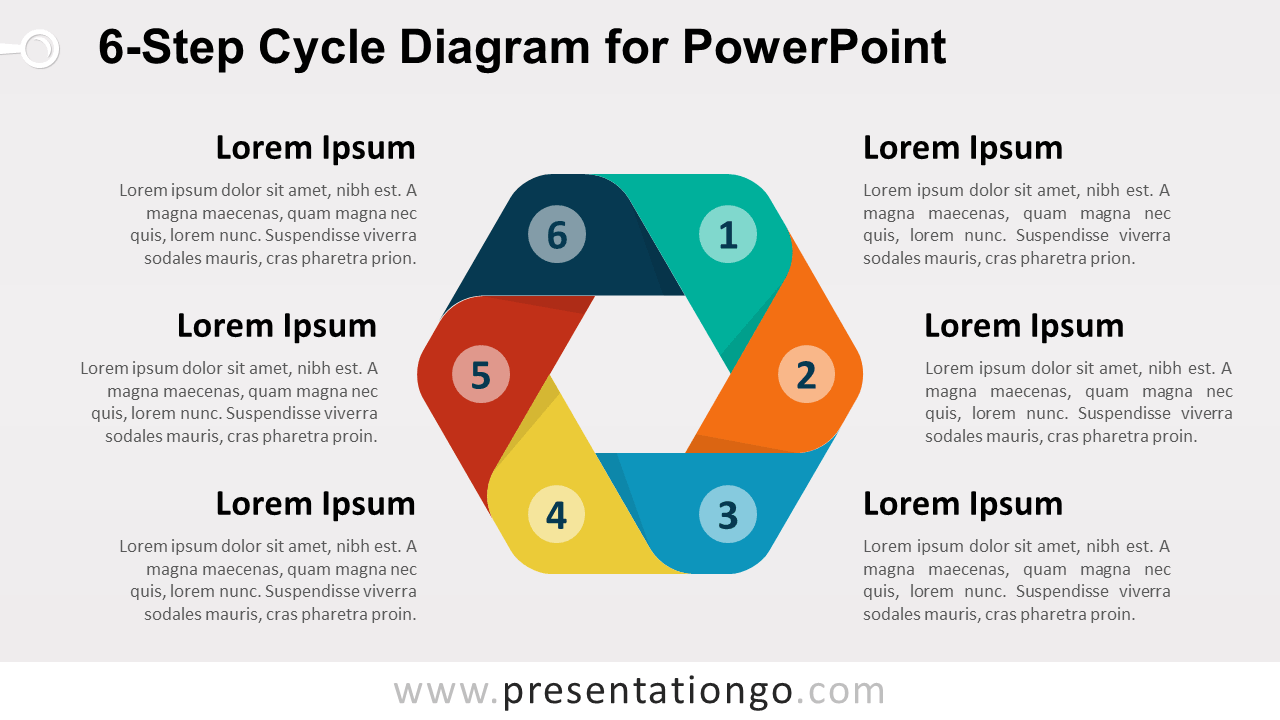
Download the 6-Step Cycle Diagram for PowerPoint with six editable stages for workflows, recurring processes, strategic cycles, and continuous improvement.
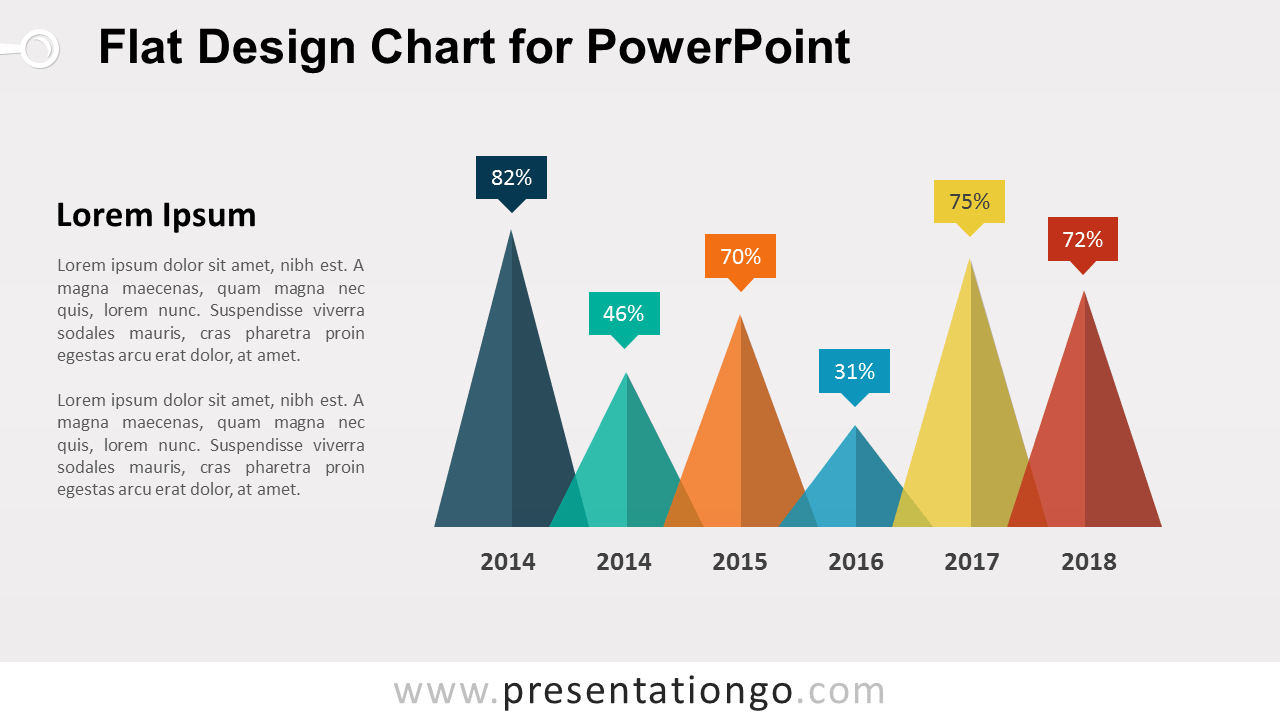
Download the Flat Design Triangle Chart for PowerPoint with six editable triangular data points for percentages, KPIs, trends, and performance comparisons.
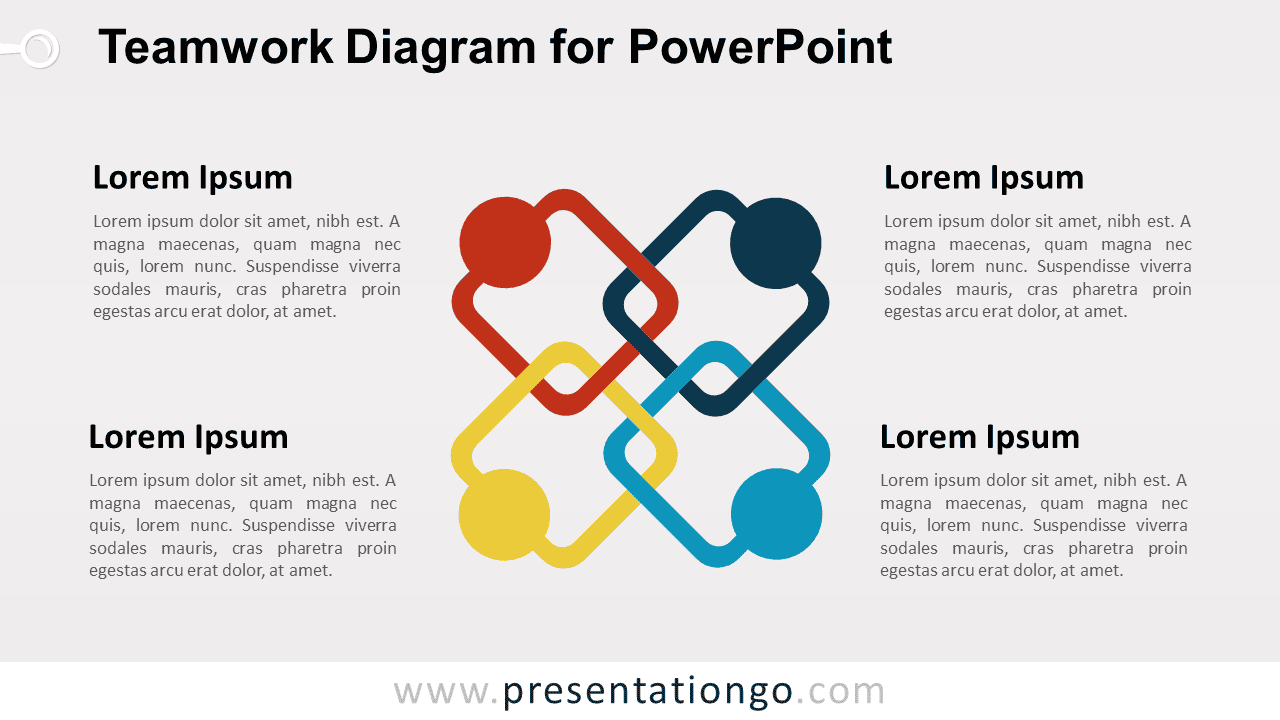
Download the Teamwork Diagram for PowerPoint with four editable connected figures for team roles, collaboration, partnerships, and shared responsibilities.
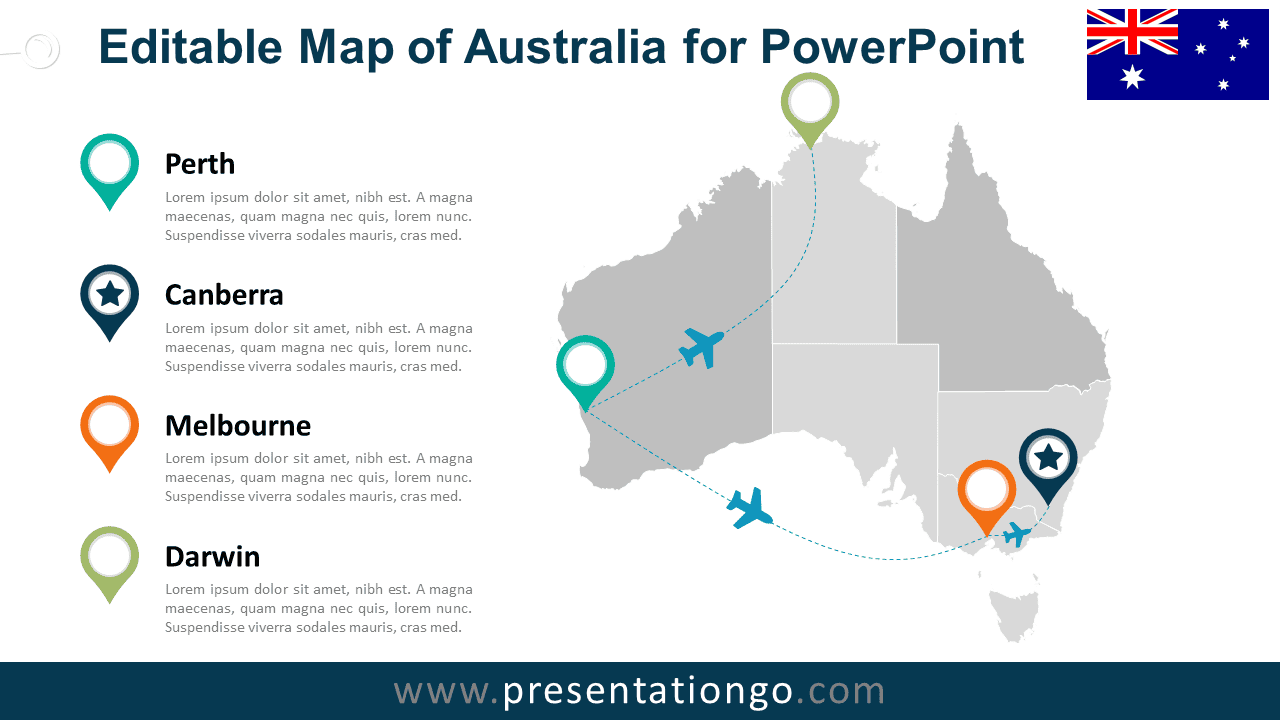
Download the Editable Australia Map Diagram for PowerPoint with state outlines, city markers, travel routes, text areas, and editable placeholders.
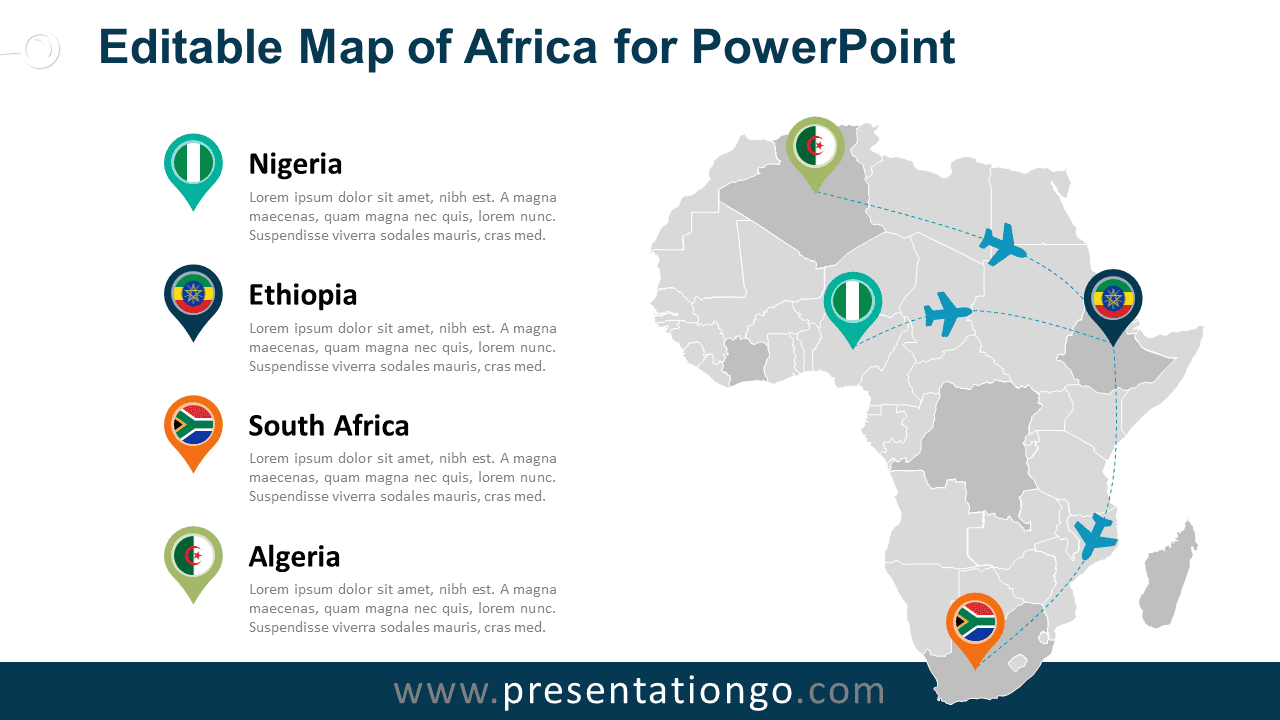
Download the Editable Africa Map Diagram for PowerPoint with country outlines, location markers, travel routes, text areas, and editable placeholders.
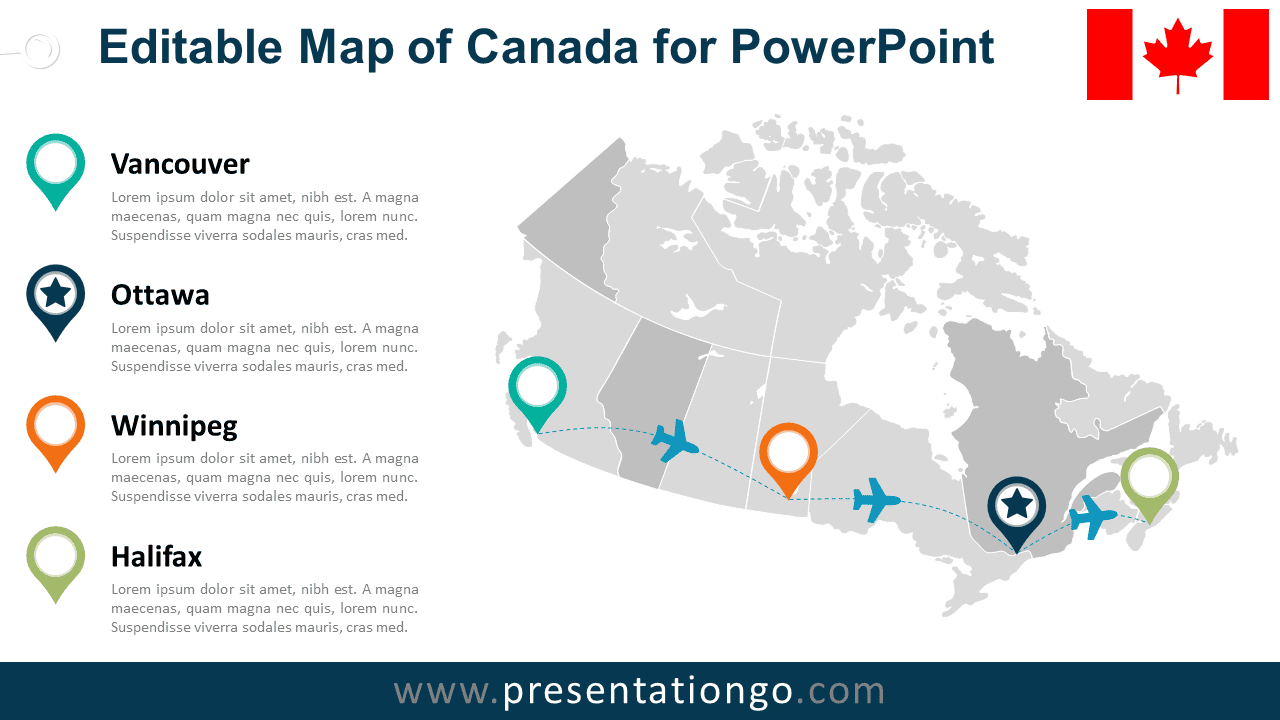
Download the Editable Canada Map Diagram for PowerPoint with province outlines, location markers, travel routes, text areas, and editable placeholders.
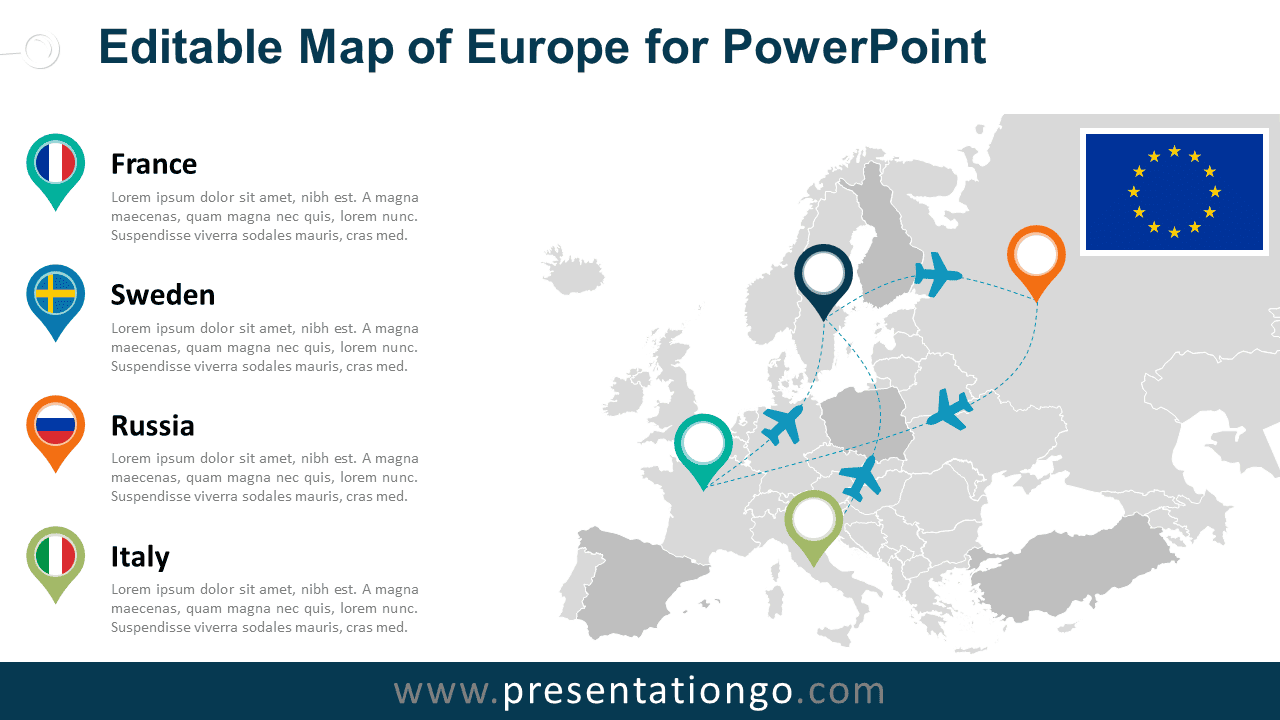
Download the Editable Europe Map Diagram for PowerPoint with country outlines, location markers, routes, text areas, and editable icon placeholders.
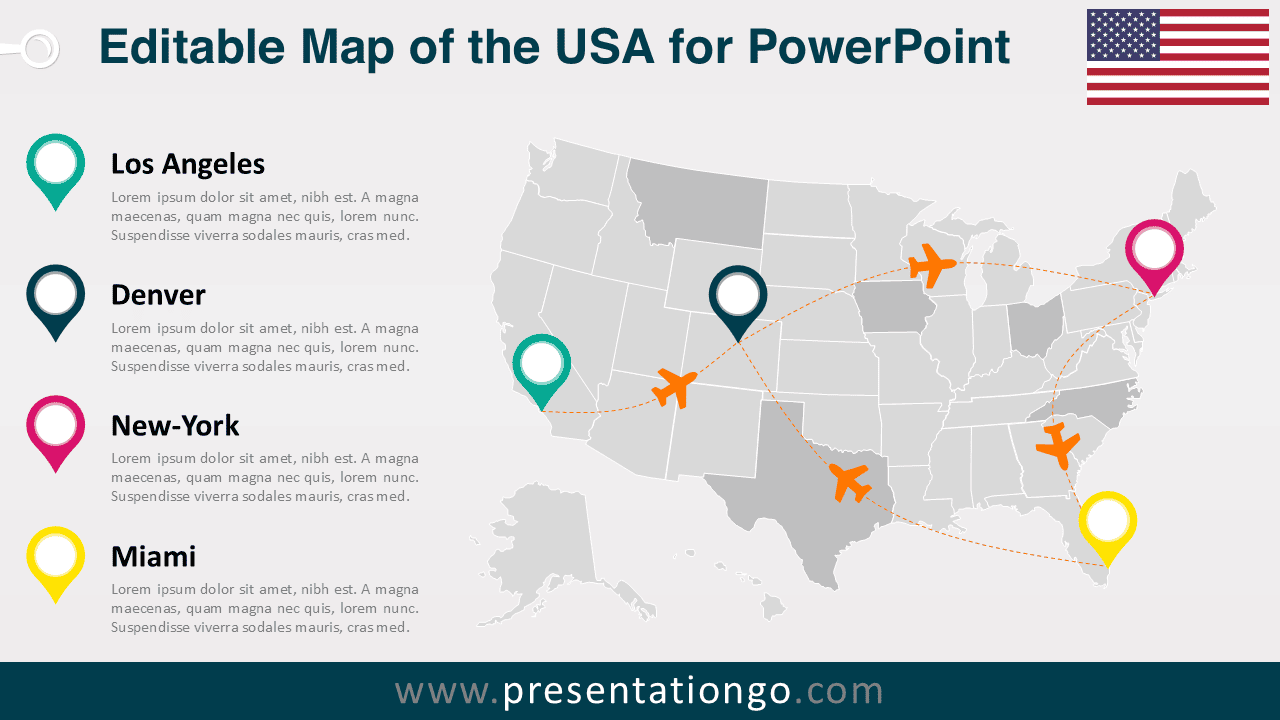
Download the Editable USA Map Diagram for PowerPoint with state outlines, location markers, routes, text areas, and editable icon placeholders.