Loading resources…
Total 8114 resources
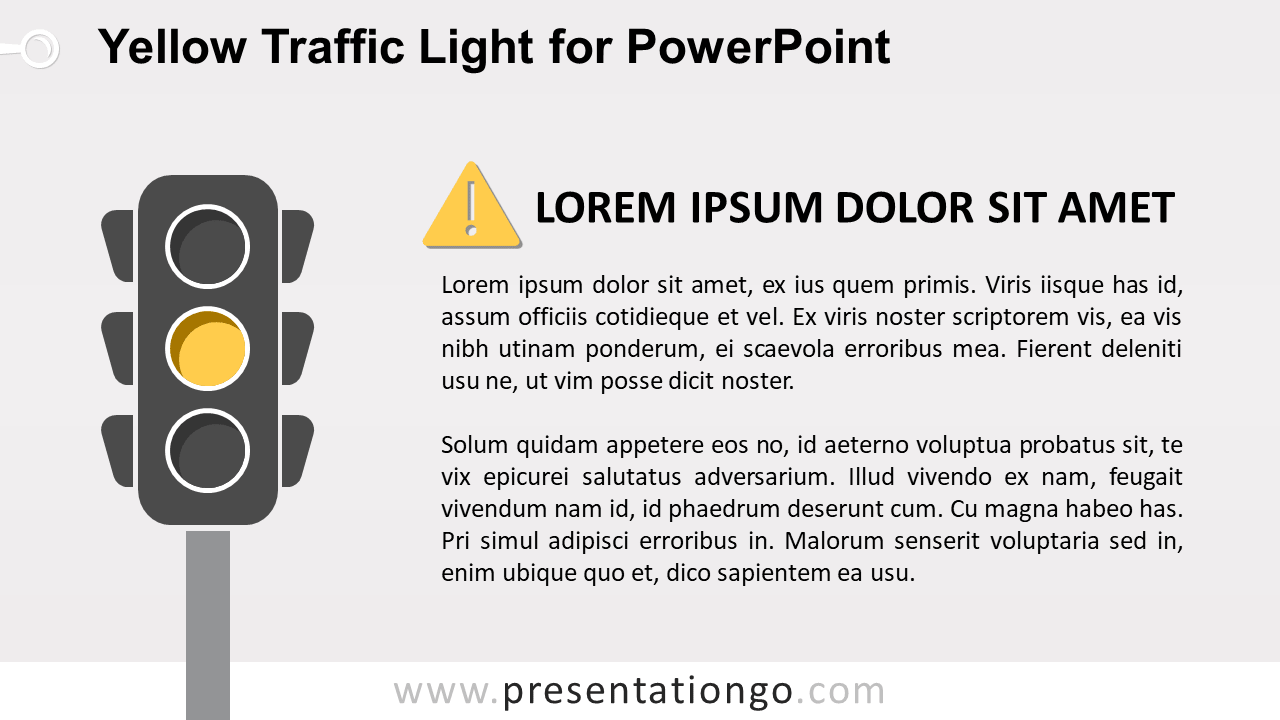
Free yellow signal traffic light for PowerPoint. Design illustration of an editable vertical traffic signal, or stop light with the yellow light on.
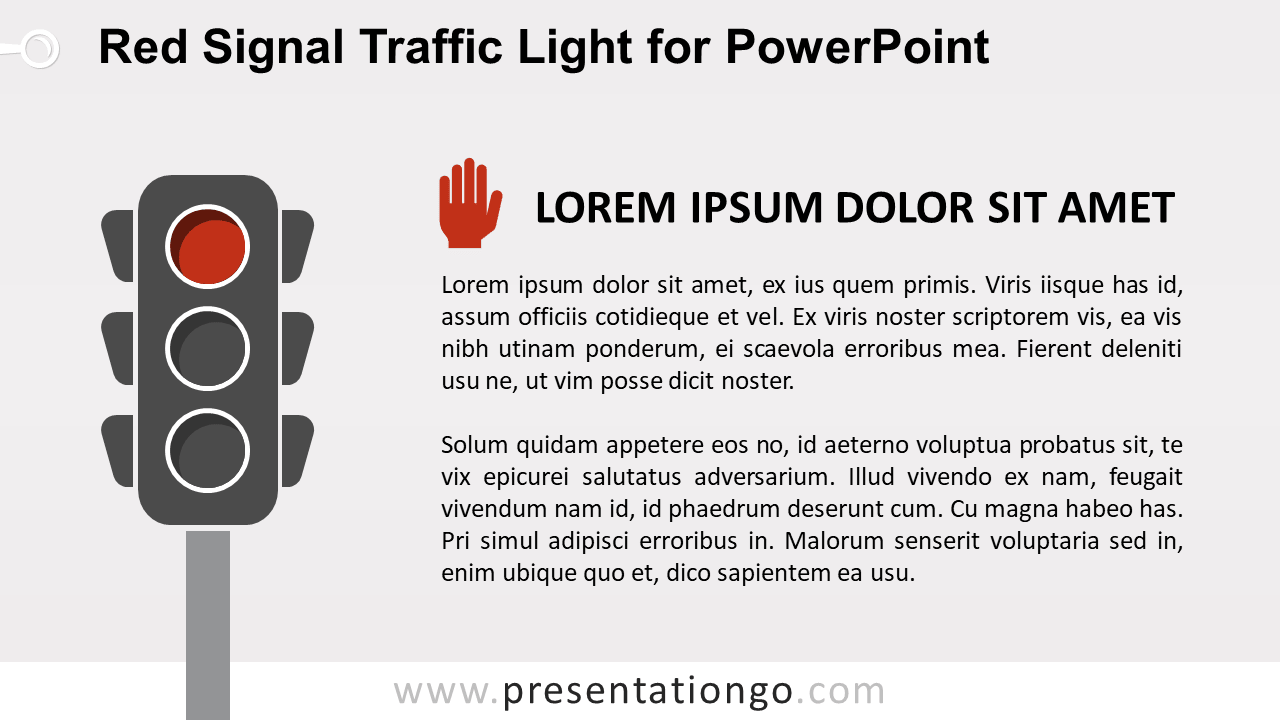
Free red signal traffic light for PowerPoint. Design illustration of an editable vertical traffic signal, or stop light with the red light on.
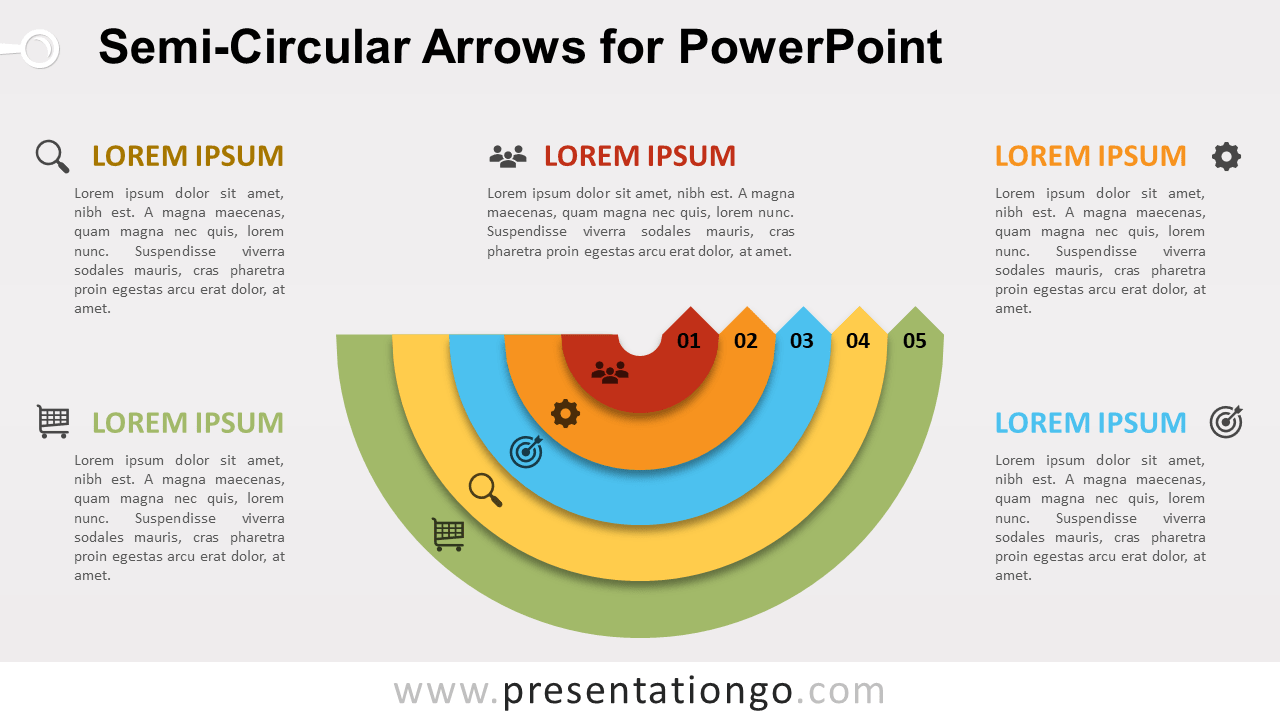
Free semi-circular arrows for PowerPoint. Diagram made with 5 layers of half circular arrows up. Editable graphics with text and icon placeholders.
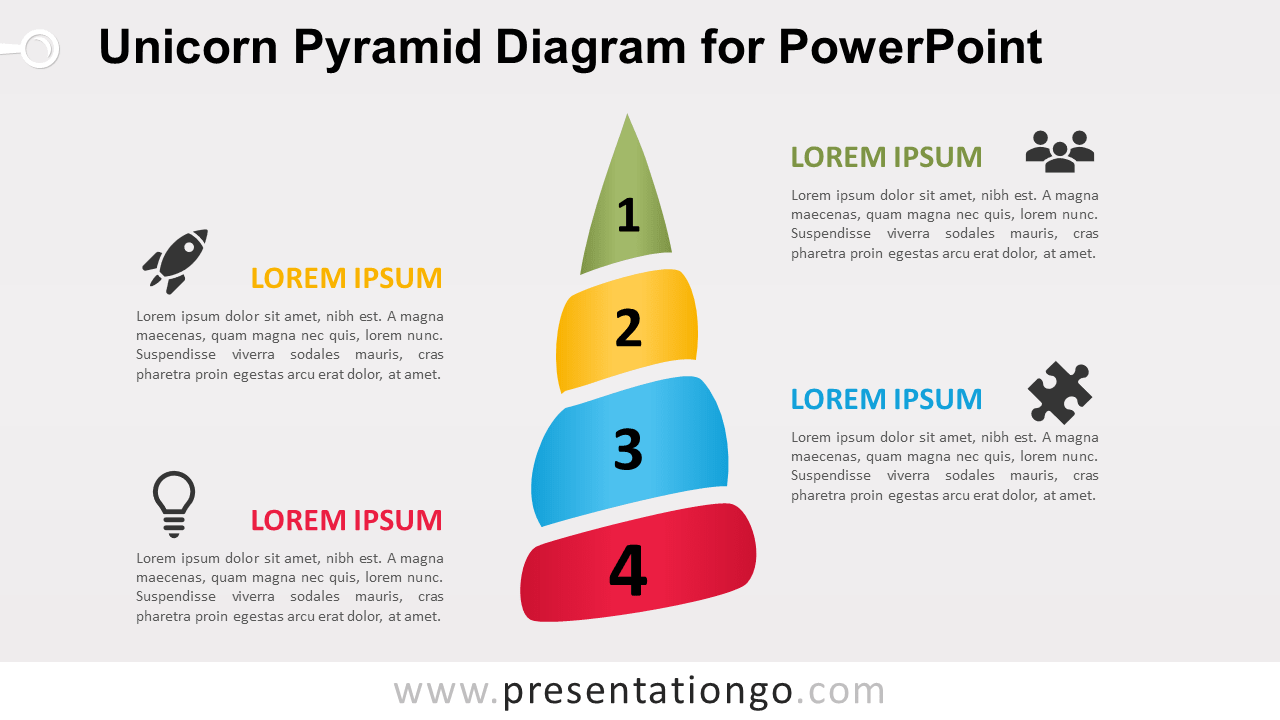
Free unicorn pyramid for PowerPoint. Colorful design illustration of the legendary horse's spiraling horn. Editable and, creative yet simple design.
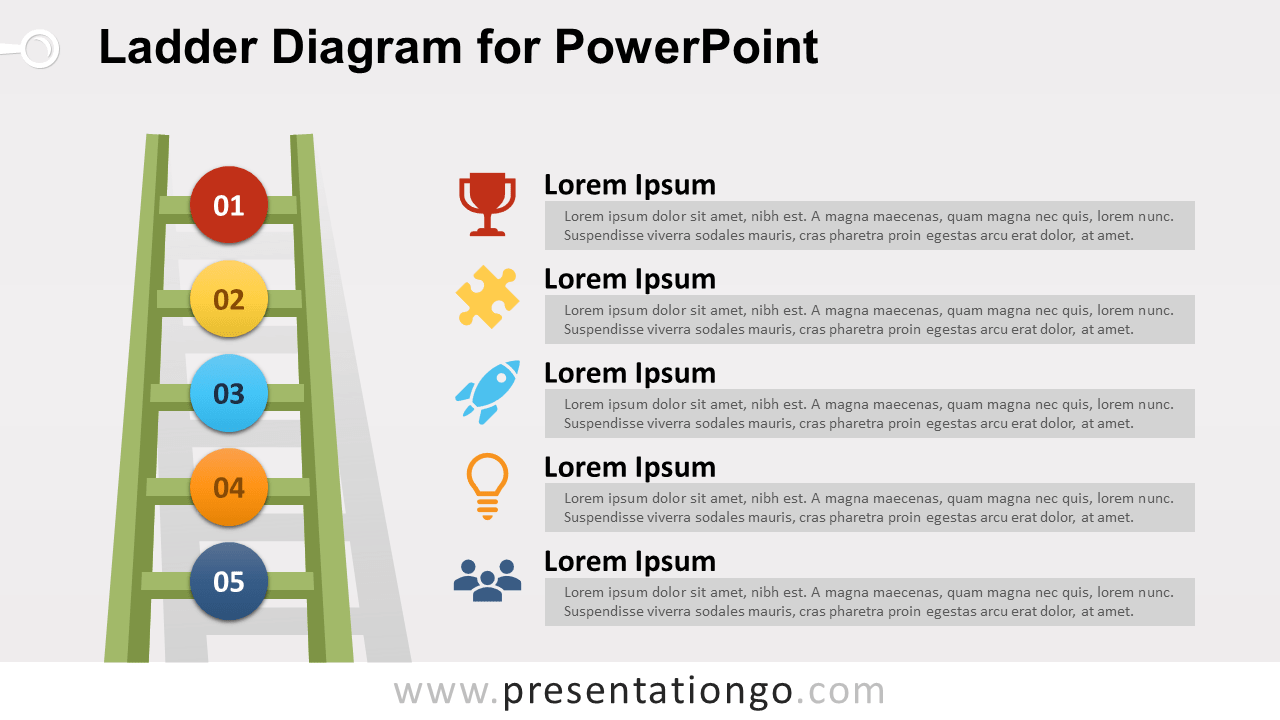
Free ladder diagram for PowerPoint. Design illustration of a green ladder with 5 steps. Editable graphics with numbers, text and icon placeholders.
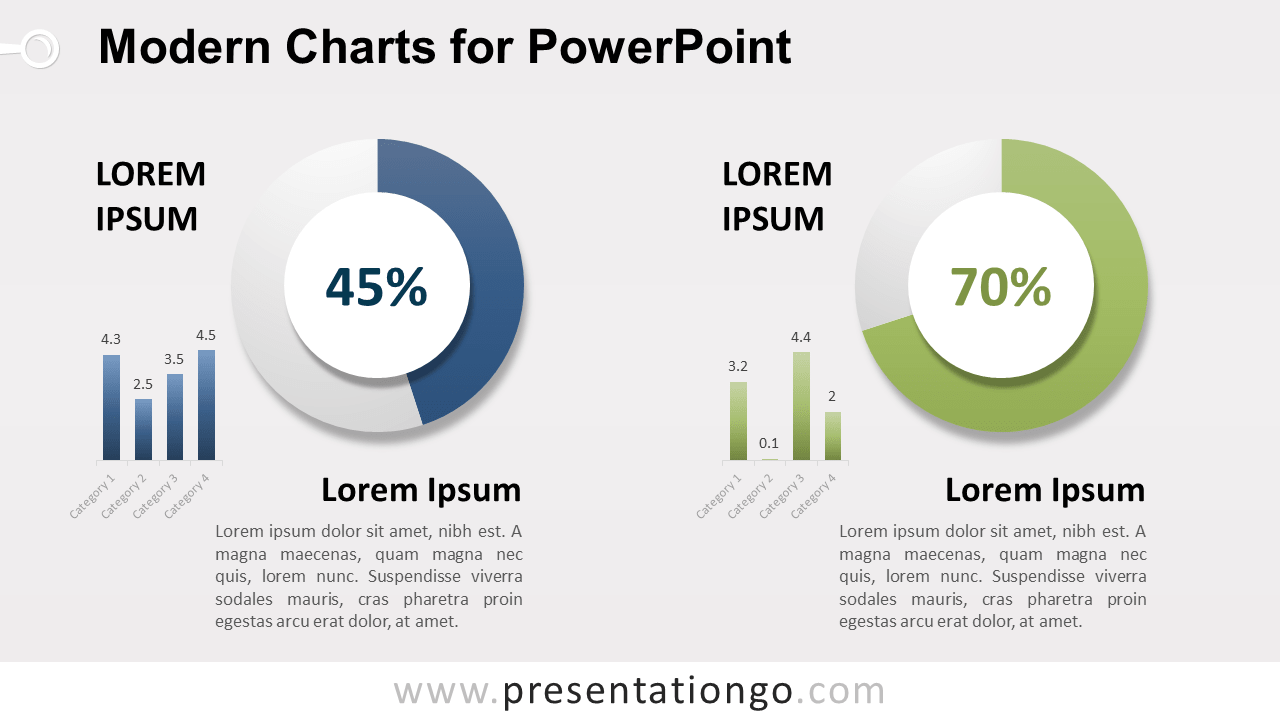
Free modern charts for PowerPoint. Template slide with 2 sets of data-driven pie and column charts. Editable graphics with text placeholder.
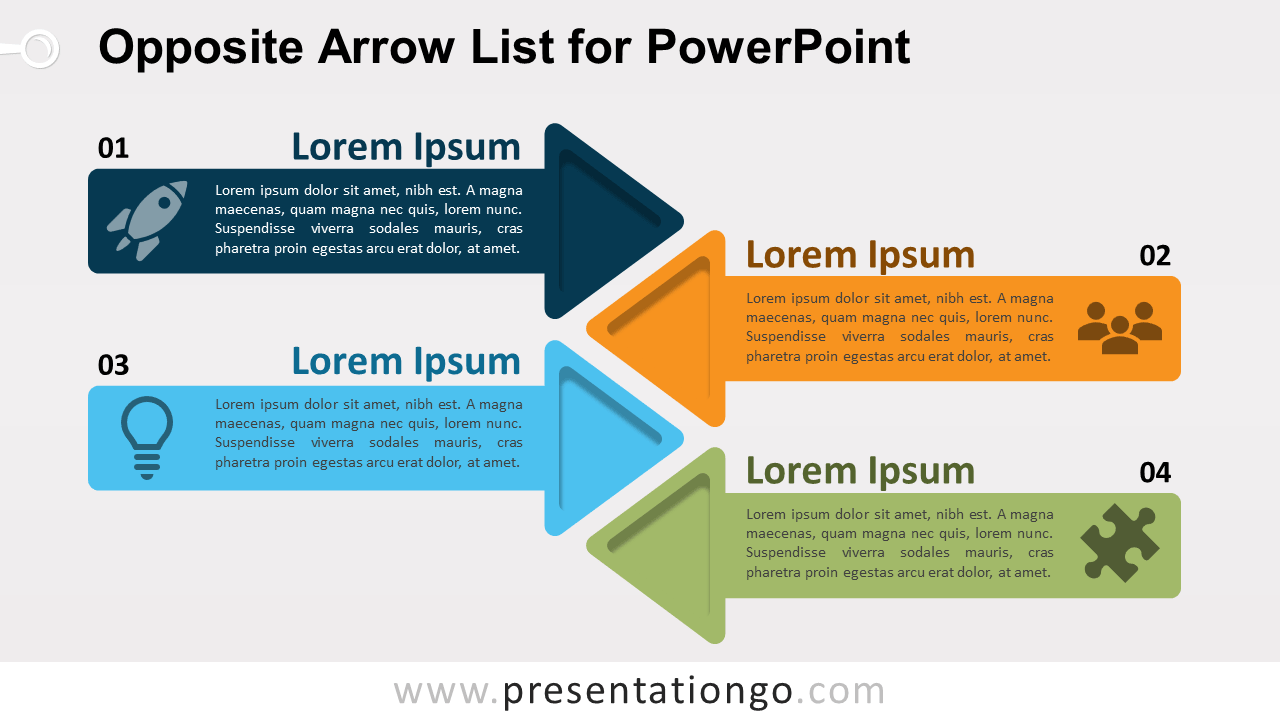
Free opposite arrow list for PowerPoint with text boxes. Set of 4 horizontal alternating arrows pointing to the middle. Editable graphics for PPTX.
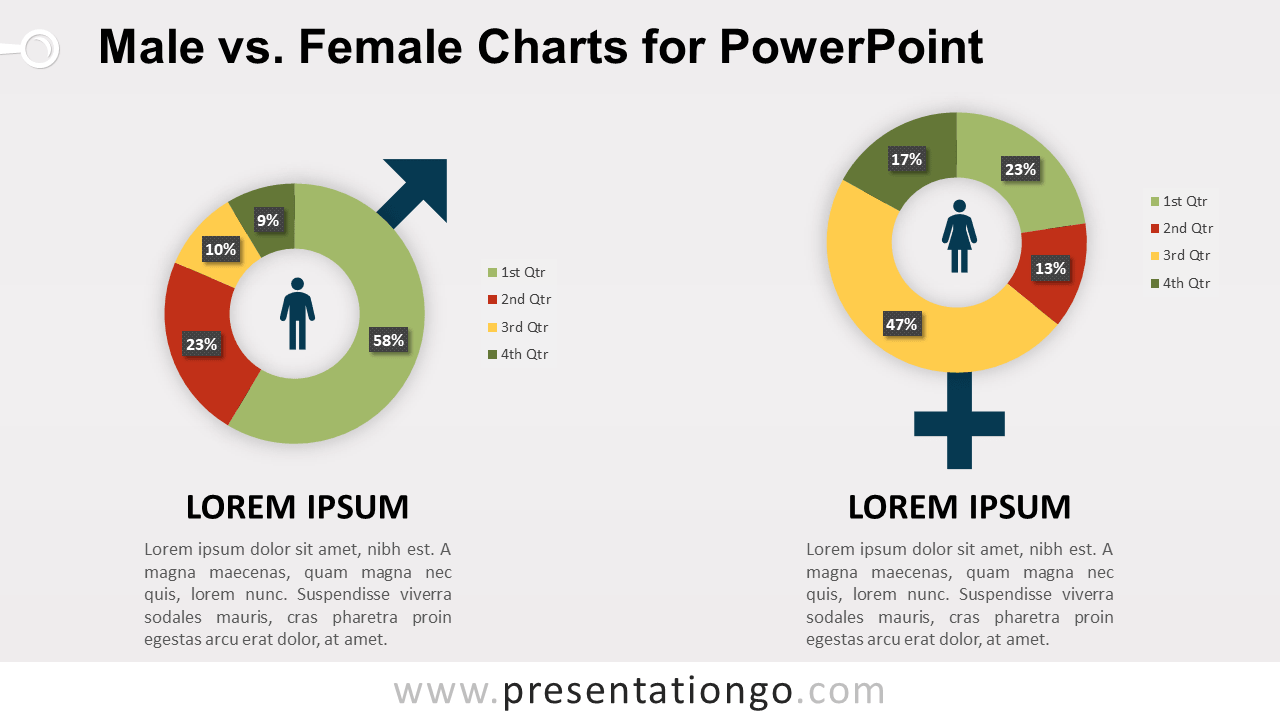
Free male vs. female charts for PowerPoint. Gender symbols of male and female, with data-driven doughnut chart in place of each circle.
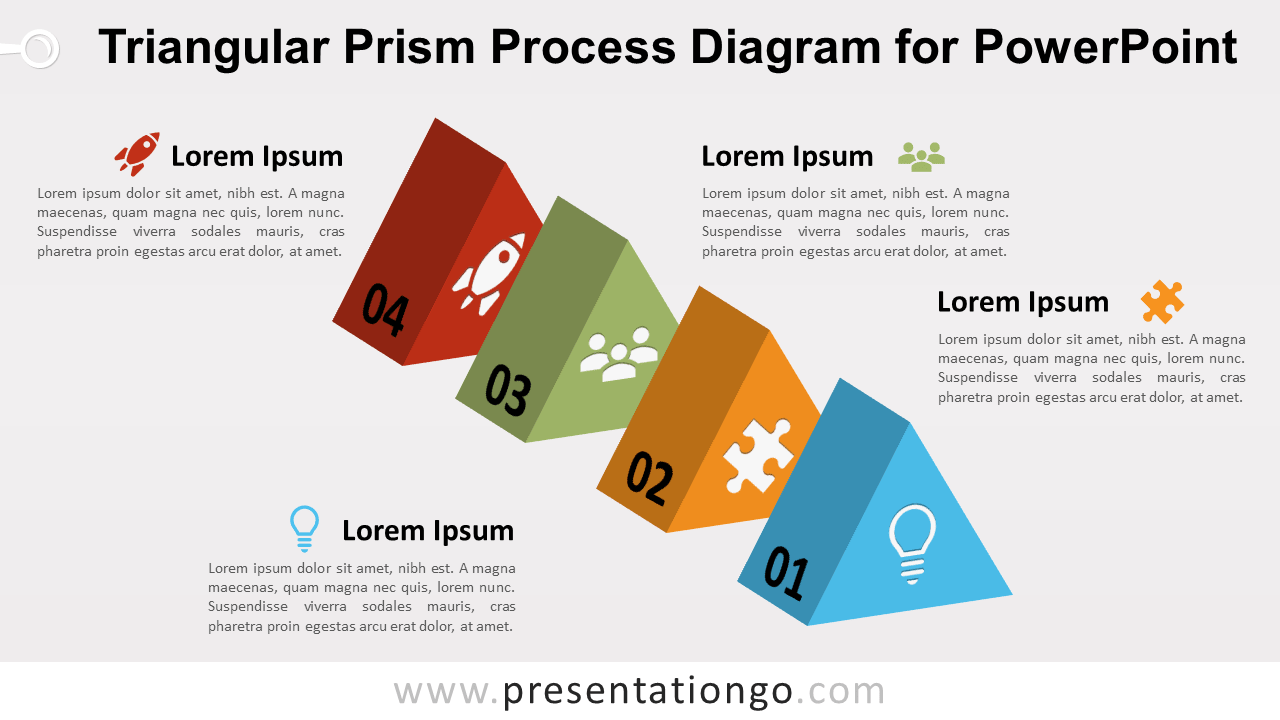
Free triangular prism process diagram for PowerPoint. 4 diagonally-aligned 3D triangular prisms with numbers and icons. Editable graphics.
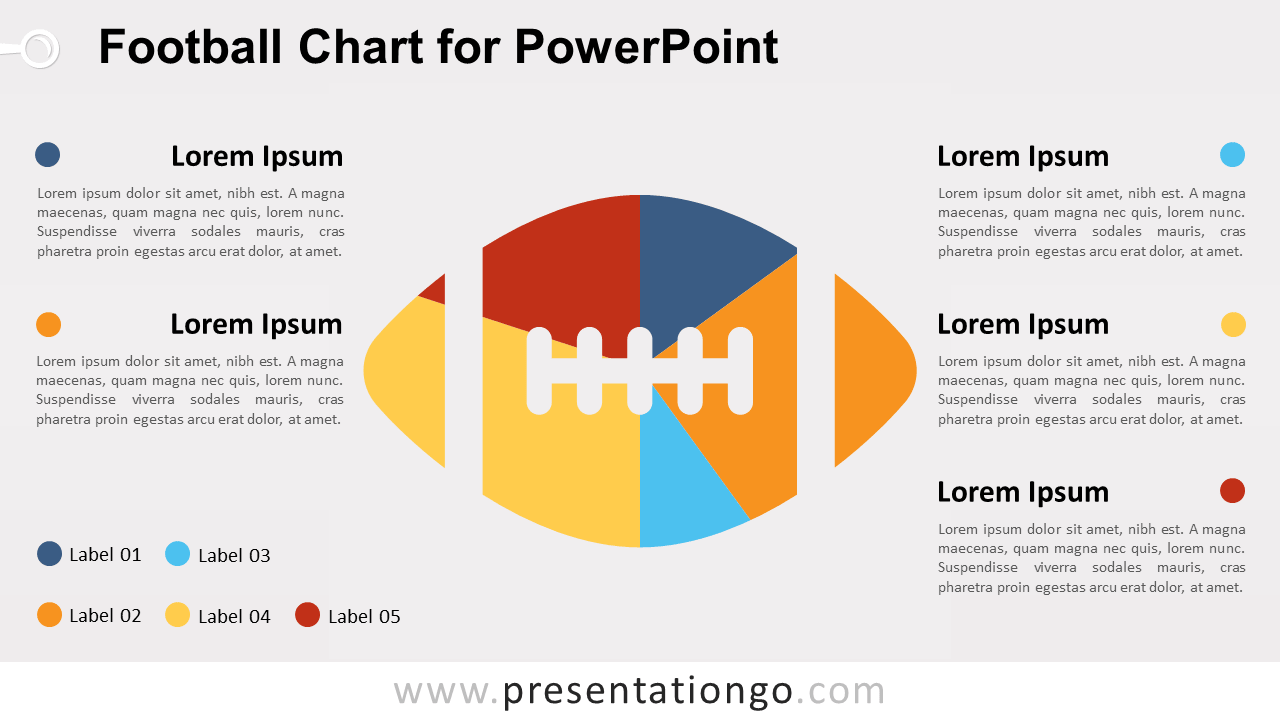
Free football (pie) chart for PowerPoint. American football shape with data-driven pie chart. Editable graphics with text placeholder.
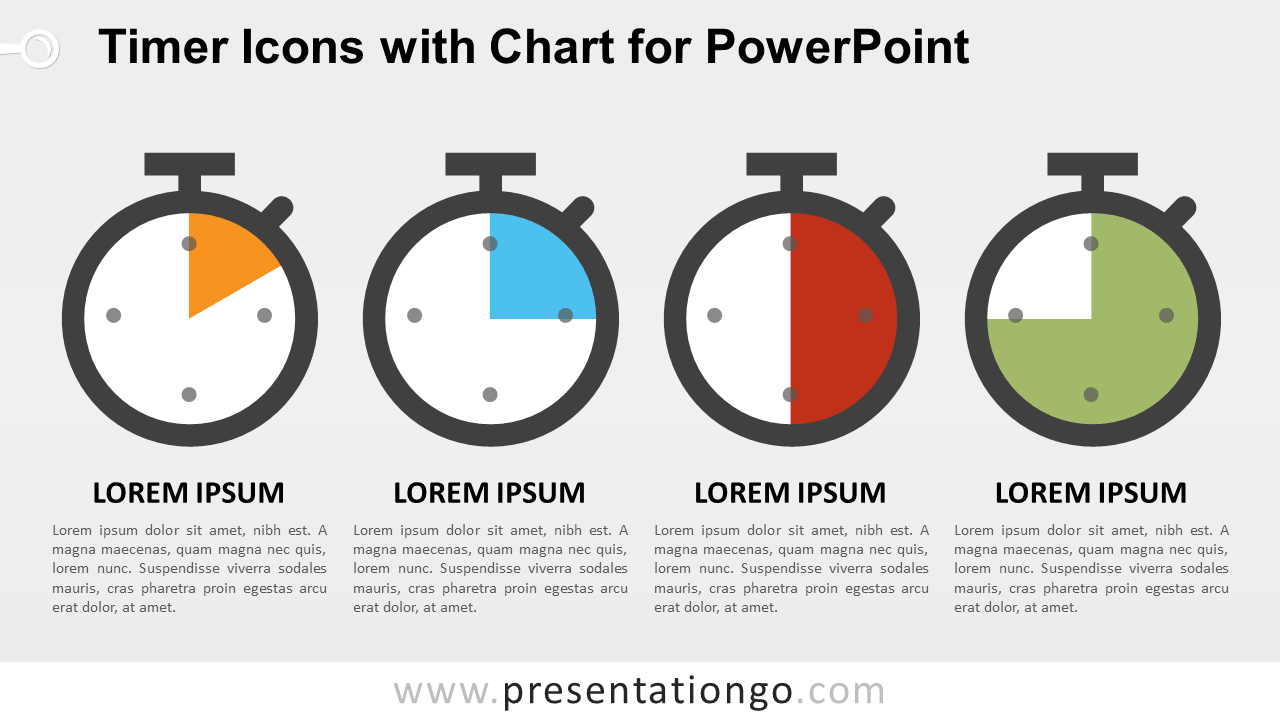
Free timer icons with charts for PowerPoint. Set of 4 timers (stopwatches) with data-driven pie chart to customize the time. Editable graphics.
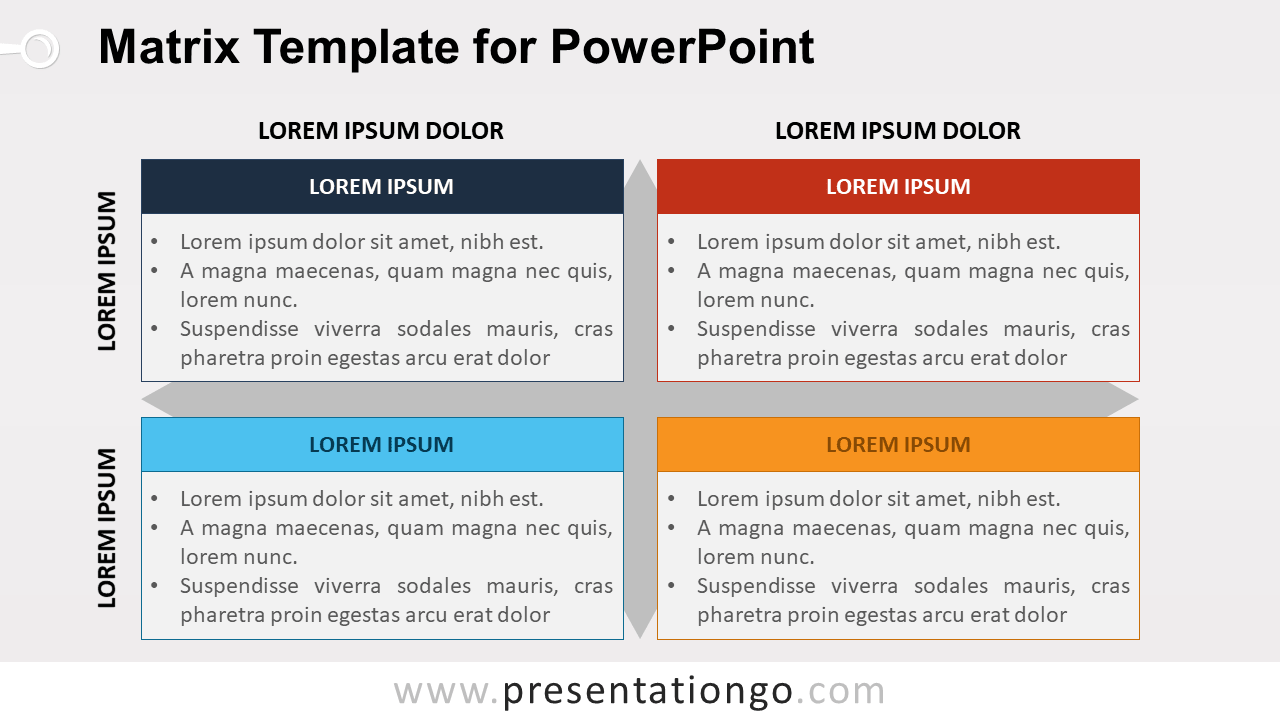
Free matrix template for PowerPoint. Business matrix with 4 quadrants (2x2), two axes, and titles. Editable graphics with text placeholders.
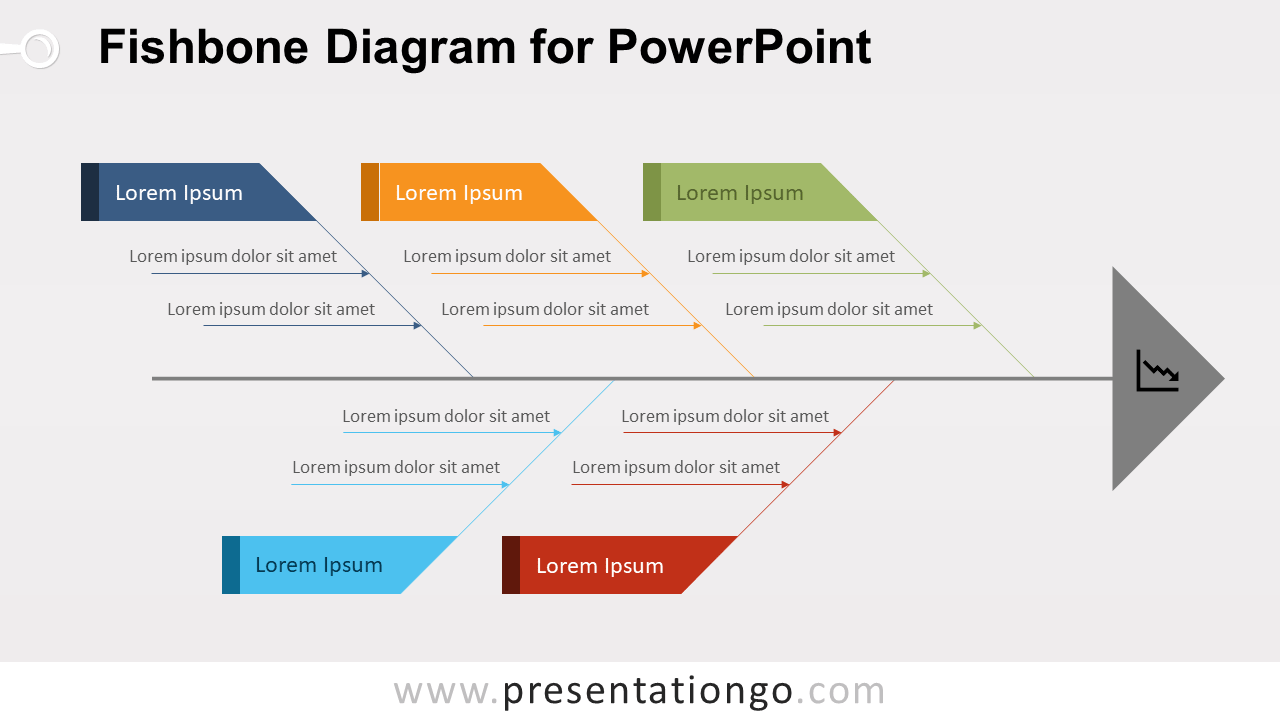
Free simple fishbone (Ishikawa) diagram template for PowerPoint. Simple cause and effect diagram with 5 fishbone shapes. Editable graphics.
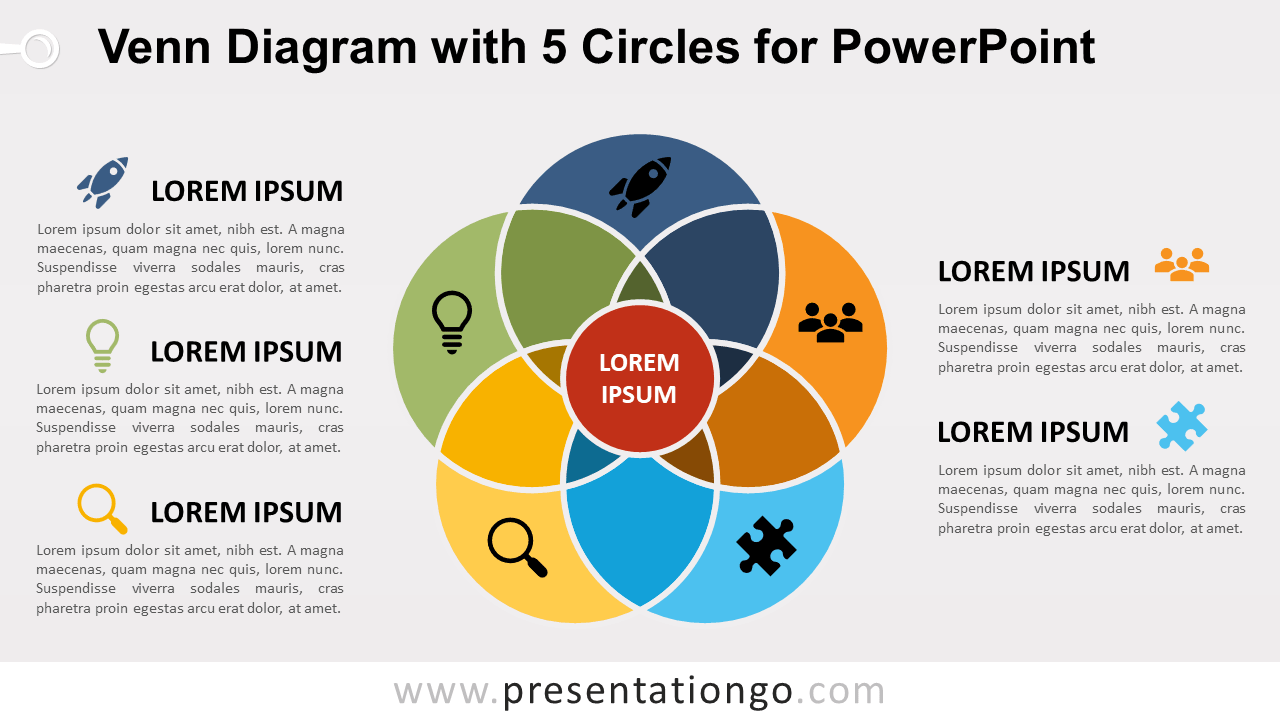
Free Venn diagram with 5 circles for PowerPoint. 5 overlapping fragmented circle shapes. Use this editable diagram to show 5 interconnected ideas.
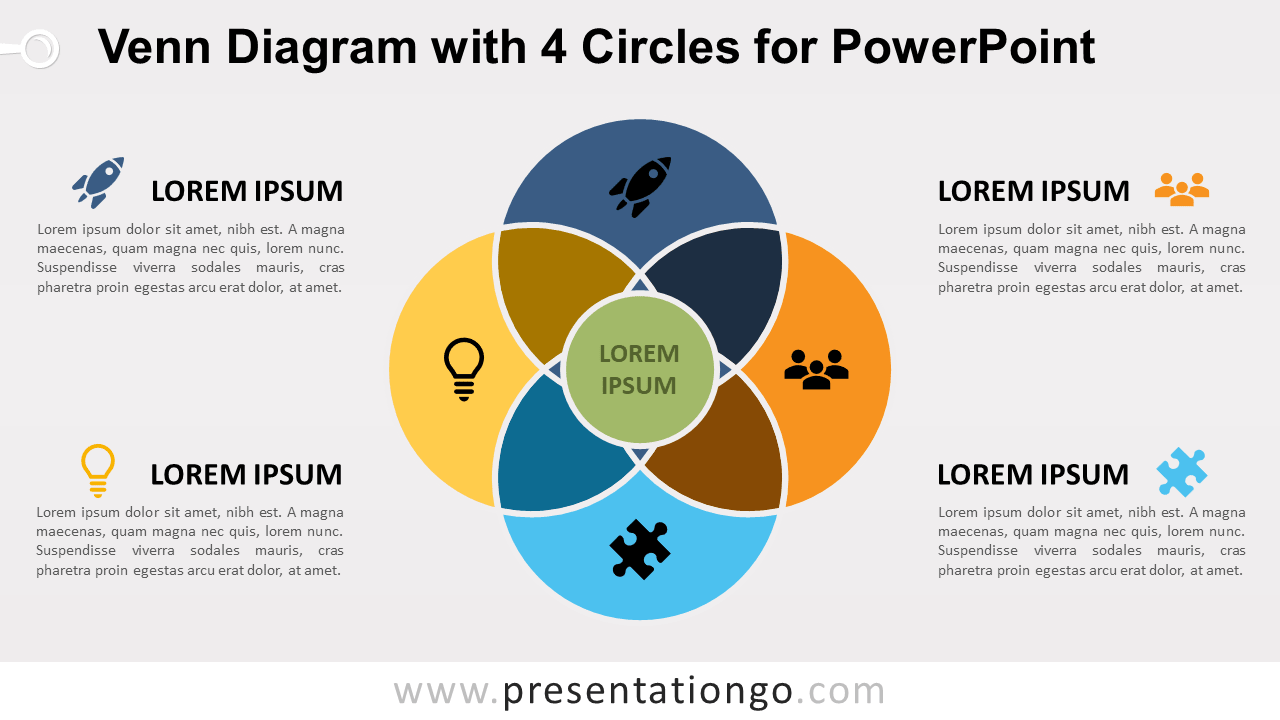
Free Venn diagram with 4 circles for PowerPoint. 4 overlapping circle shapes (editable). Use it to show 4 overlapping relationships or interconnected ideas.
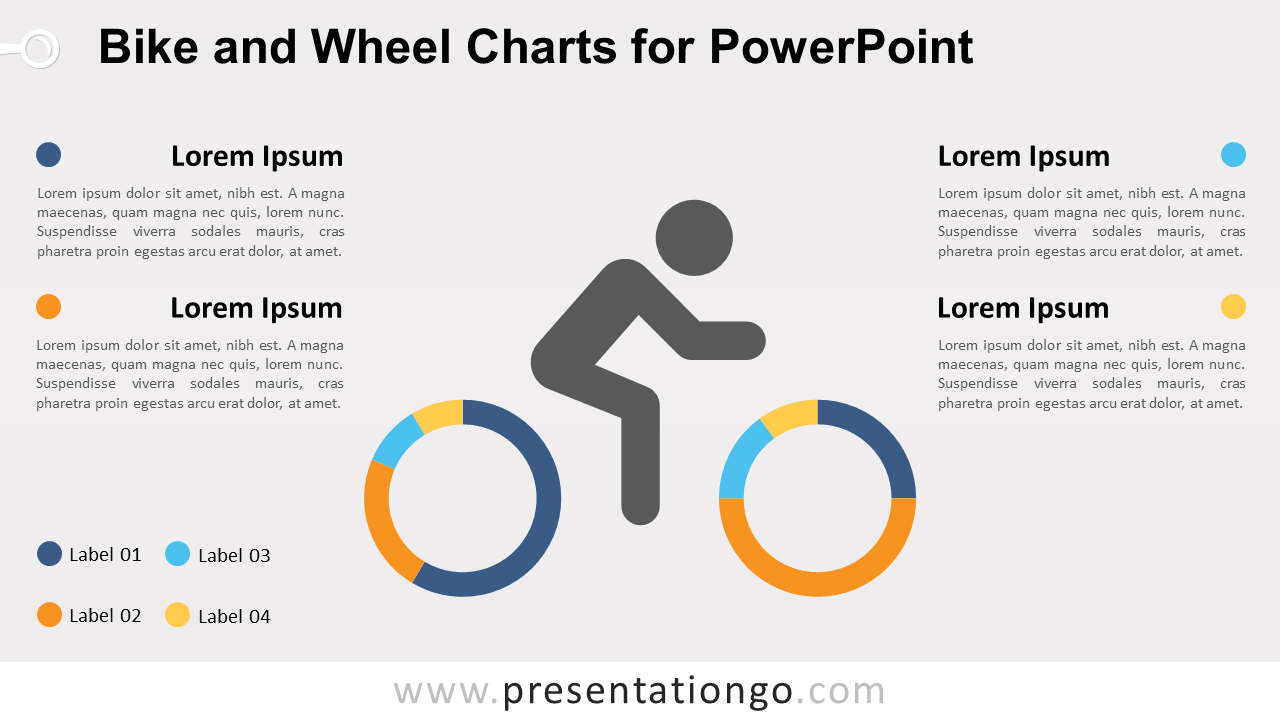
Free bike and wheel charts for PowerPoint. Man riding a bike with wheels made with data-driven doughnut chart. Great to compare quantitative results.
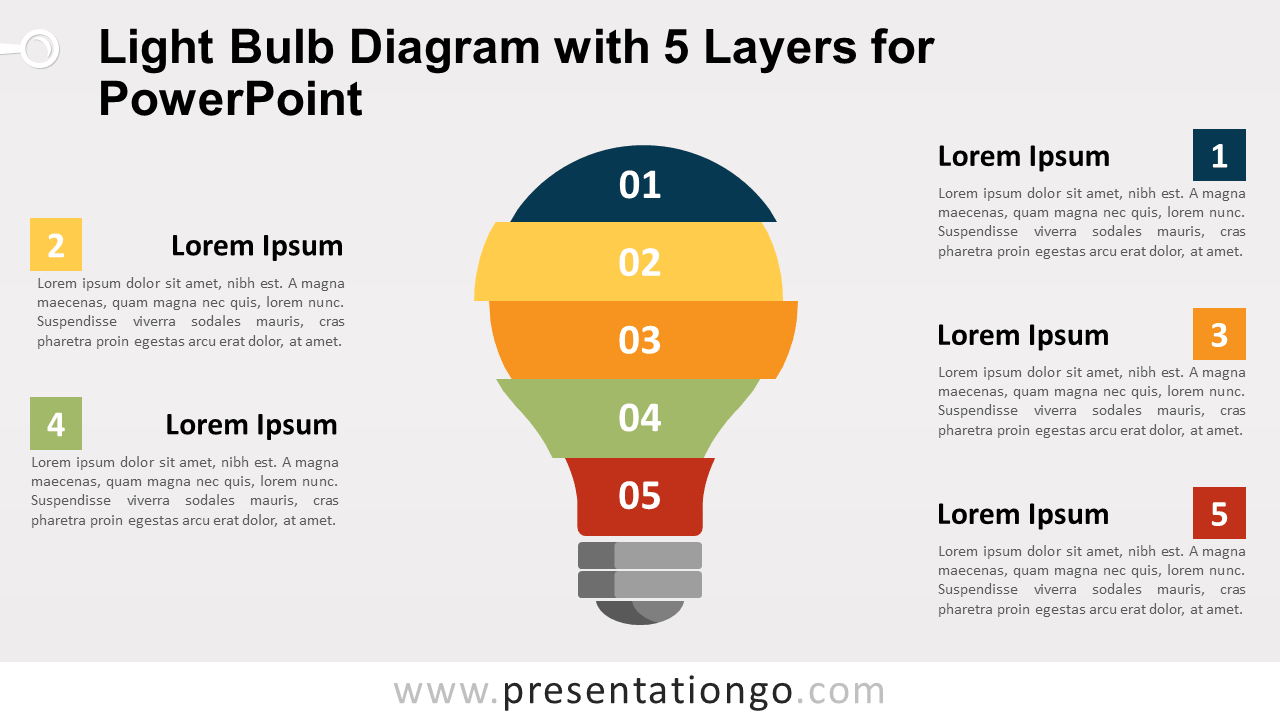
Free light bulb diagram with 5 layers for PowerPoint. Light bulb sliced into 5 pieces. Editable graphics with numbers and text placeholders.
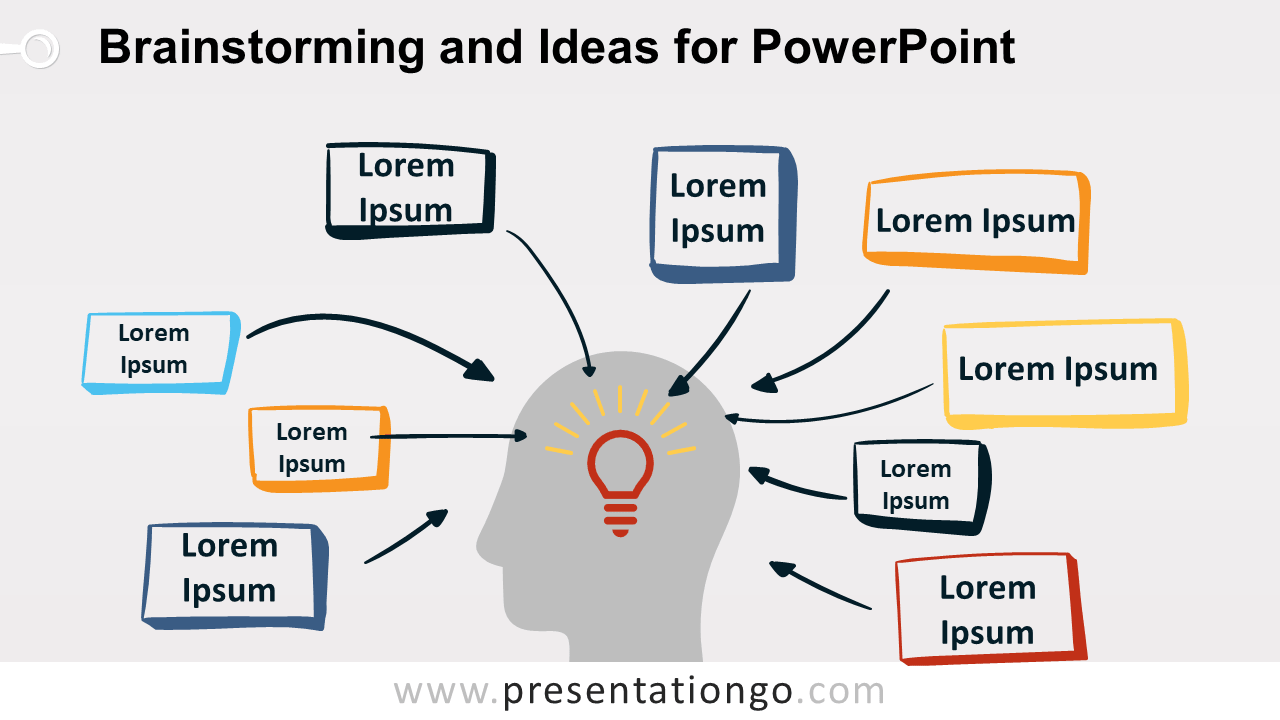
Free brainstorming and ideas for PowerPoint. Man head with a light bulb in place of the brain, and word cloud with sketch (hand-drawn) borders.
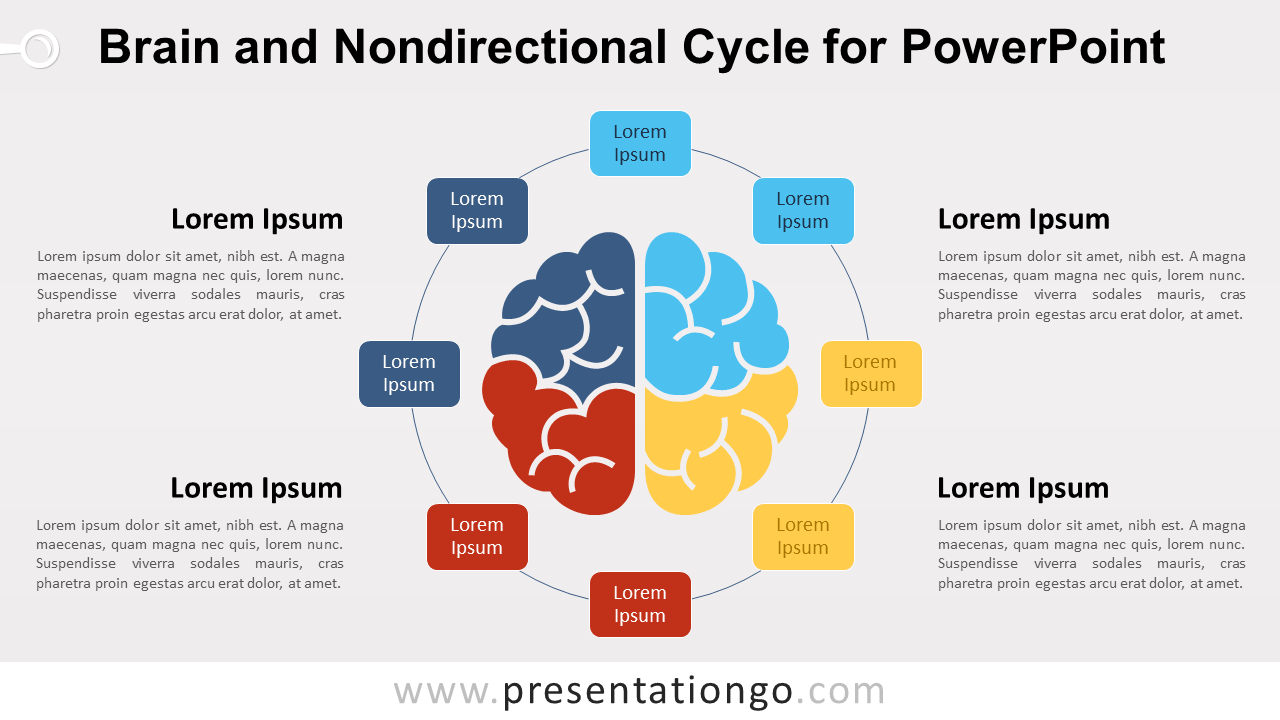
Free brain and nondirectional cycle for PowerPoint. Nondirectional SmartArt graphic with a brain with 4 parts in the middle. 100% editable graphic design.
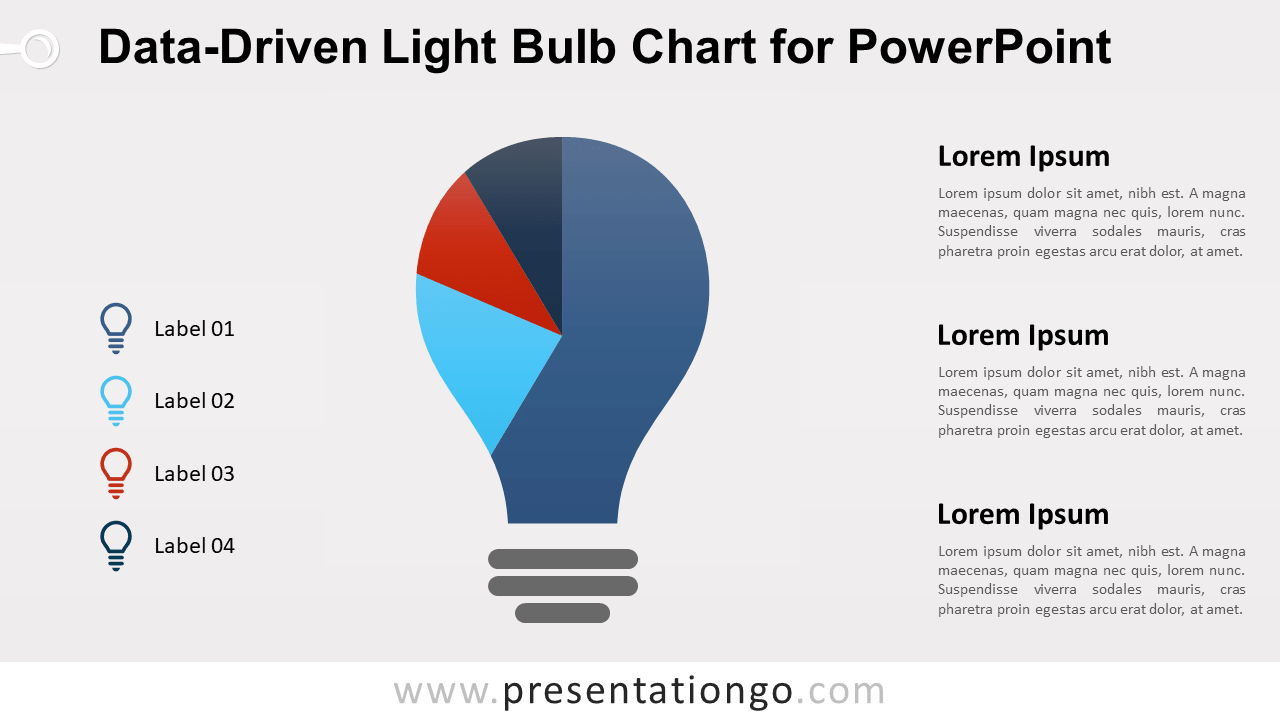
Free light bulb chart for PowerPoint. Bulb design made with a data-driven pie chart. Infographic metaphor for ideas, innovation. 100% editable graphics.
Use this free template both in Powerpoint and Google Slides. It features a nativity scene with the three wise men looking up at the star of Bethlehem. Edit the texts, change the background or use any of the cute christmas icons included.
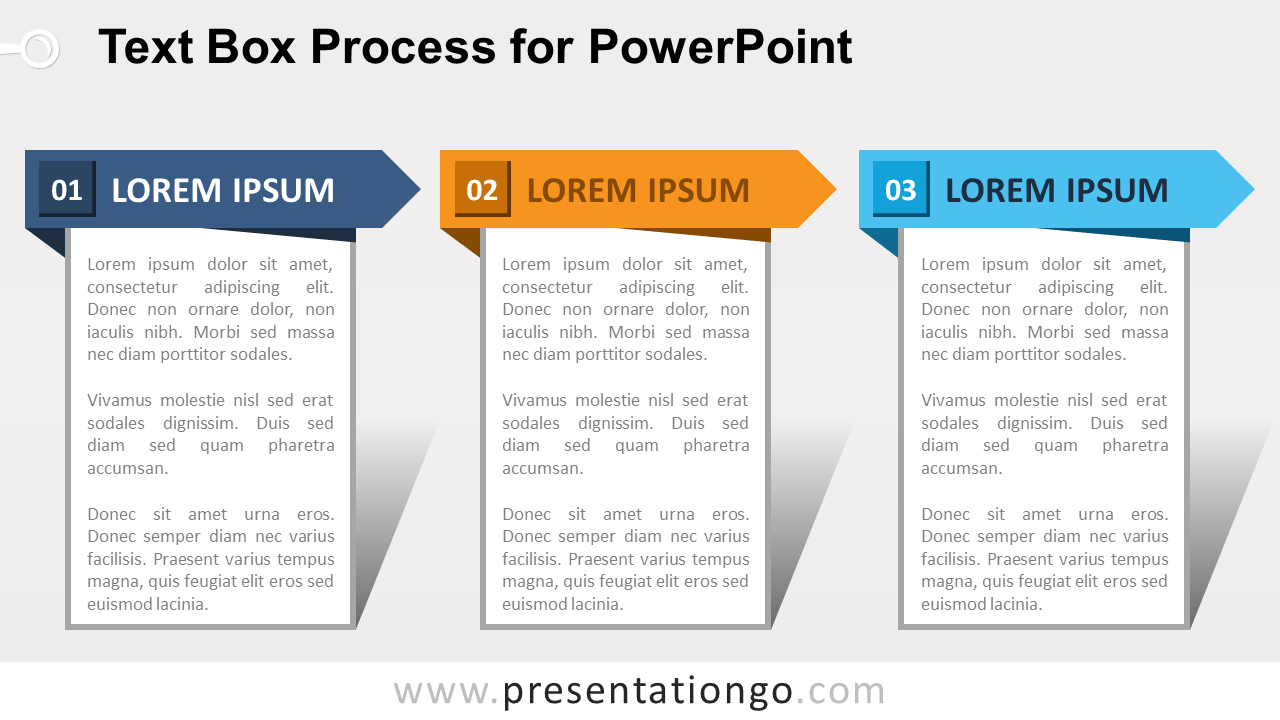
Free text box process for PowerPoint. Illustration of 3 text shapes with a horizontal arrow on top (with folded effect) and shadow. Editable graphics.
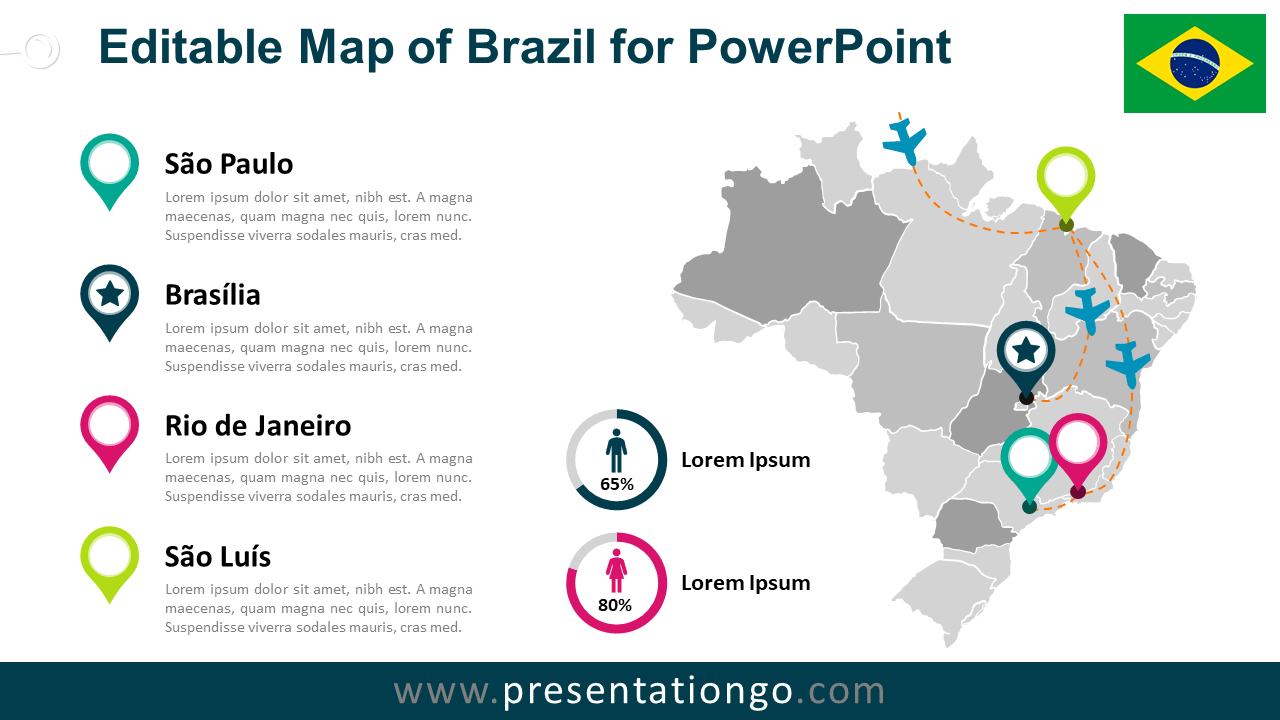
Free map of Brazil for PowerPoint. Map with Brazilian states, colored location pins, and flag. Fully editable graphics with text placeholder.
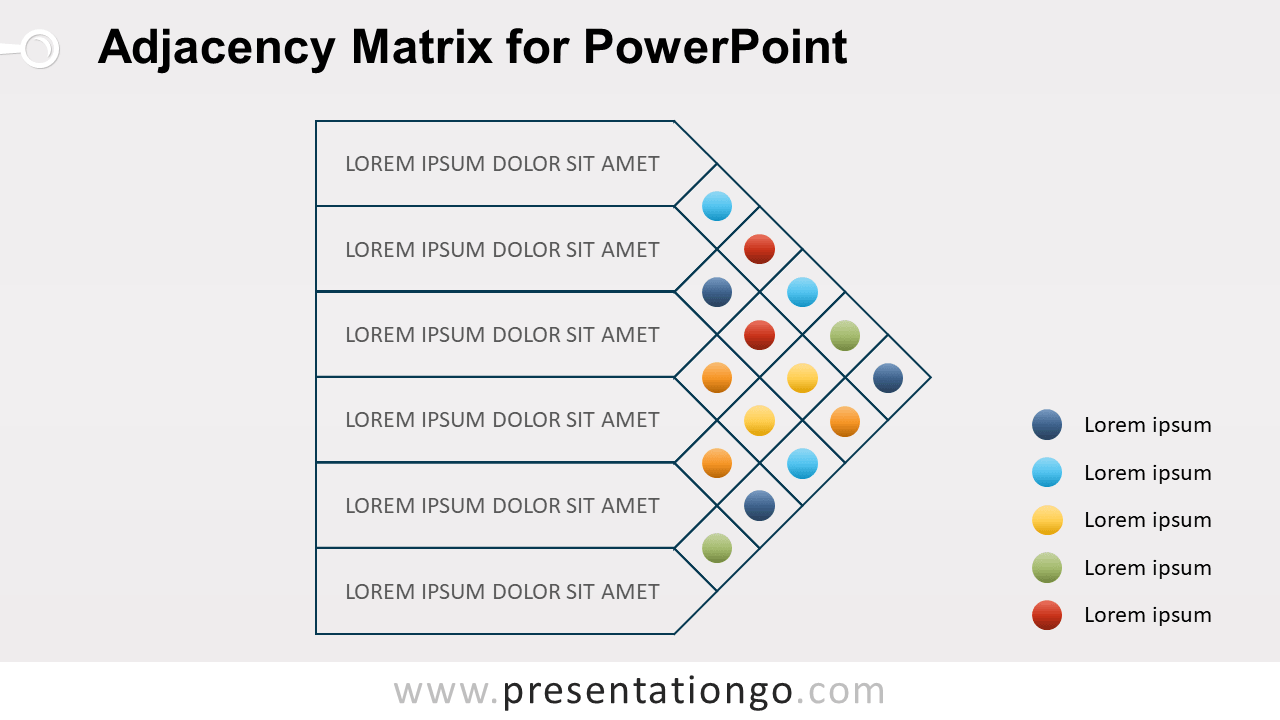
Free adjacency matrix diagram for PowerPoint. AKA roof-shaped matrix or connection matrix. Matrix design with up to 6 elements that can be associated.