Loading resources…
Total 8114 resources
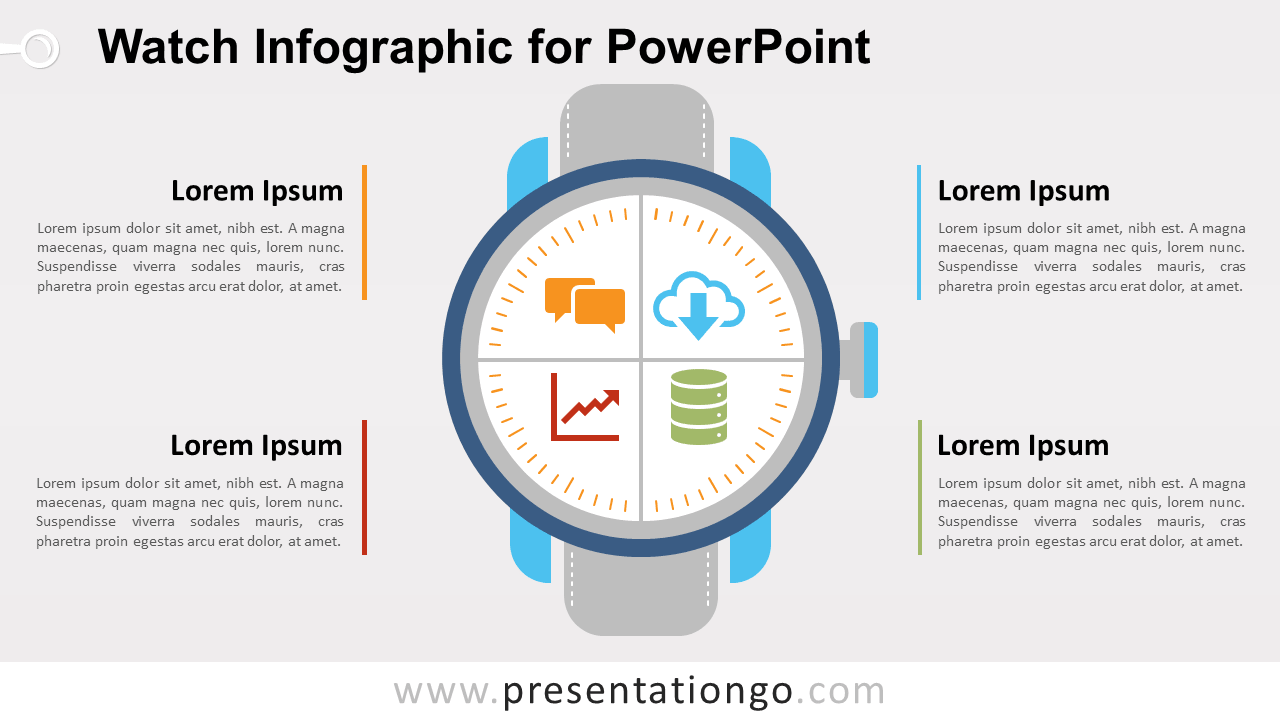
Free watch infographic for PowerPoint. Watch design with 4 quadrants and icons. Use this infographic in your presentation as an analogy for time.
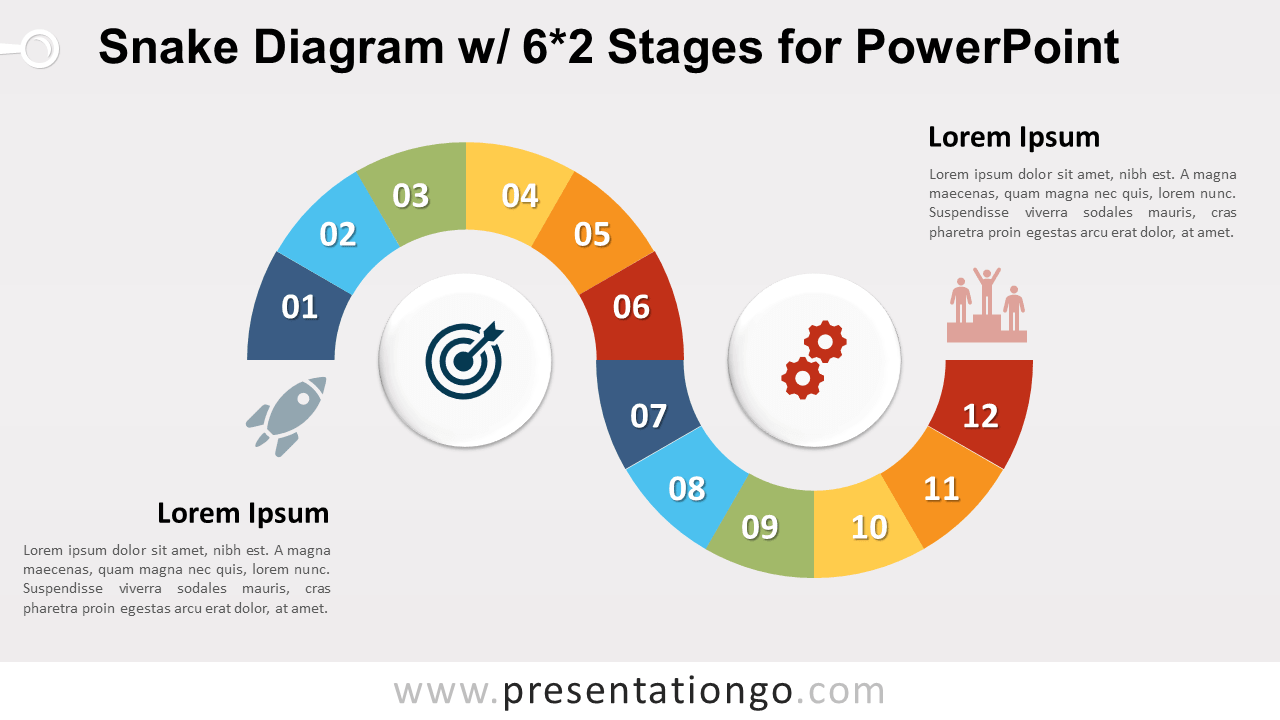
Free snake diagram with 6x2 stages for PowerPoint. Sinuous 12-step process diagram w/ colorful doughnut parts, and 2 circles with icons.
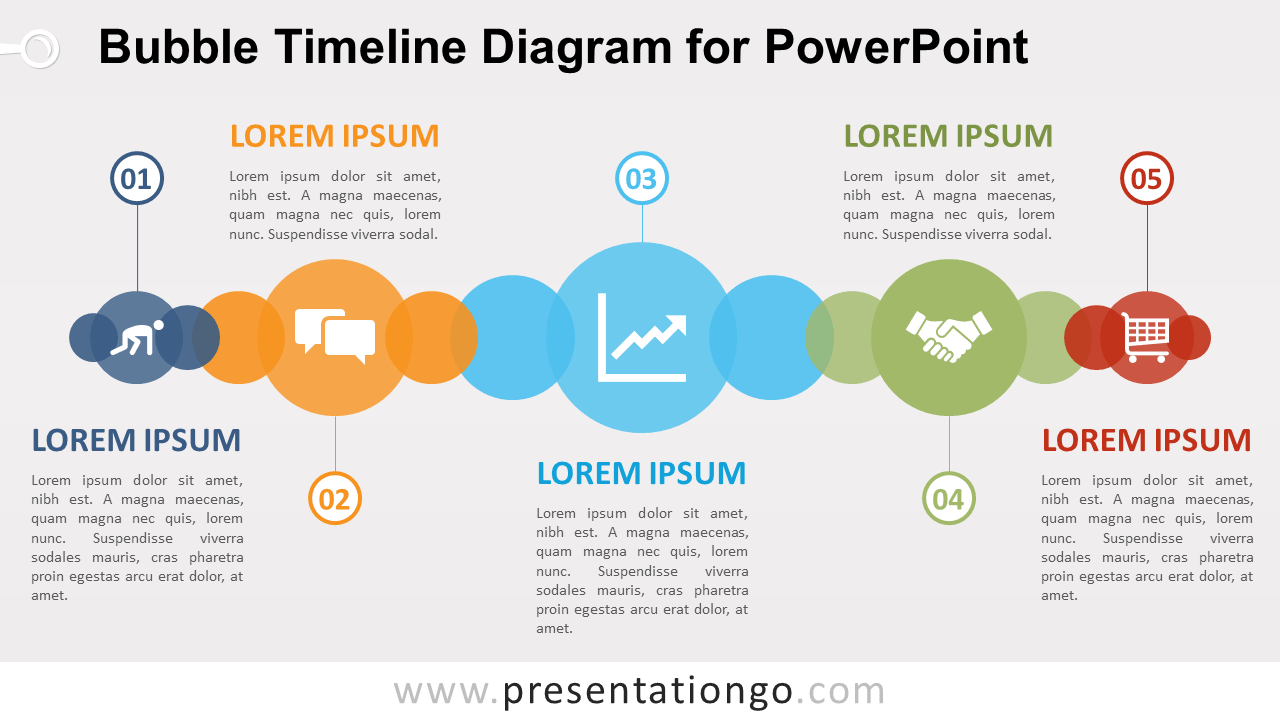
Free bubble timeline diagram for PowerPoint. 5-step horizontal timeline diagram with colorful circles in different sizes aligned. Editable graphics.
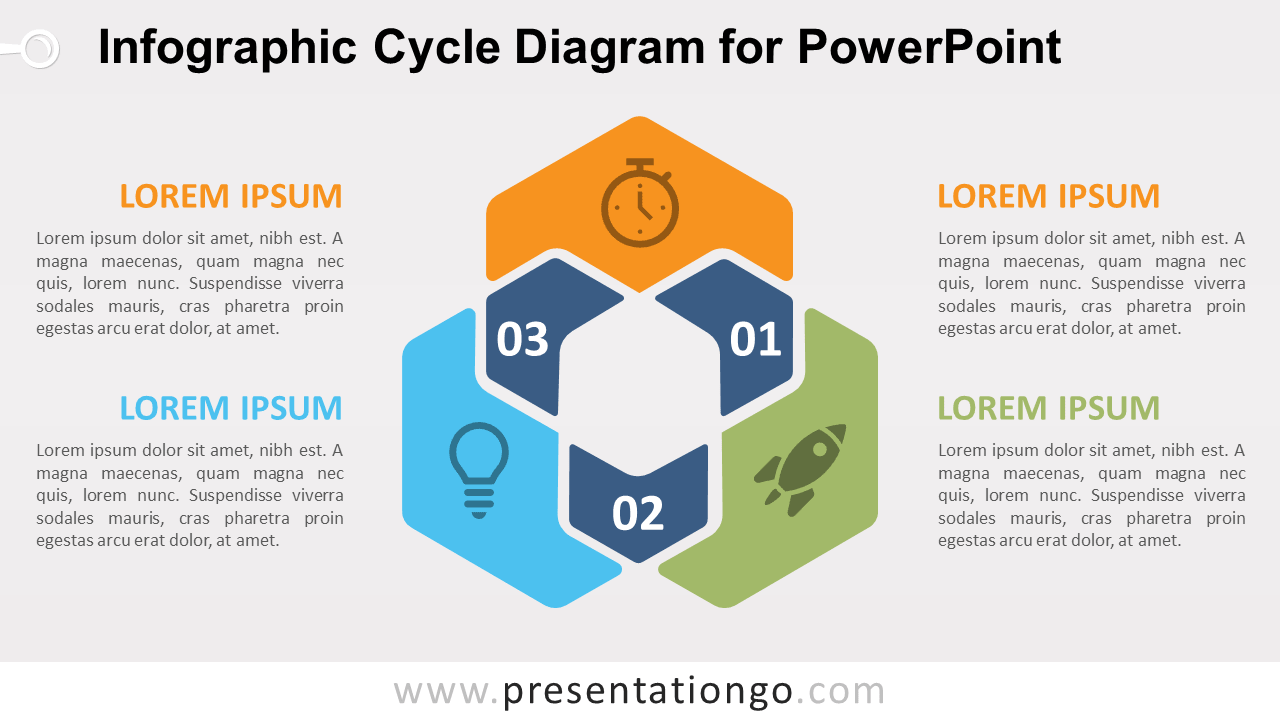
Free infographic cycle (Venn) diagram for PowerPoint. Colorful cycle design with 3 hexagonal overlapping shapes. Editable graphics.
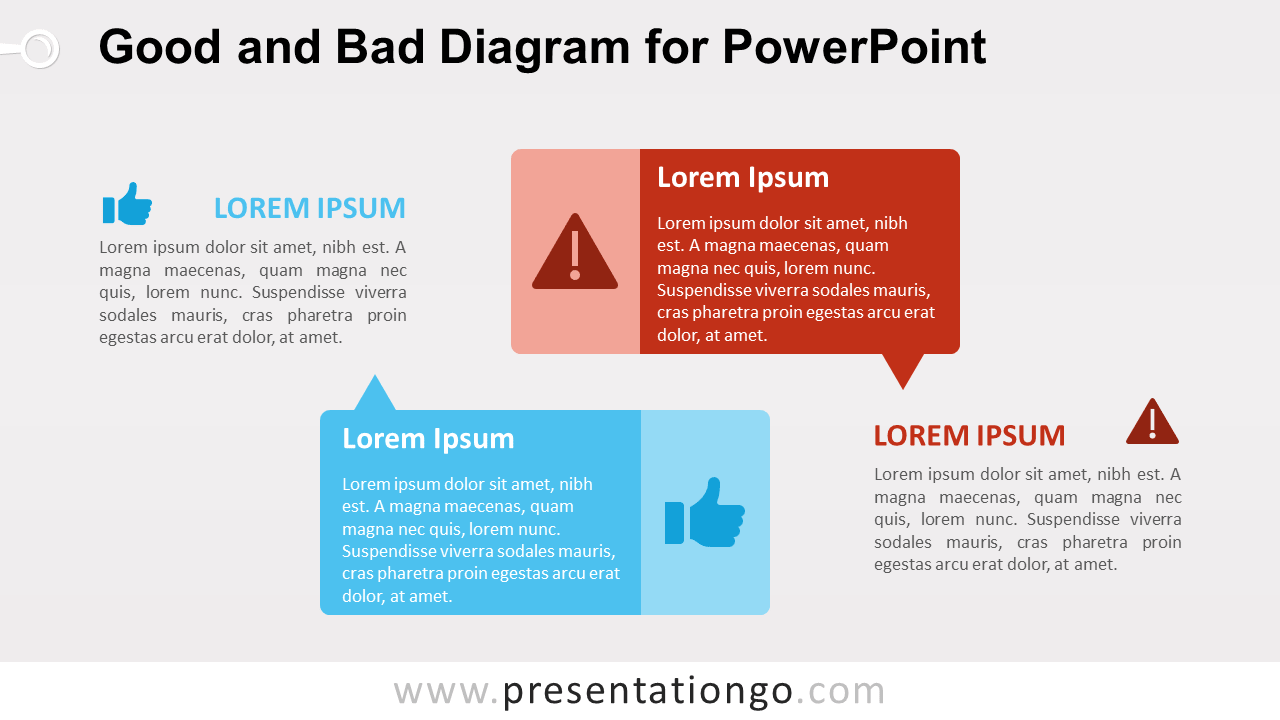
Free good and bad diagram for PowerPoint. Colorful design with 2 overlapped text blocks. Use this diagram to compare 2 opposite ideas or concepts.
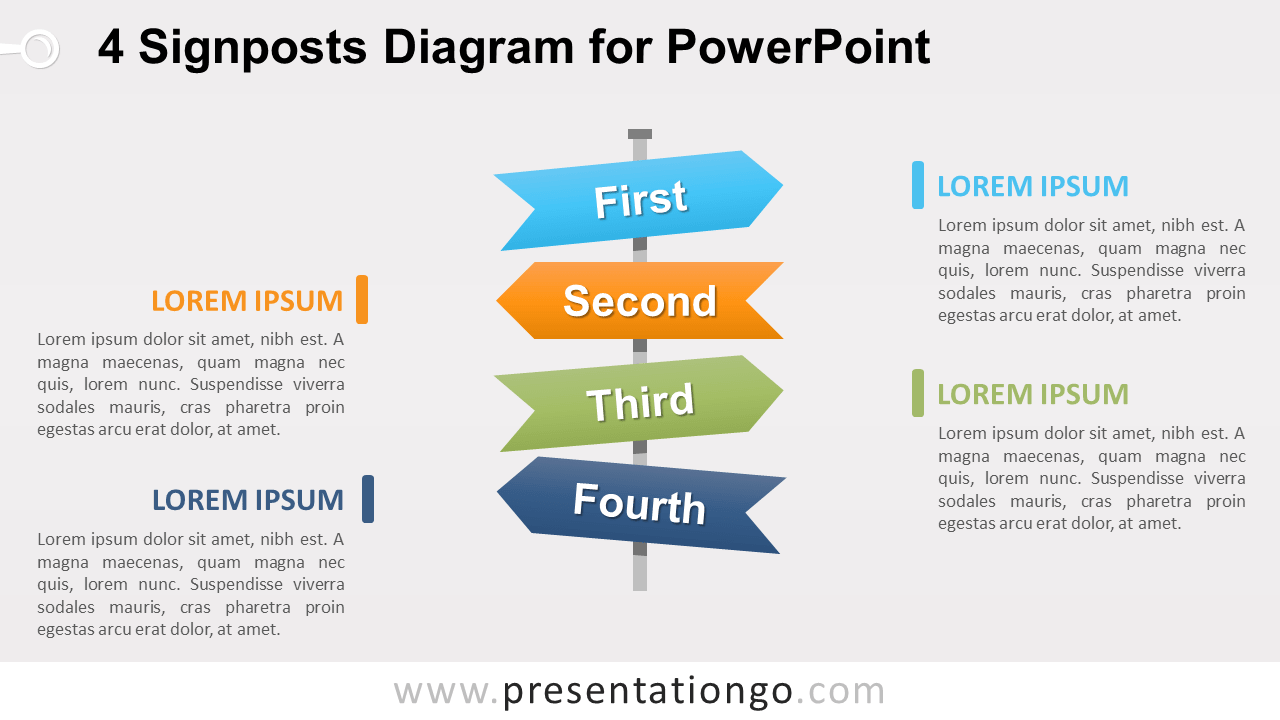
Free 4 signposts diagram for PowerPoint. Infographic design with 4 colorful directional signs (left and right). Editable graphics with text placeholder.
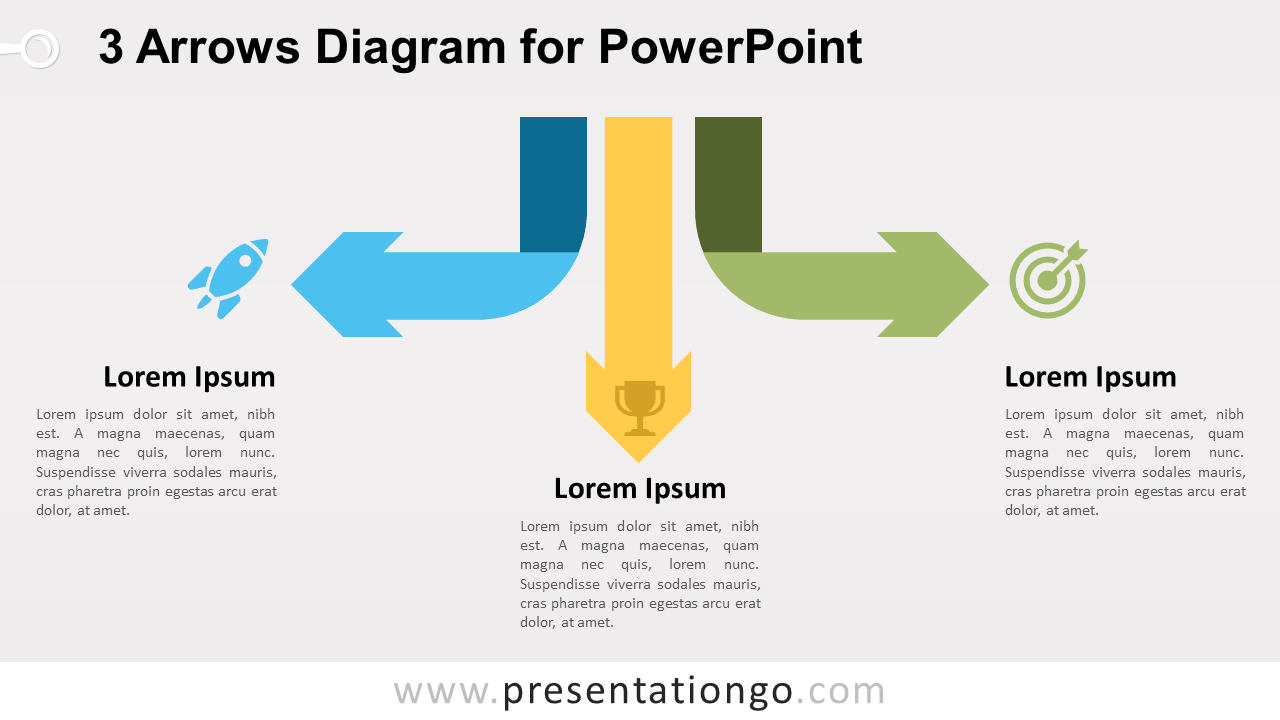
Free diagram for PowerPoint with 3 downwards arrows. Editable graphics with text placeholder. Use this template to illustrate 3 ideas or concepts.
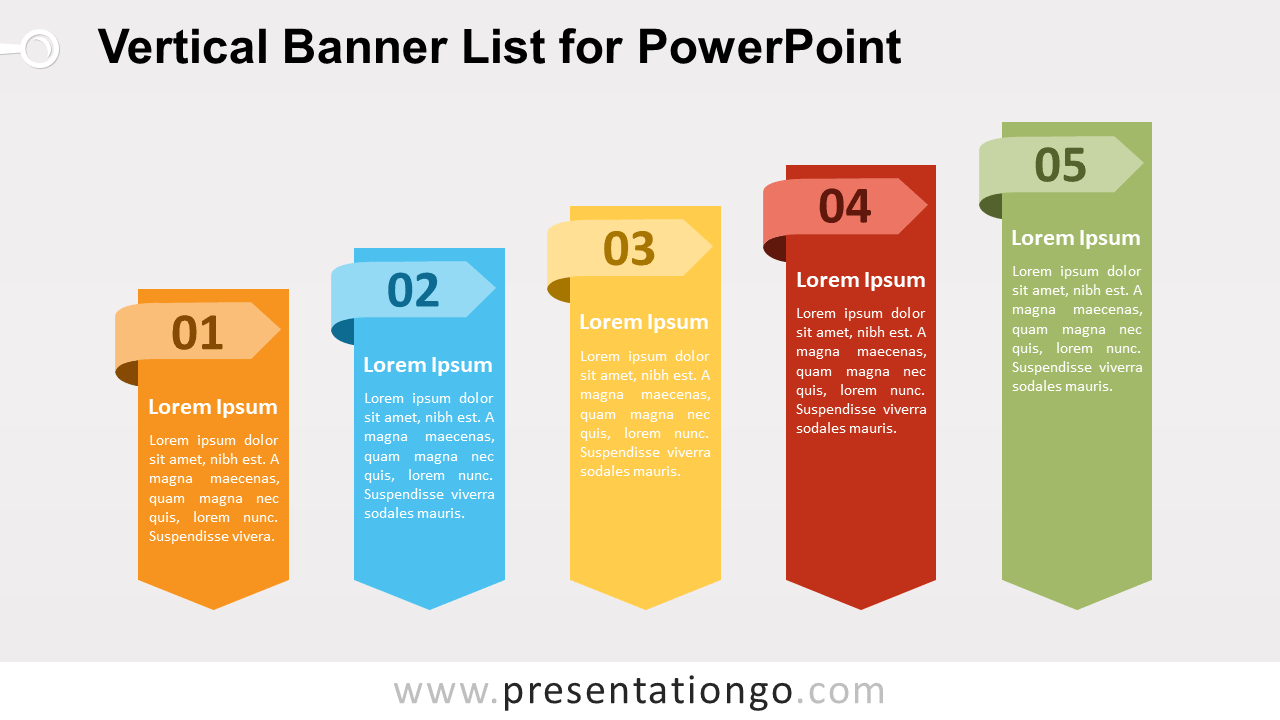
Free vertical banner list for PowerPoint. 5 vertical banners (or ribbons), with a pentagon arrow for numbers. Editable graphics with text placeholder.
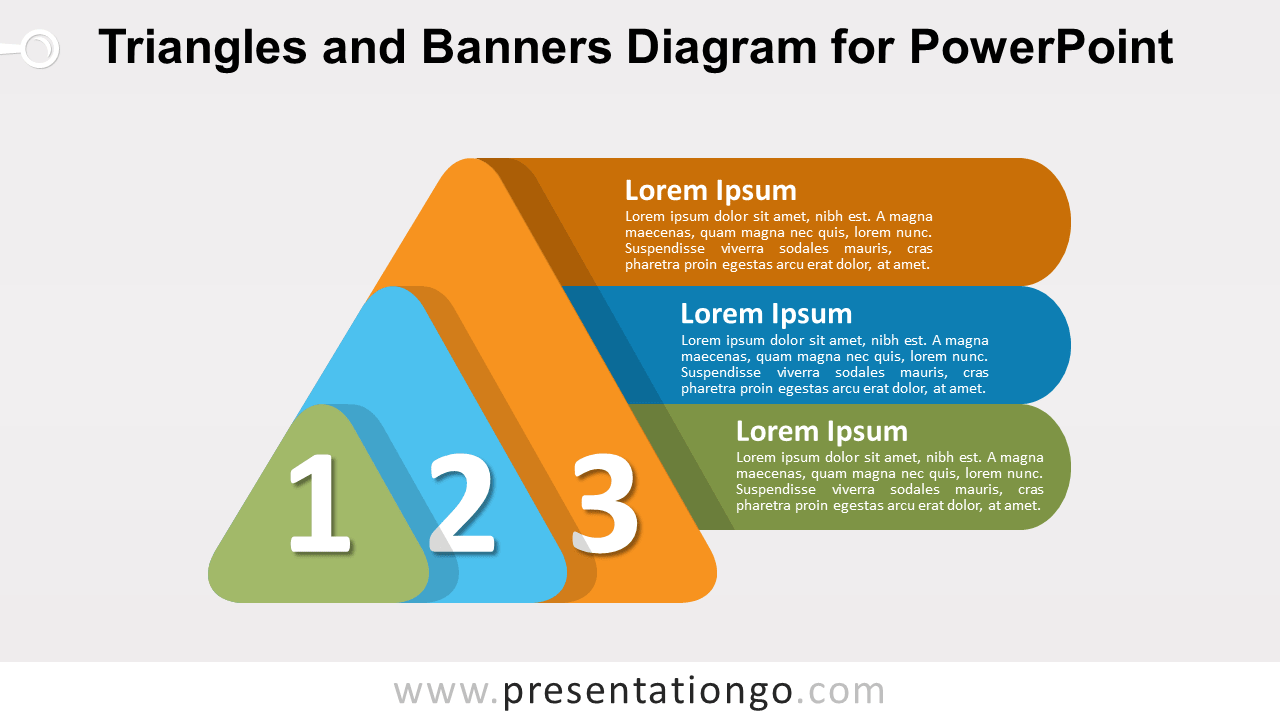
Free layered triangles and banners diagram for PowerPoint. Editable graphics with text placeholder. Use it to show a progression or 3 sequential steps.
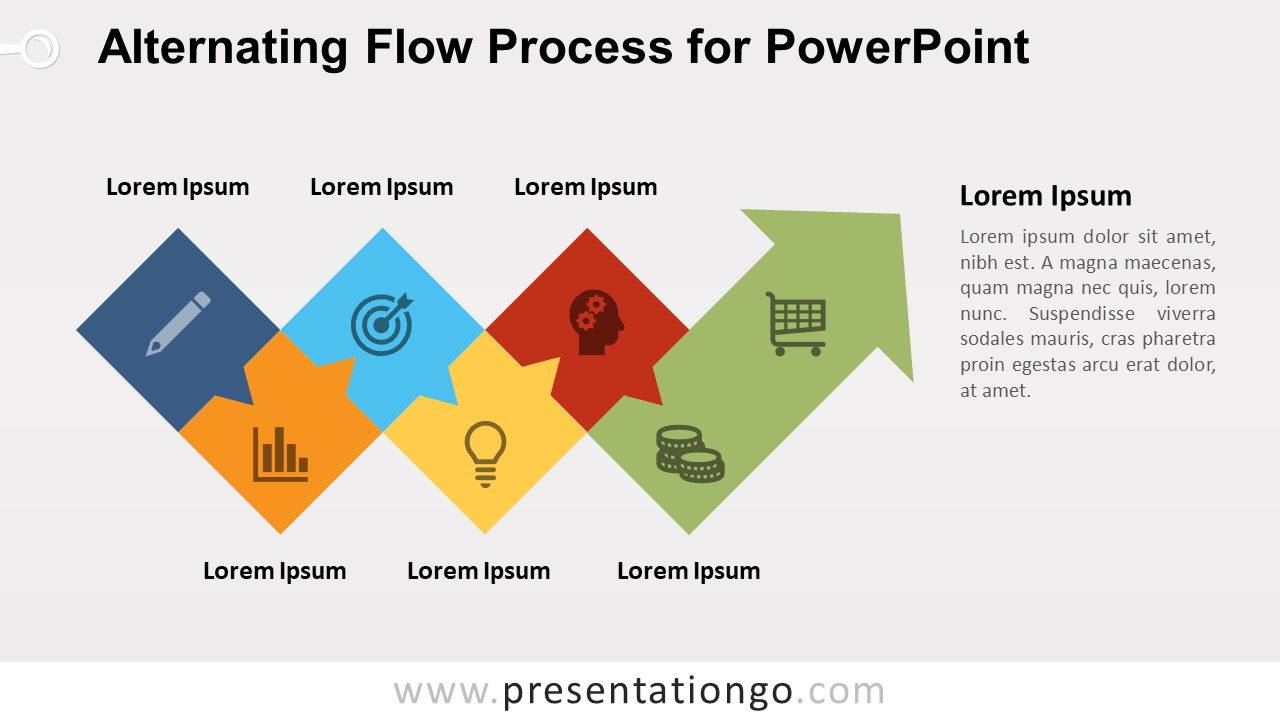
Free alternating flow process diagram for PowerPoint. 5-step horizontal process diagram w colorful up and down U-turn arrows. Editable graphics.
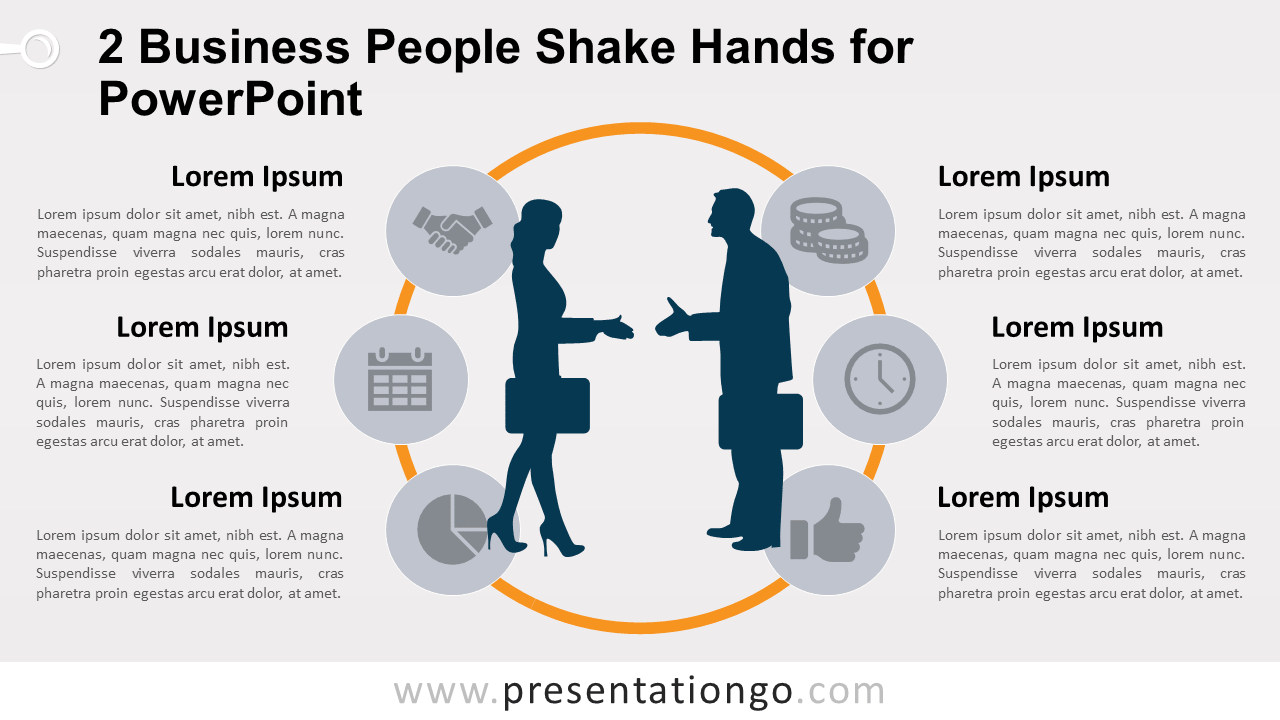
Free PowerPoint template with 2 business people silhouettes shaking hands. Editable graphics. For slides about a business deal, partnership, commitment.
Enjoy this free Christmas presentation theme for Powerpoint and Google Slides. Elegant design with snowflakes, stars and cute christmas icons.
Engage with your Powerpoint or Google Slides presentation using this photographic free theme, perfect for storytelling. 100% customizable template.
Use this fresh & simple Powerpoint template or Google Slides theme and have your deck ready in minutes. Lots of layouts and materials included for free.
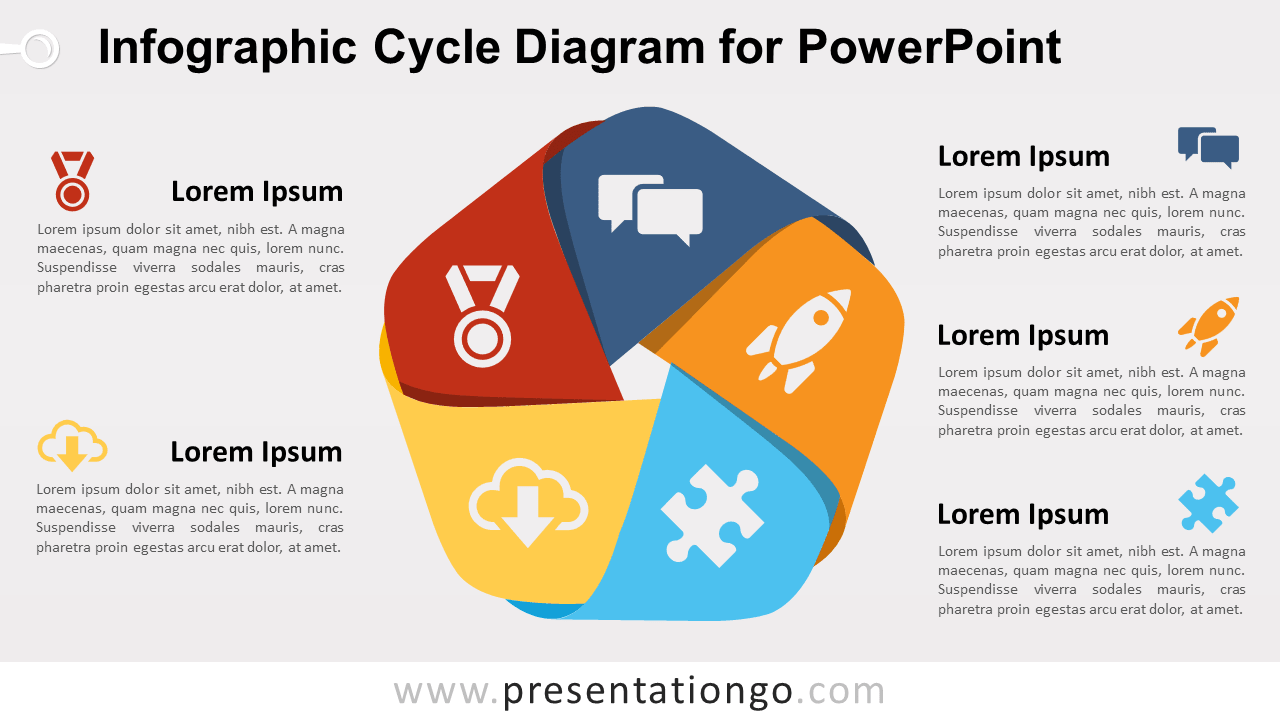
Free infographic cycle diagram for PowerPoint. Colorful cycle design with 5 stages, looking like braided strips. Editable graphics with text placeholder.
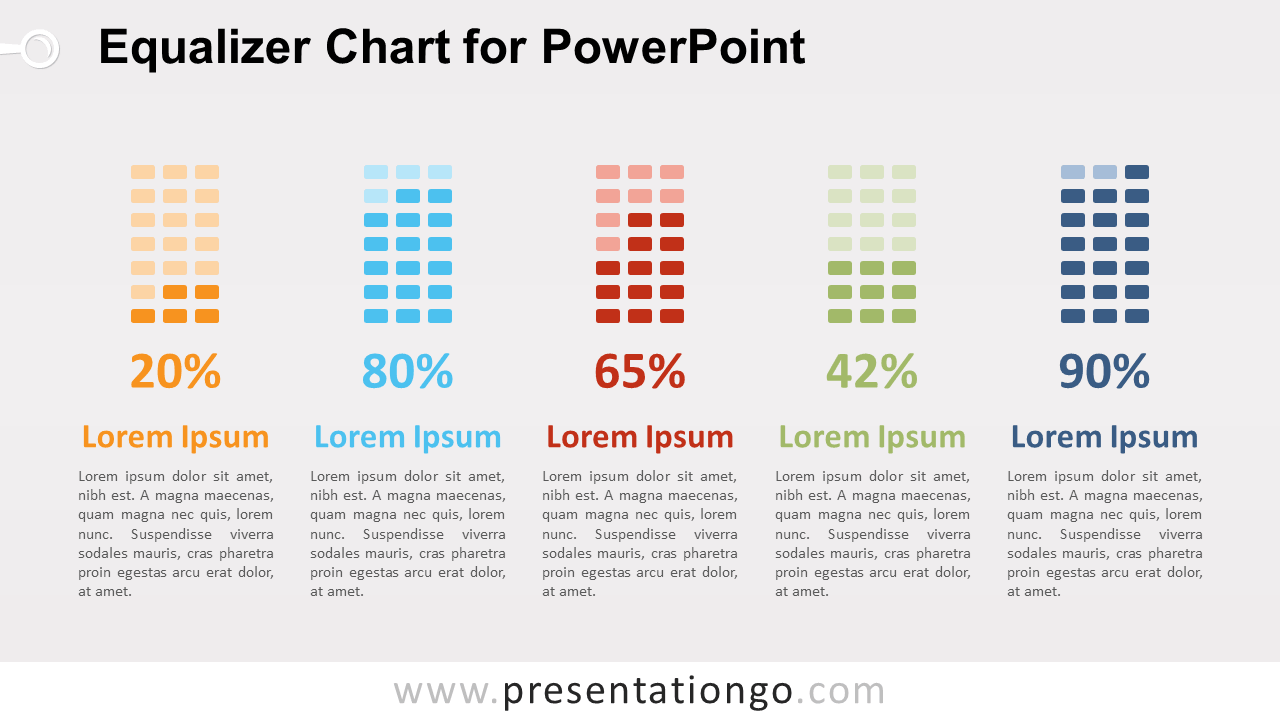
Free equalizer chart for PowerPoint with 5 vertical level indicators. Editable graphics with text placeholder. Use this diagram to compare quantitative data
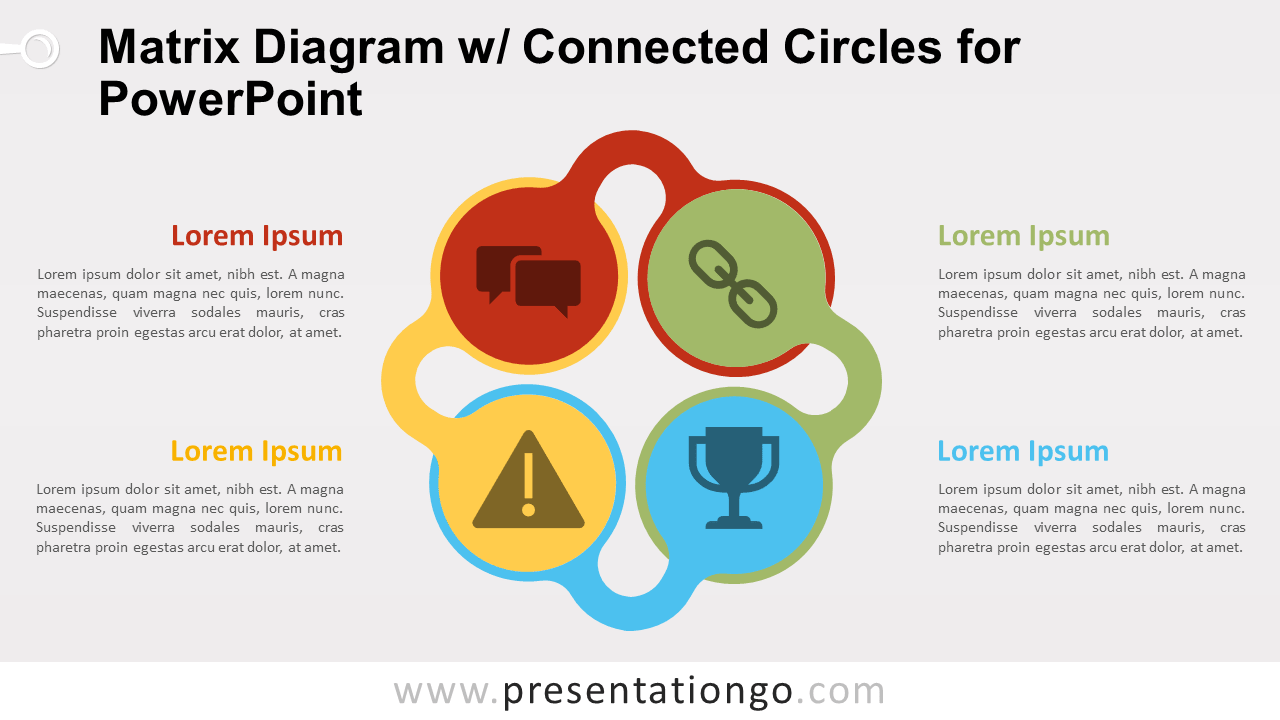
Free matrix diagram with connected circles for PowerPoint. Colorful design with 4 circular shapes, or 4 stages. Editable graphics with text placeholder.
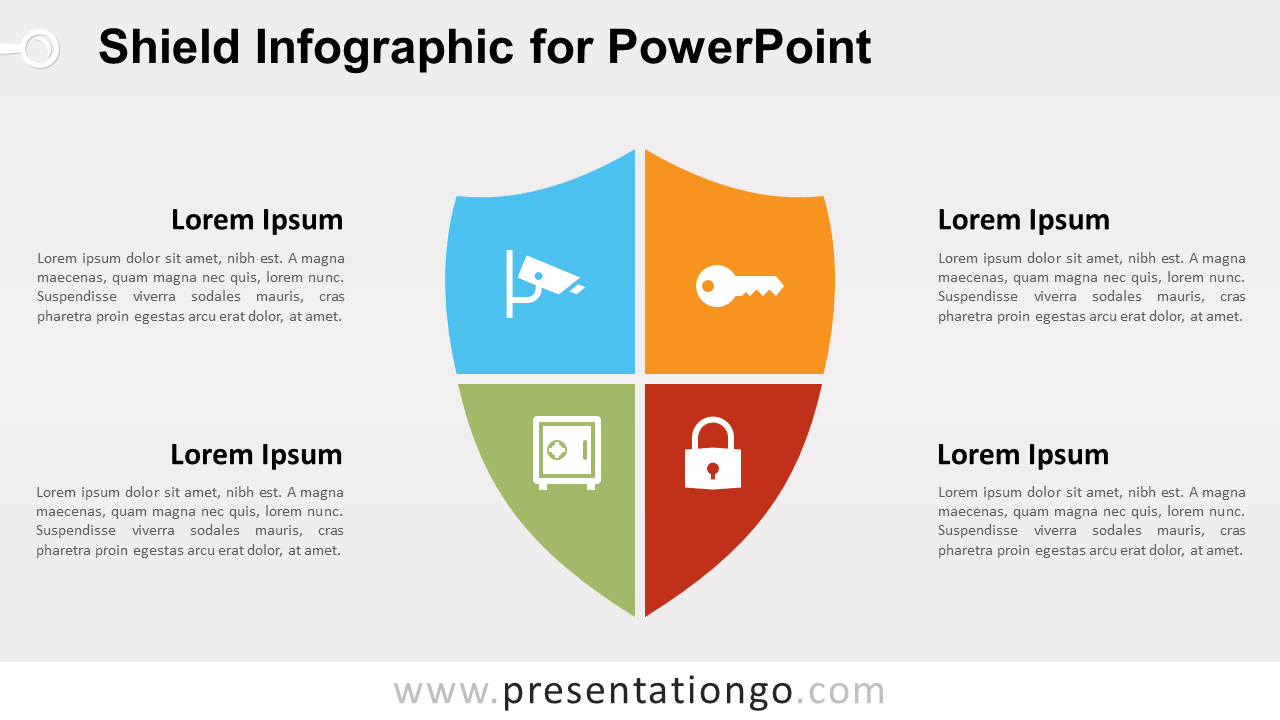
Free shield infographic for PowerPoint. Shield design with 4 colorful quadrants. Metaphor for protection, security, safety. Can also be used as a matrix.
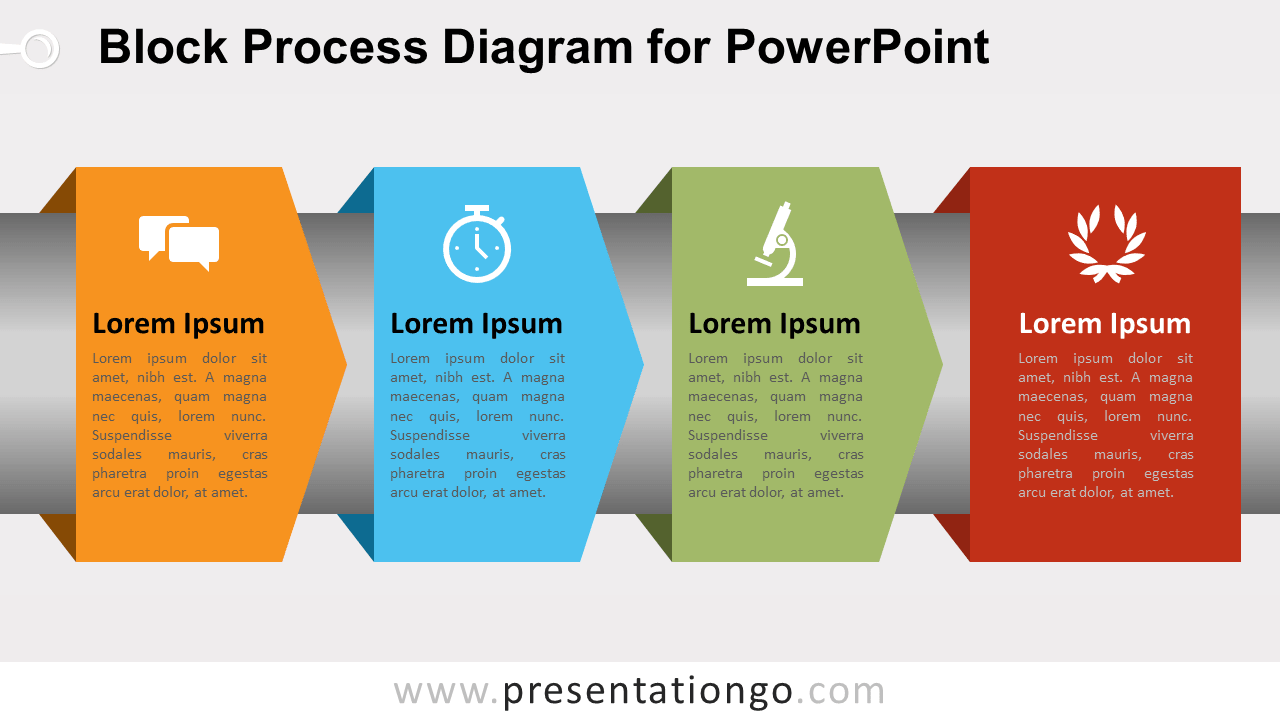
Free block process diagram for PowerPoint. 4 horizontal sequential steps to show a progression through 4 stages, like a timeline. Editable graphics.
Free alternating flow process for PowerPoint. 6 or 7-step horizontal process diagram with colorful square shapes. Editable graphics with text placeholder.
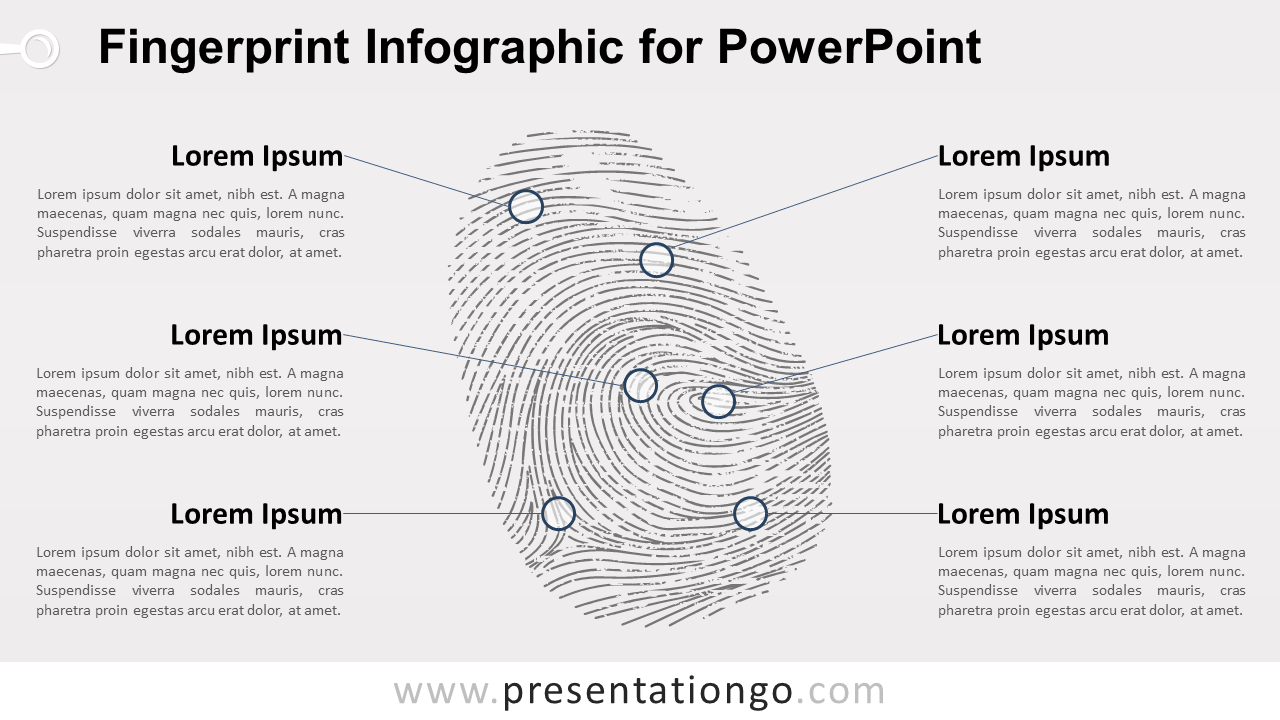
Free fingerprint infographic for PowerPoint. Editable graphics. Use this infographic in your presentation as a metaphor for uniqueness, difference.
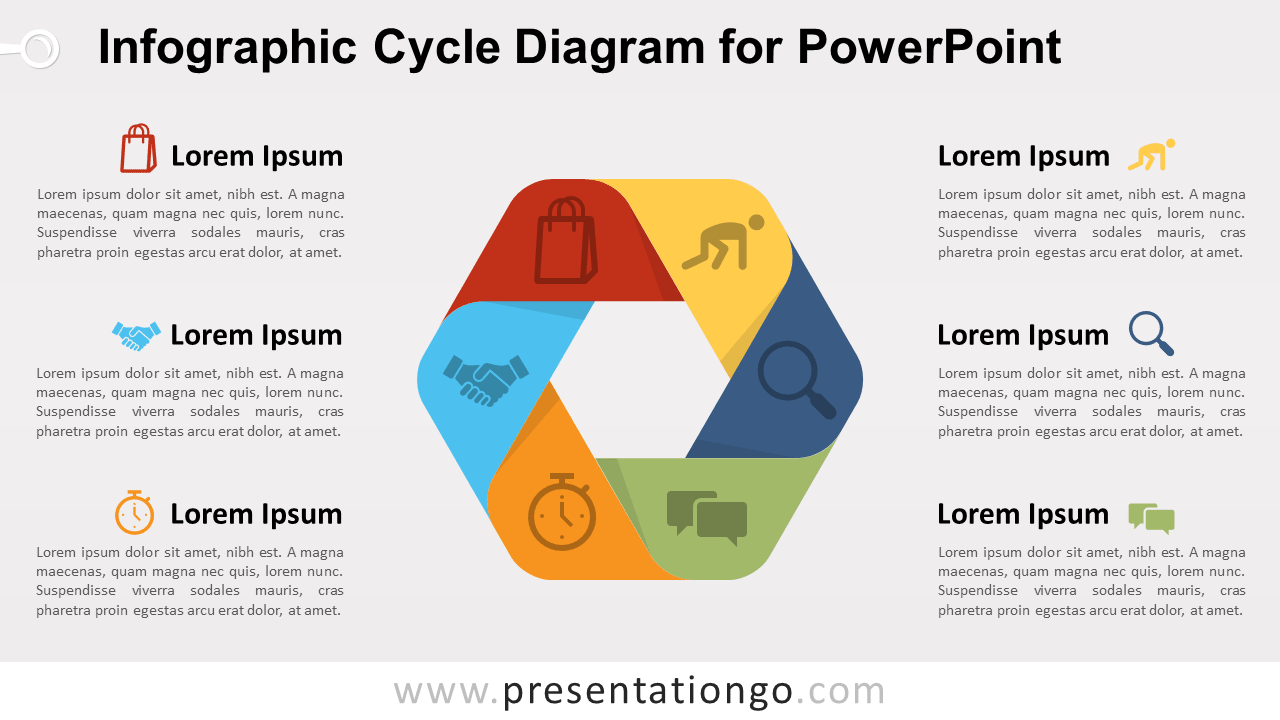
Free infographic cycle diagram for PowerPoint. Colorful cycle design with 6 stages, making a hexagon shape. Editable graphics with text placeholder.
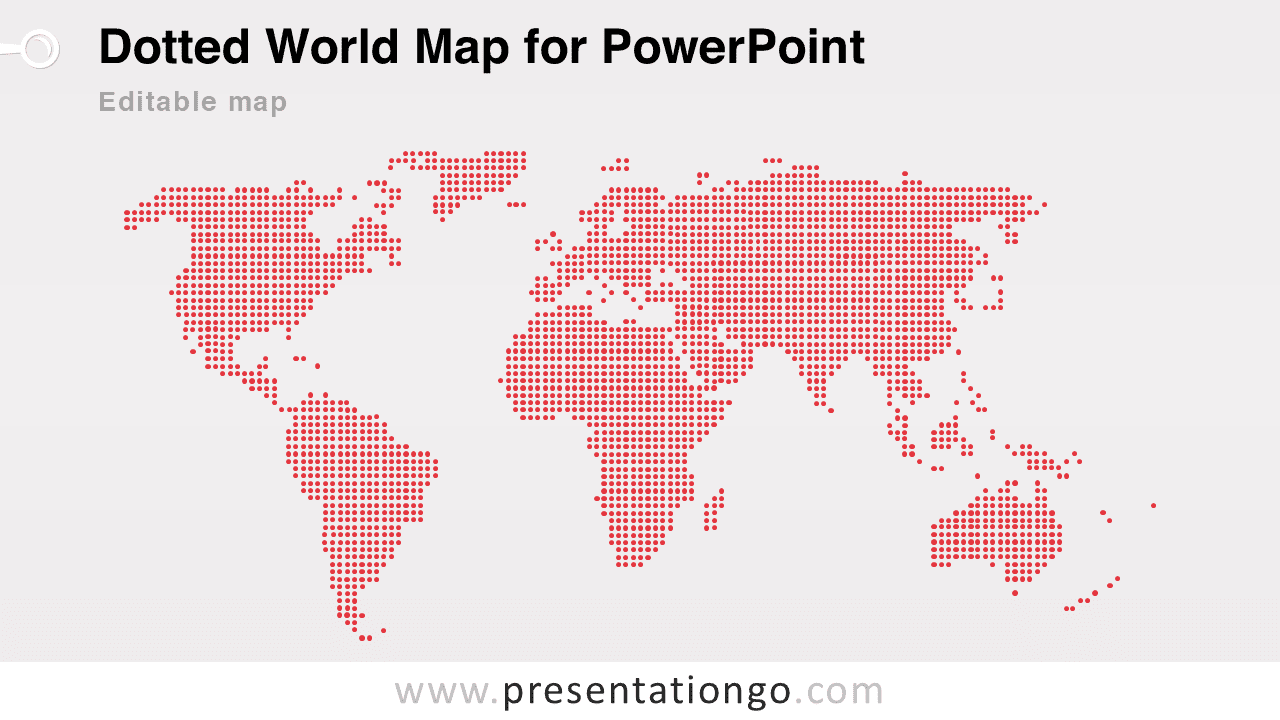
Free dotted worldmap for PowerPoint. Perspective map of the world designed with dots. Different colors for each continent. Editable graphics.
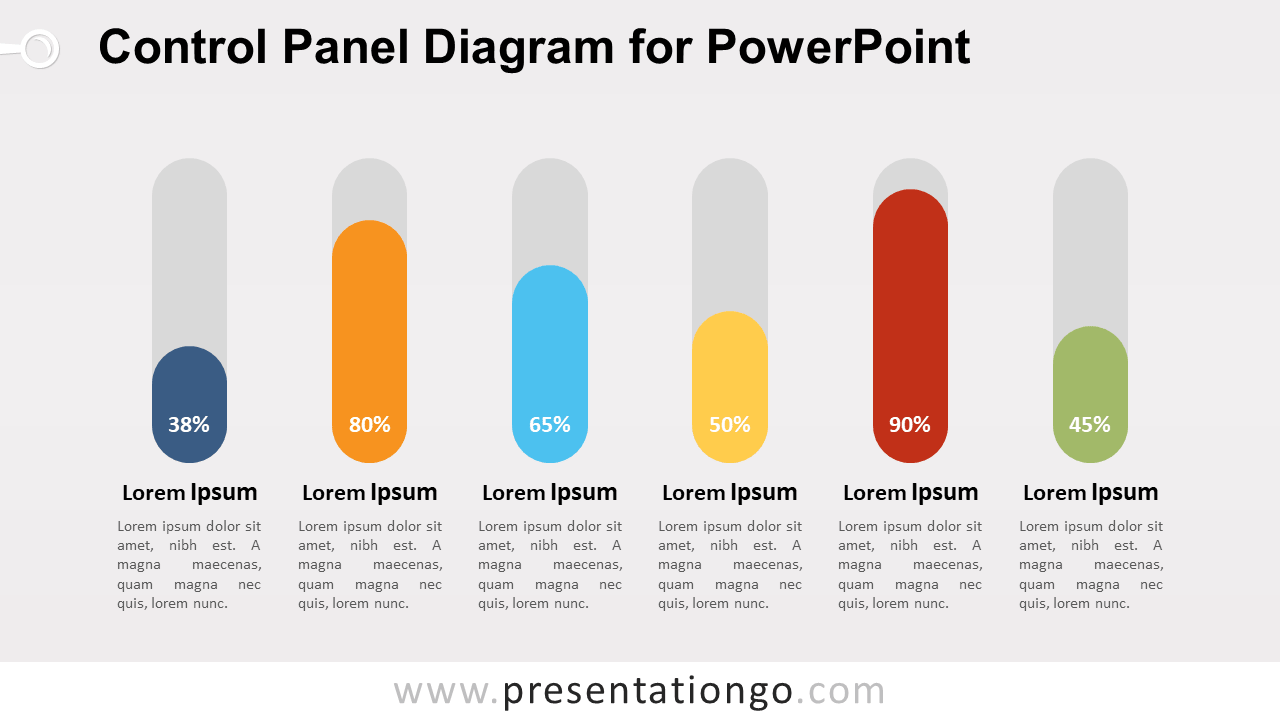
Free control panel infographic for PowerPoint with 6 vertical level indicators. Editable graphics, text placeholder. Great to compare quantitative results.