Loading resources…
Total 3480 resources
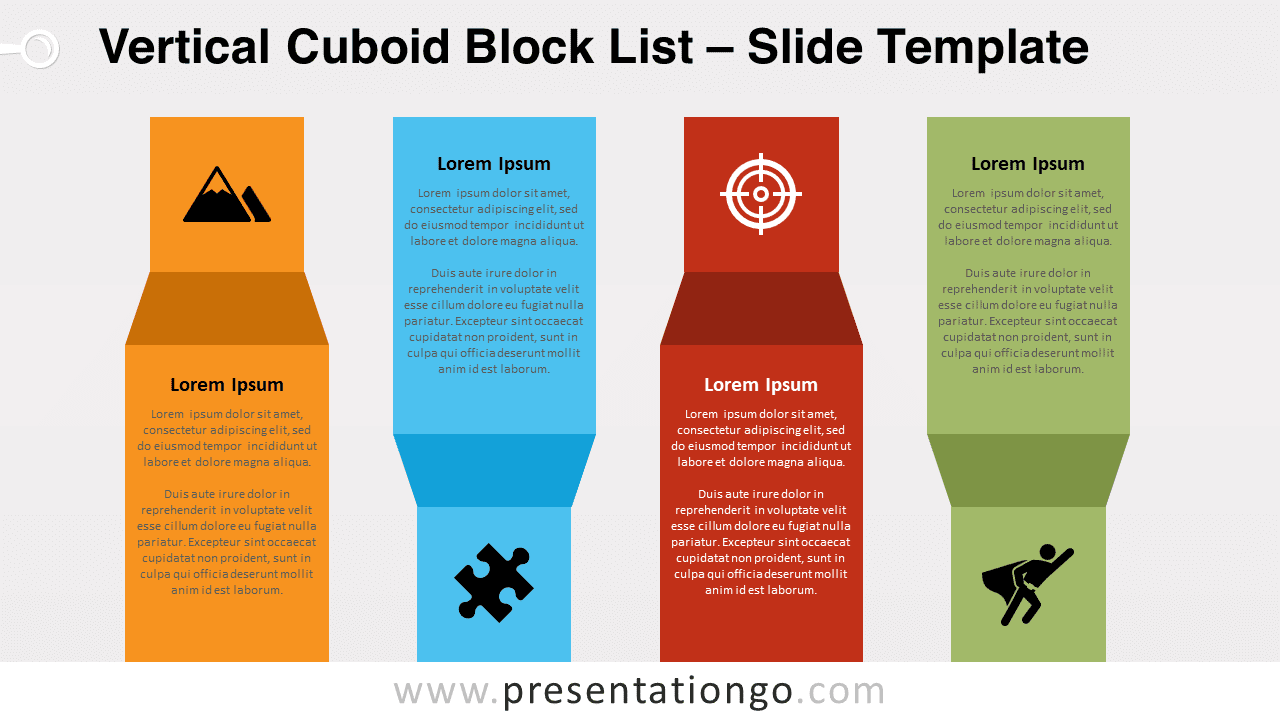
Showcase your content with our Vertical Cuboid Block List for PowerPoint and Google Slides, featuring customizable vertical elements with a 3D effect.
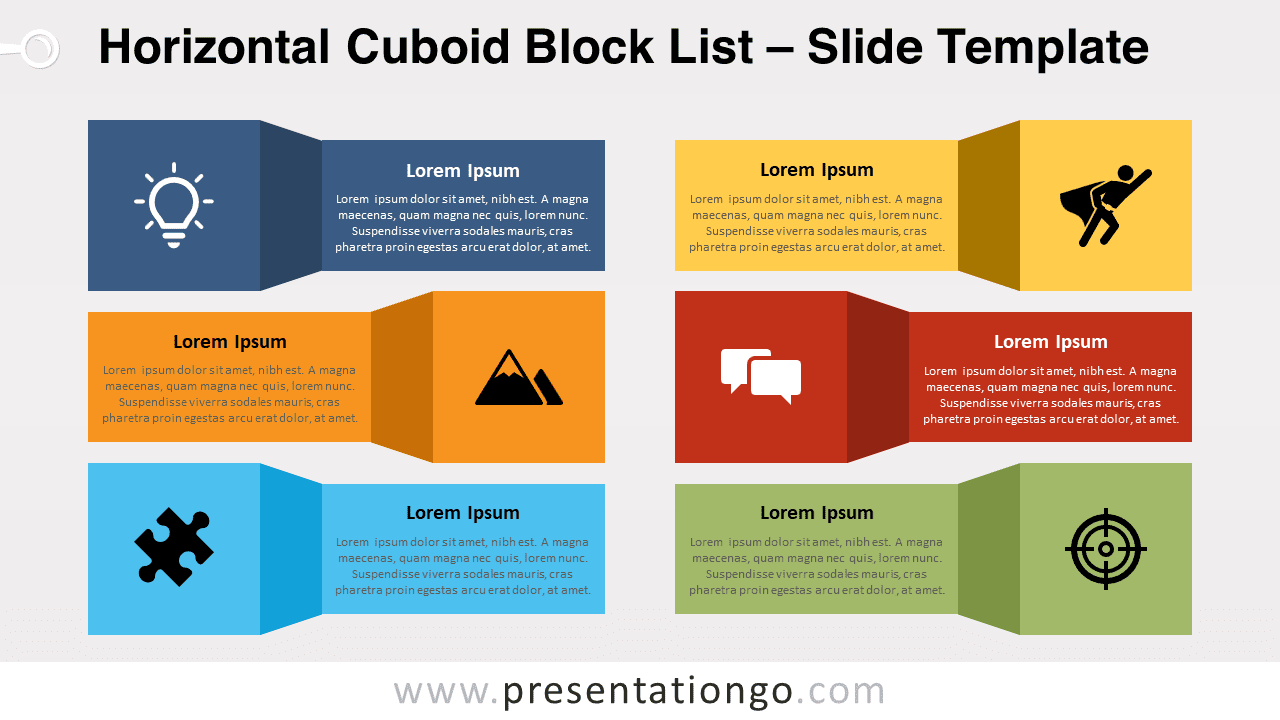
Enhance your PowerPoint and Google Slides presentations with our editable Horizontal Cuboid Block List. Great for organizing information in a visually manner.
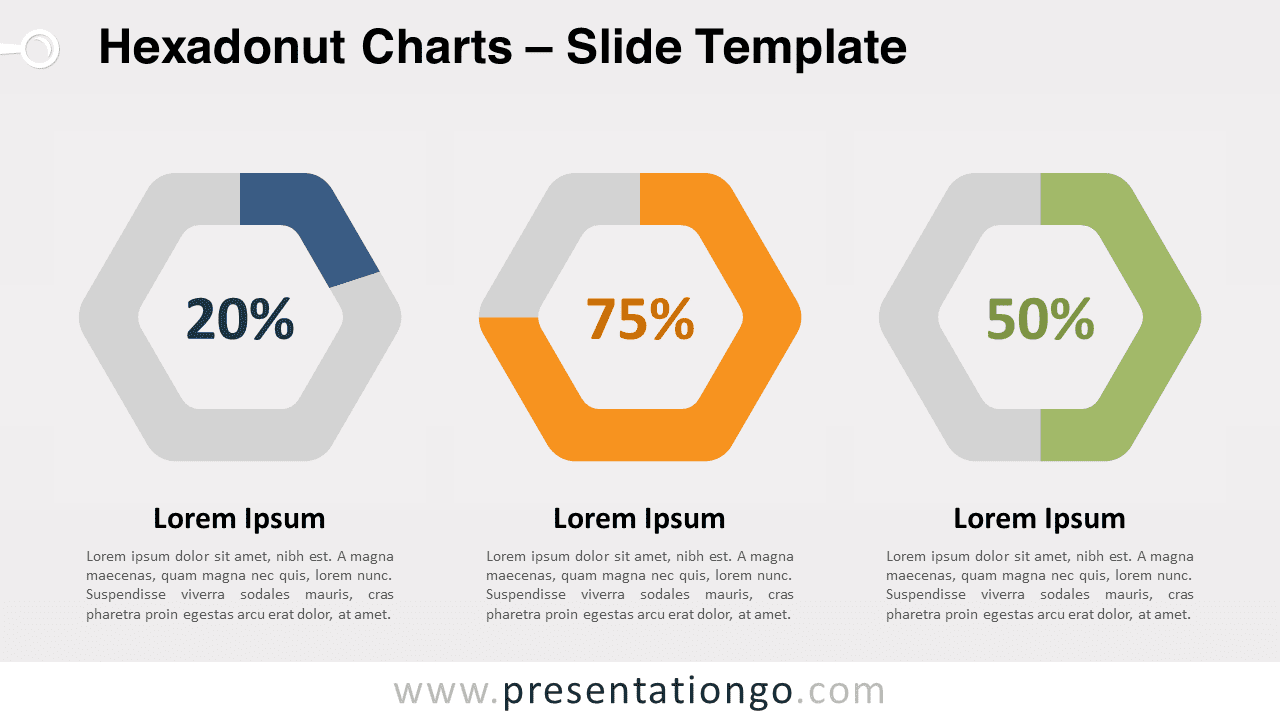
Transform your presentations with data-driven Hexadonut Charts for PowerPoint and Google Slides. Ideal for comparing simple data across various topics.
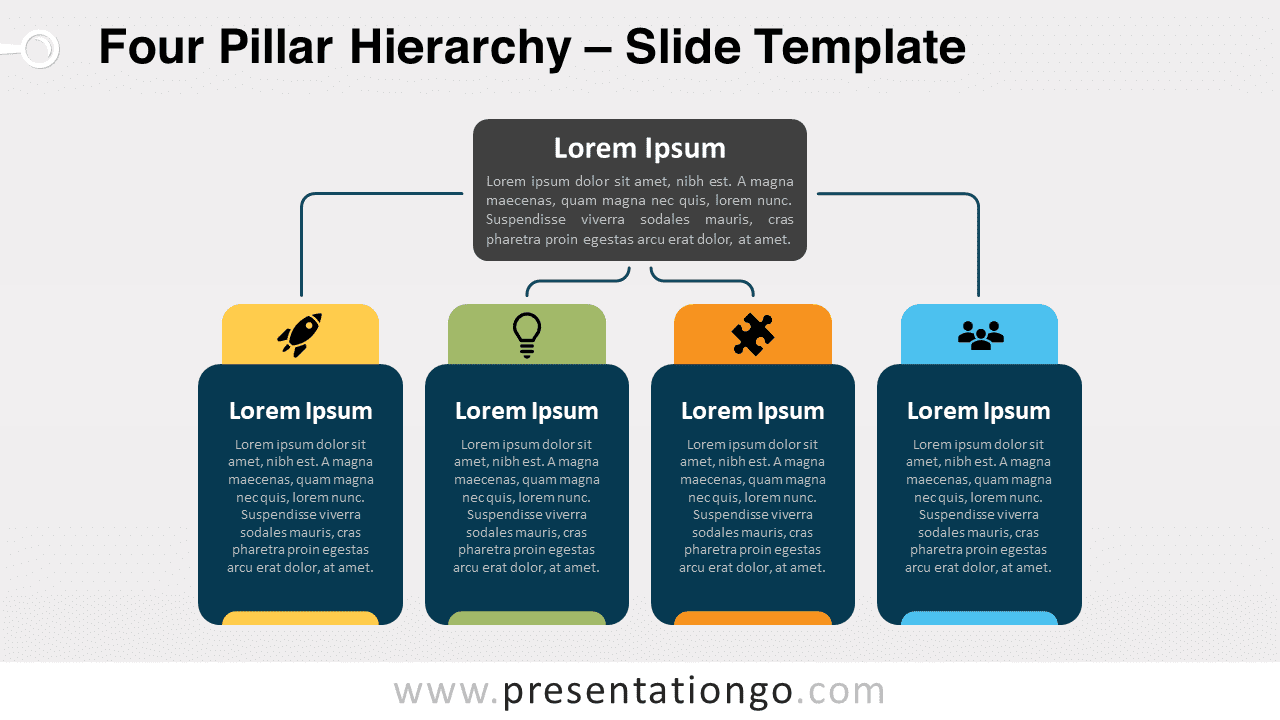
Download the Four Pillar Hierarchy for PowerPoint and Google Slides, a customizable diagram that will help you present hierarchical relationships.
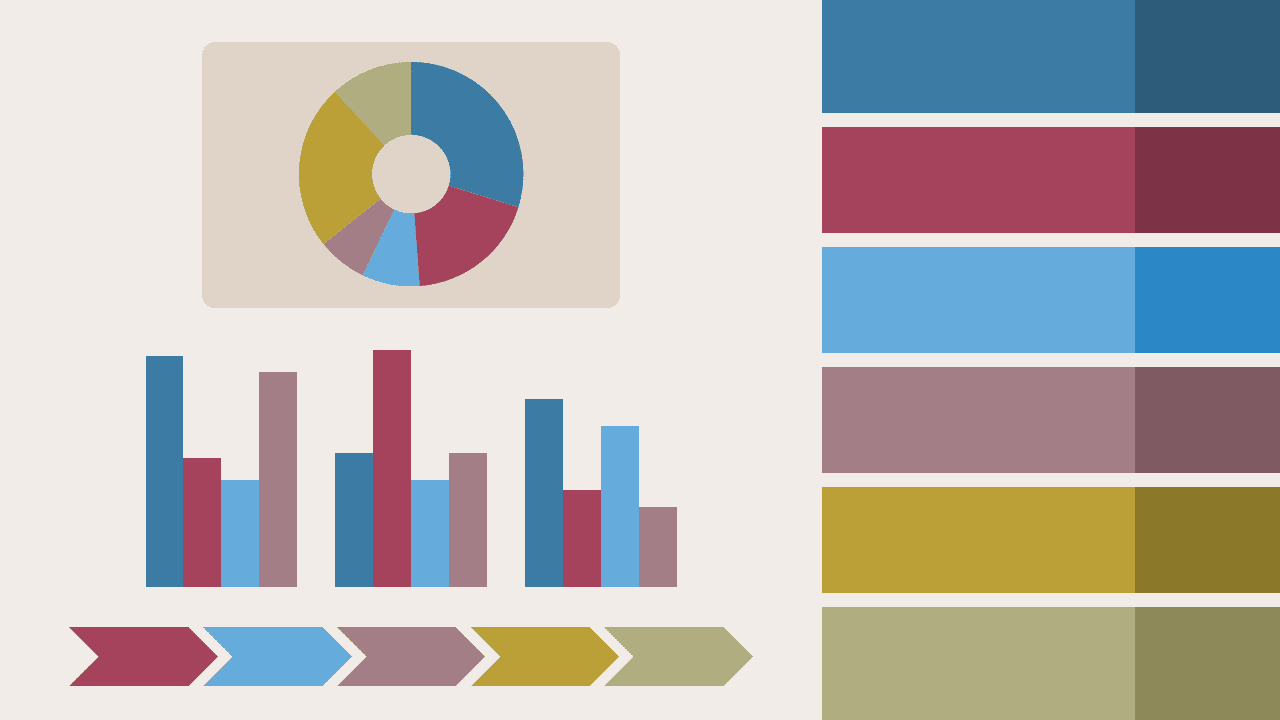
Embrace sophistication with our Vintage Elegance color palette, designed for captivating PowerPoint presentations. Download now for a touch of timeless charm!
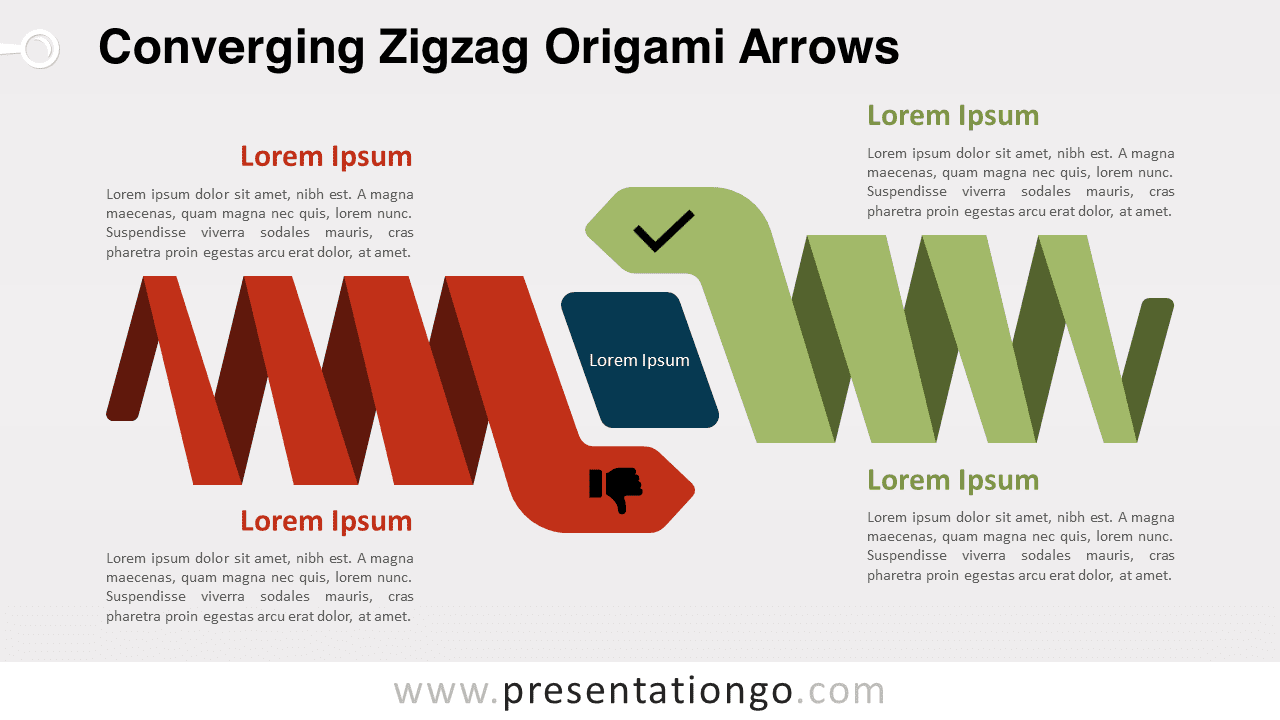
Free, editable Converging Zigzag Origami Arrows diagram for PowerPoint and Google Slides - perfect for showcasing opposite ideas or concepts.
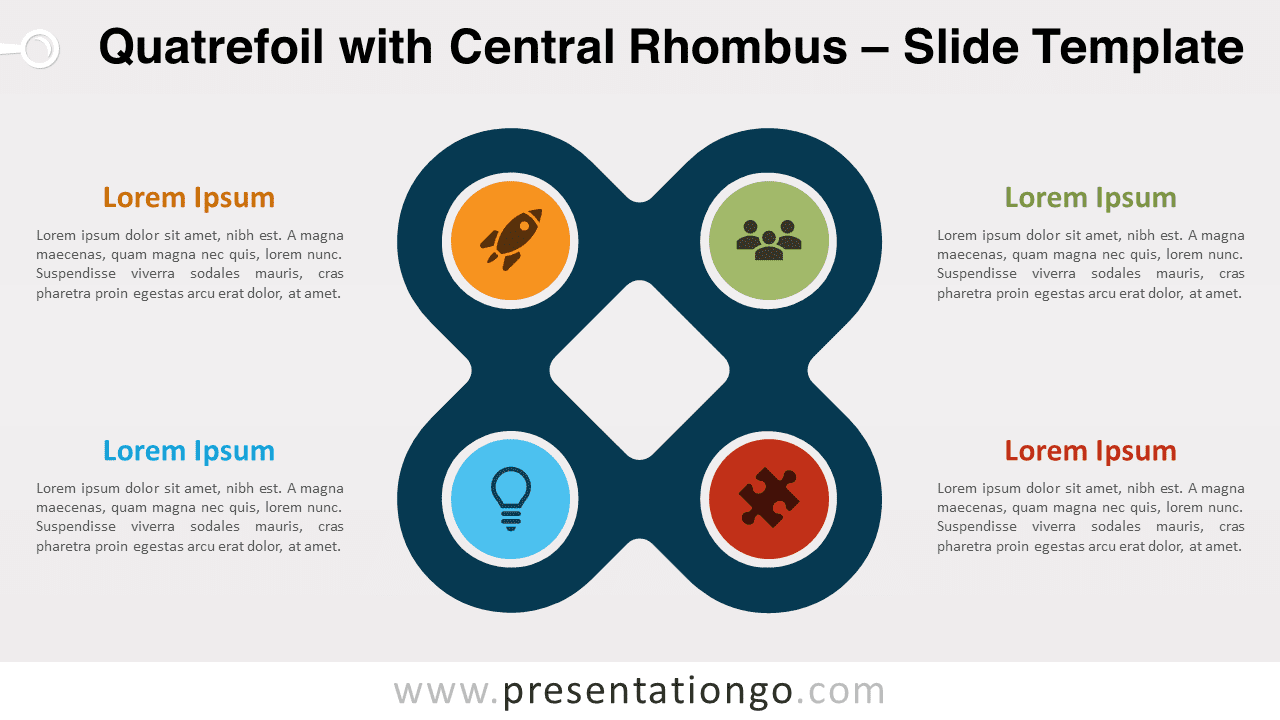
Download our free editable diagram of Quatrefoil with Central Rhombus for PowerPoint and Google Slides. Perfect to showcase 4 concepts.
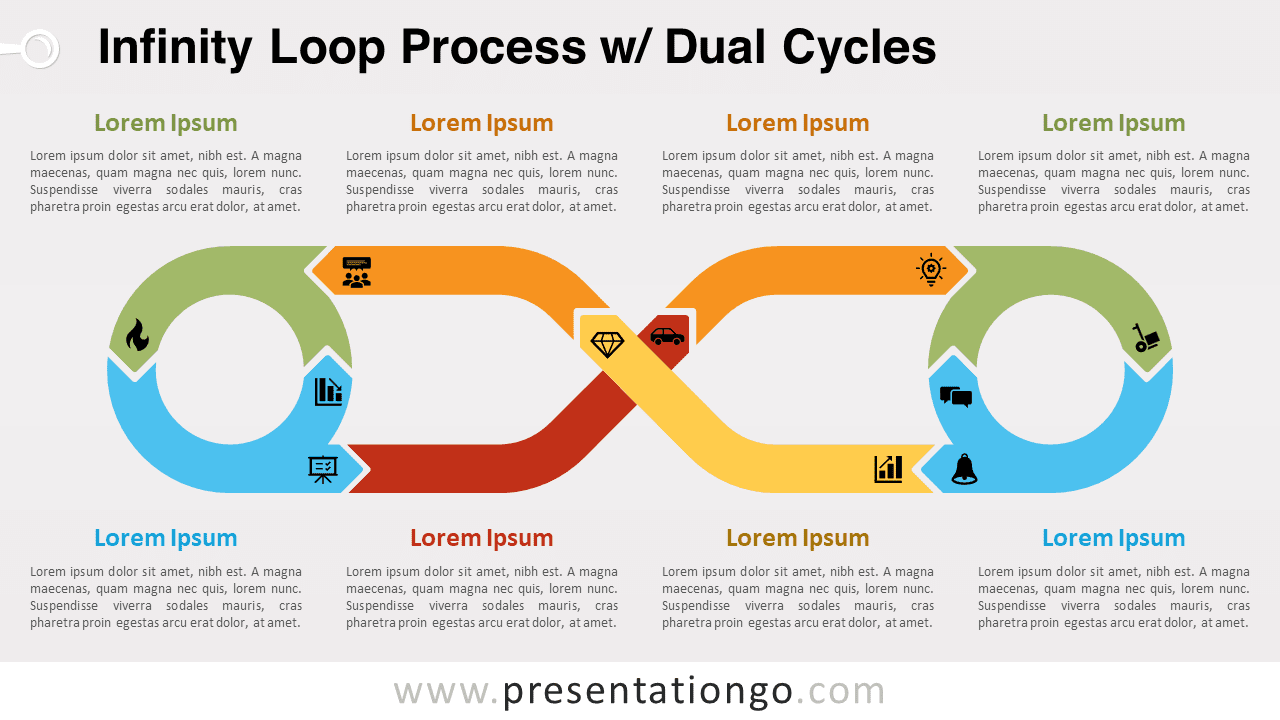
The "Infinity Loop Process with Dual Cycles" is a free diagram for PowerPoint and Google Slides. Perfect for complex processes or cycles.
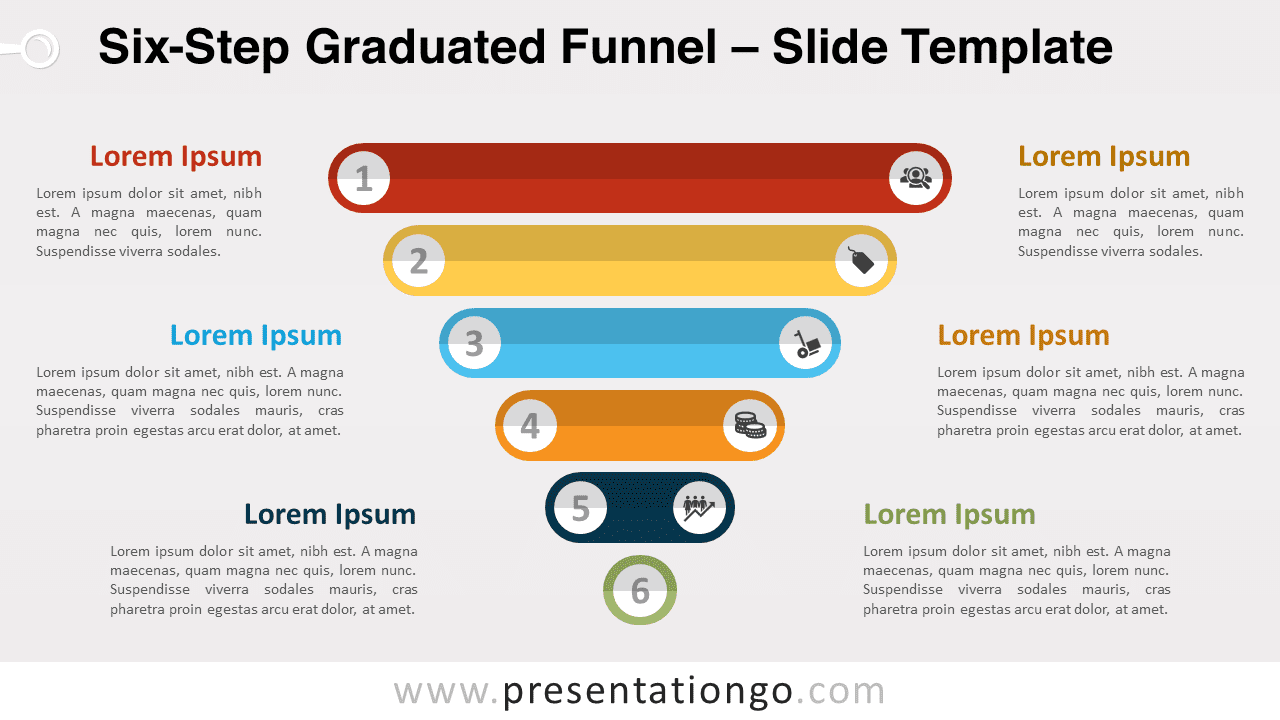
Upgrade presentations using the Six-Step Graduated Funnel, a flexible diagram for PowerPoint and Google Slides. Captivate and communicate effectively!
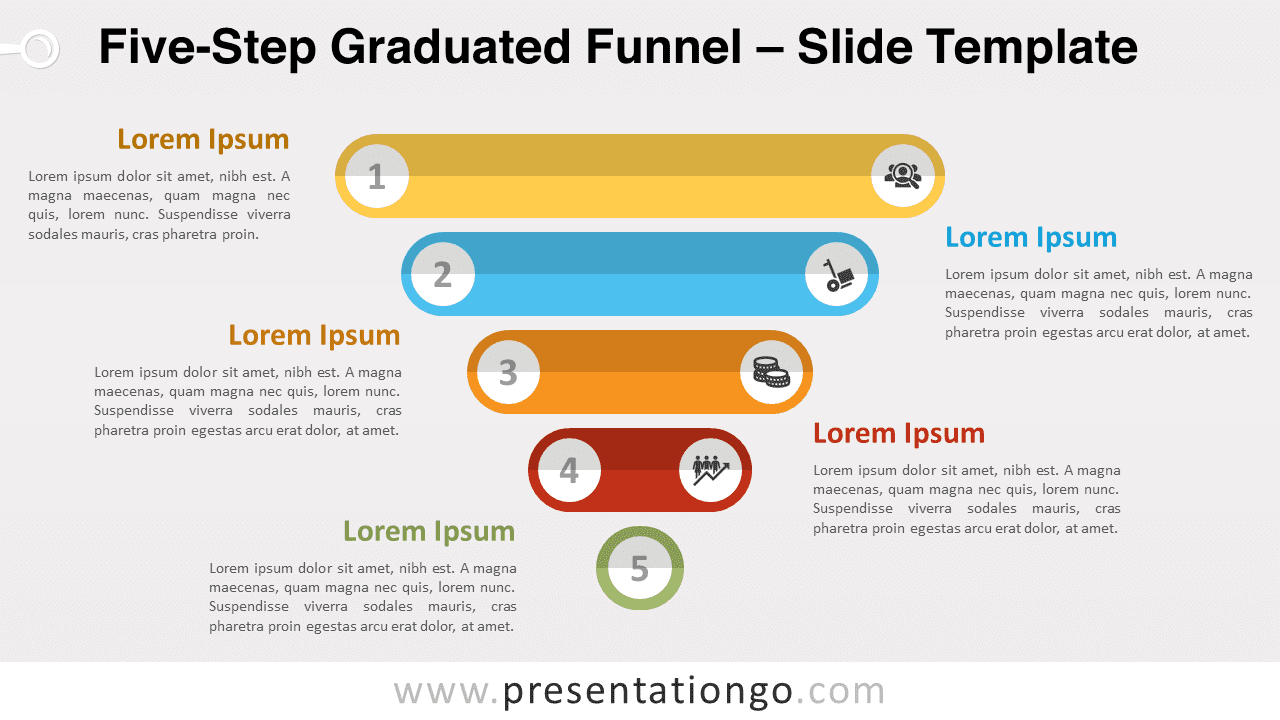
Elevate presentations with the Five-Step Graduated Funnel, a captivating diagram for PowerPoint and Google Slides. Engage your audience today!
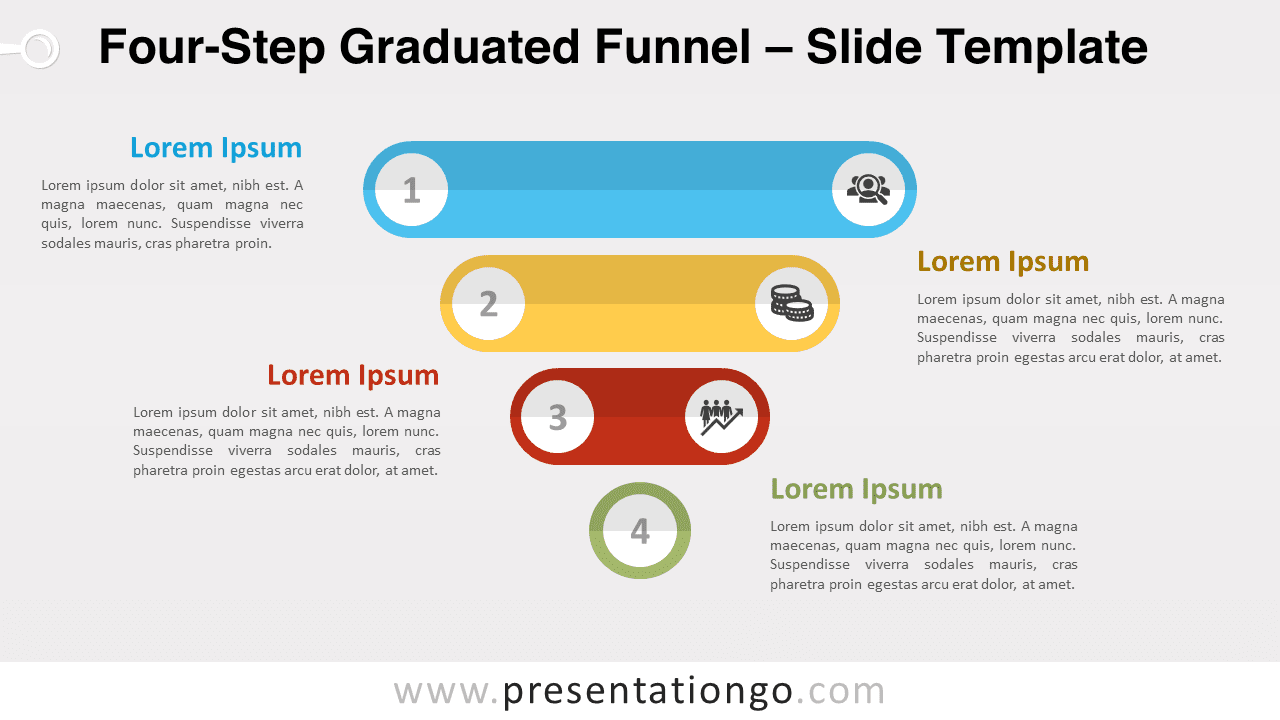
Discover the Four-Step Graduated Funnel, a captivating and versatile funnel diagram for your PowerPoint and Google Slides presentations.
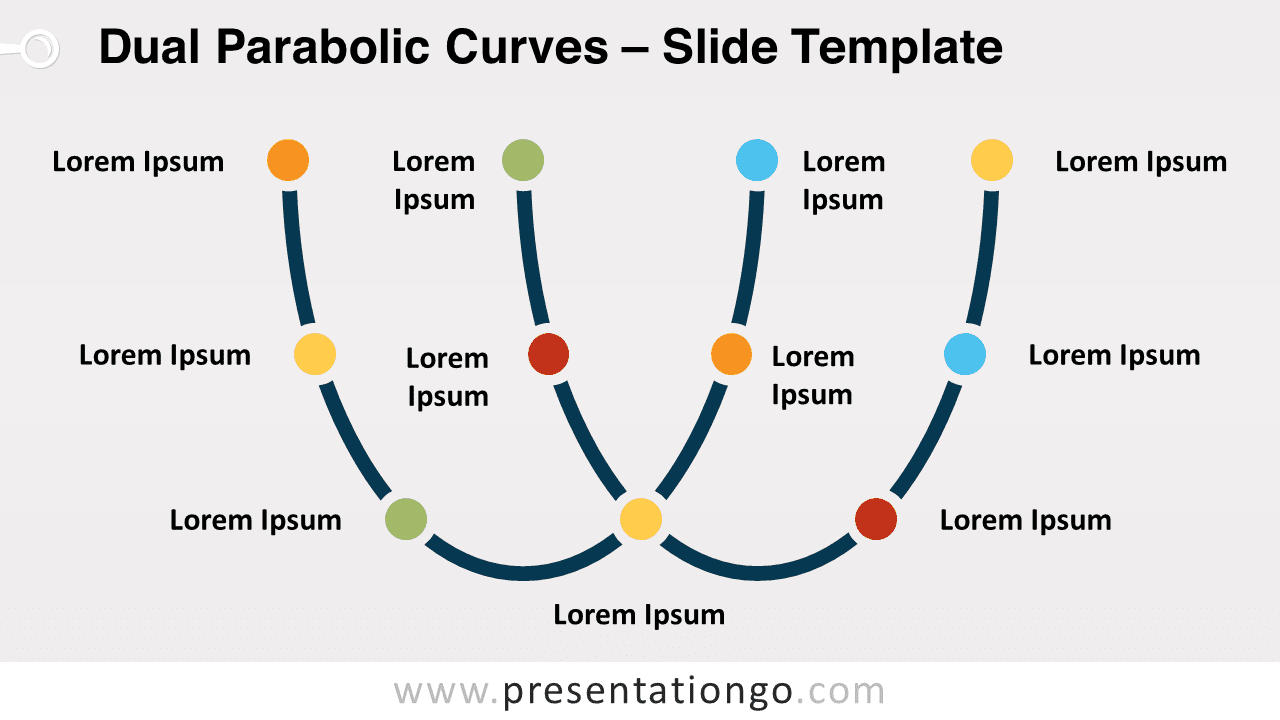
Boost PowerPoint and Google Slides presentation with our Dual Parabolic Curves diagram. Captivate and clarify using this versatile design.
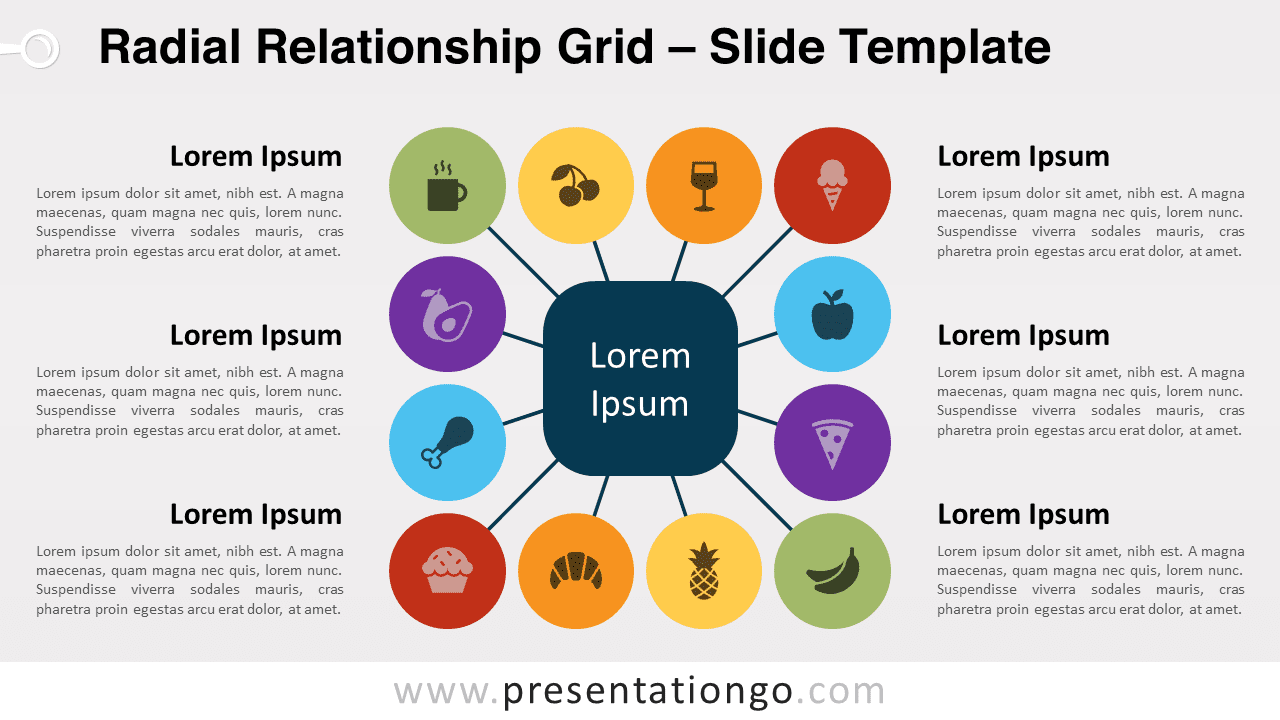
Upgrade your presentations with the Radial Relationship Grid, a versatile and customizable diagram for PowerPoint and Google Slides.
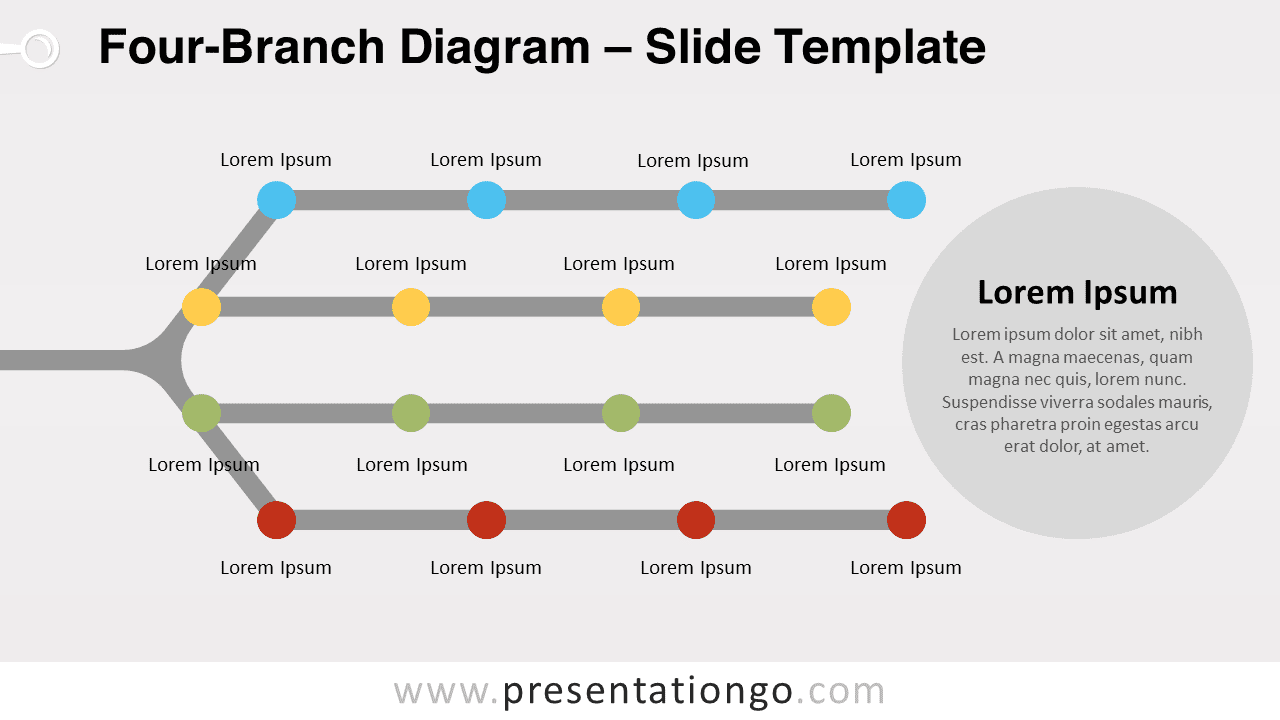
Download our free Four-Branch Diagram for PowerPoint and Google Slides. Present complex processes and options in an organized manner.
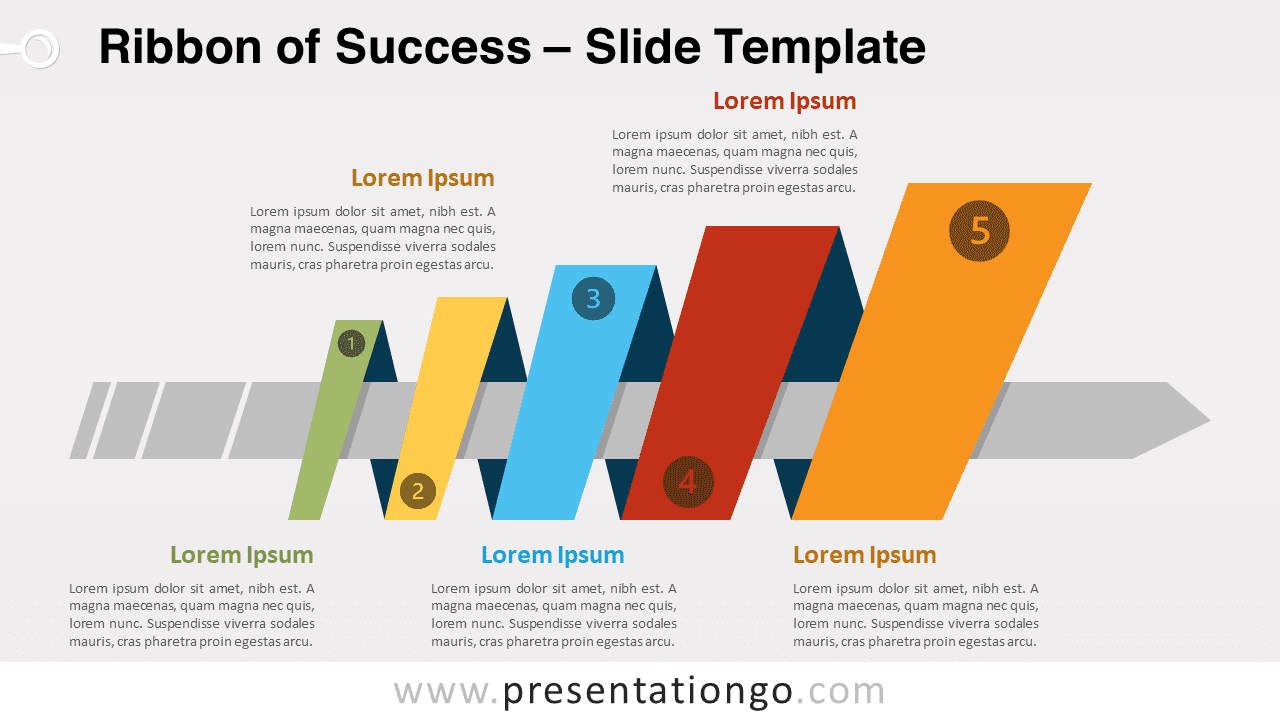
Download the free Ribbon of Success diagram for PowerPoint and Google Slides, a striking visual metaphor to illustrate progress and success.
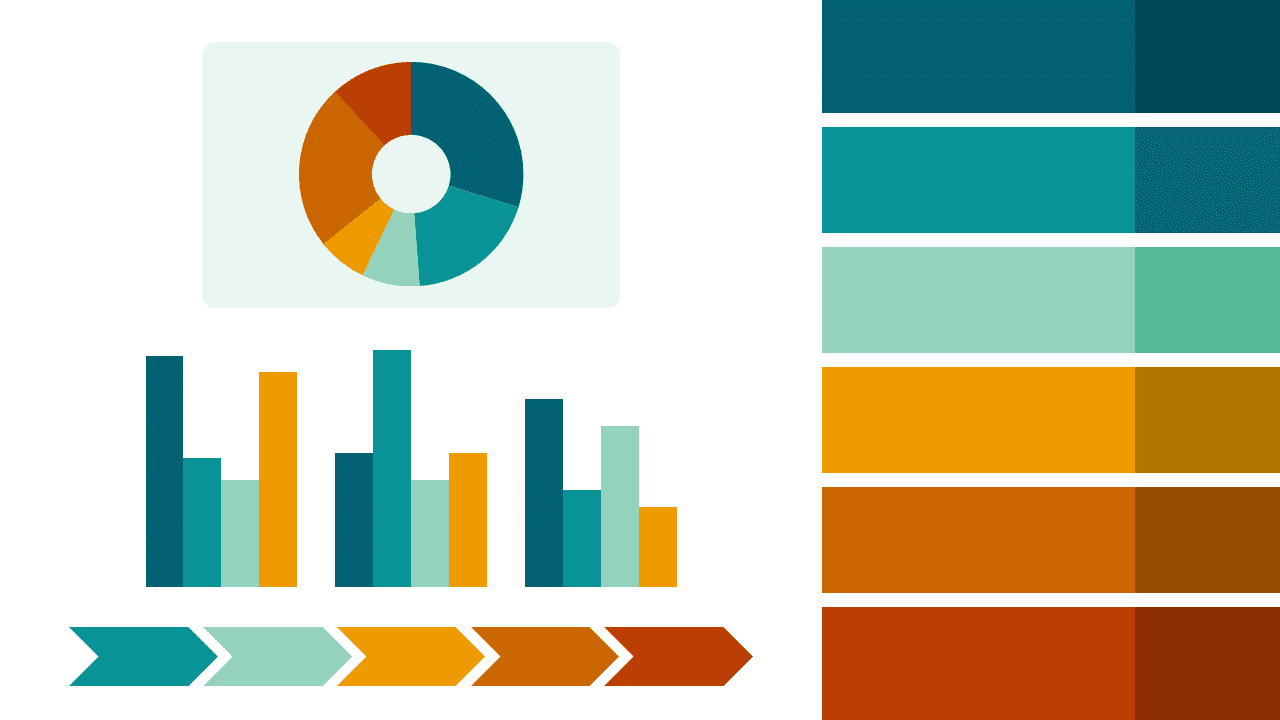
Download this Coastal Breeze color palette for your PowerPoint presentations, perfect for exuding energy, and a breath of fresh sea air.
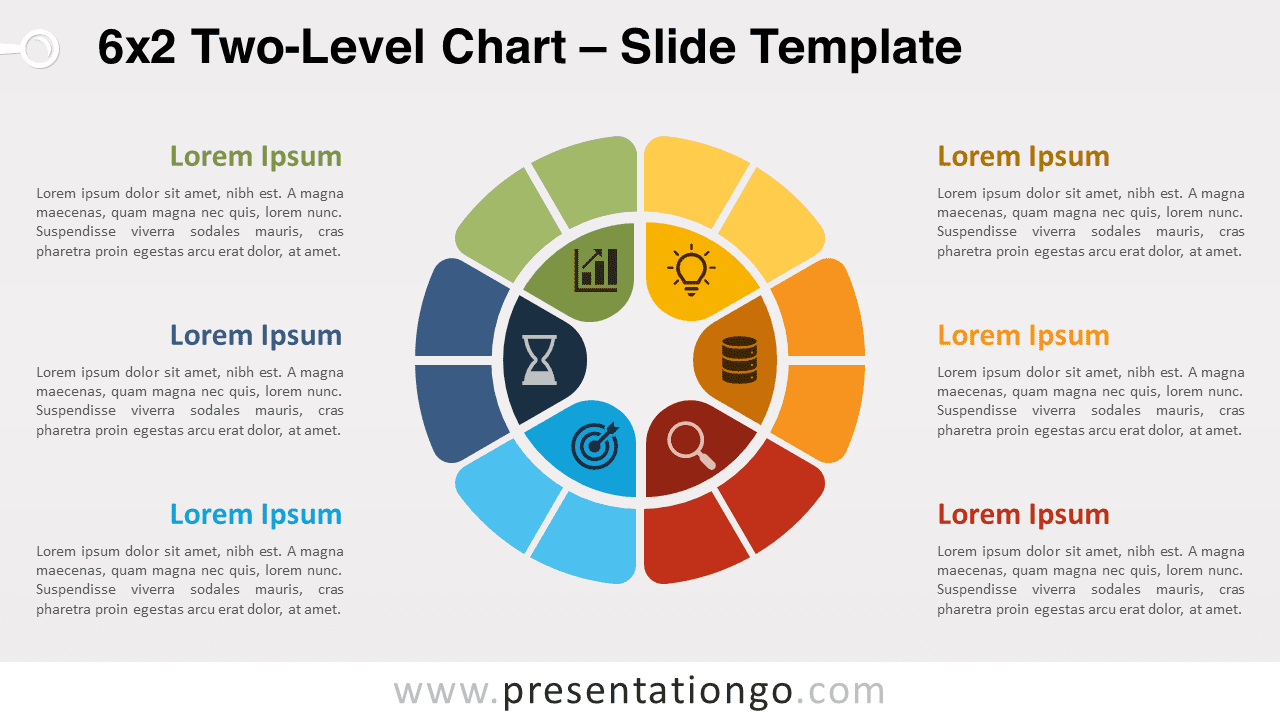
Showcase intricate, interconnected ideas in your presentations using the 6x2 Two-Level Chart for PowerPoint and Google Slides.
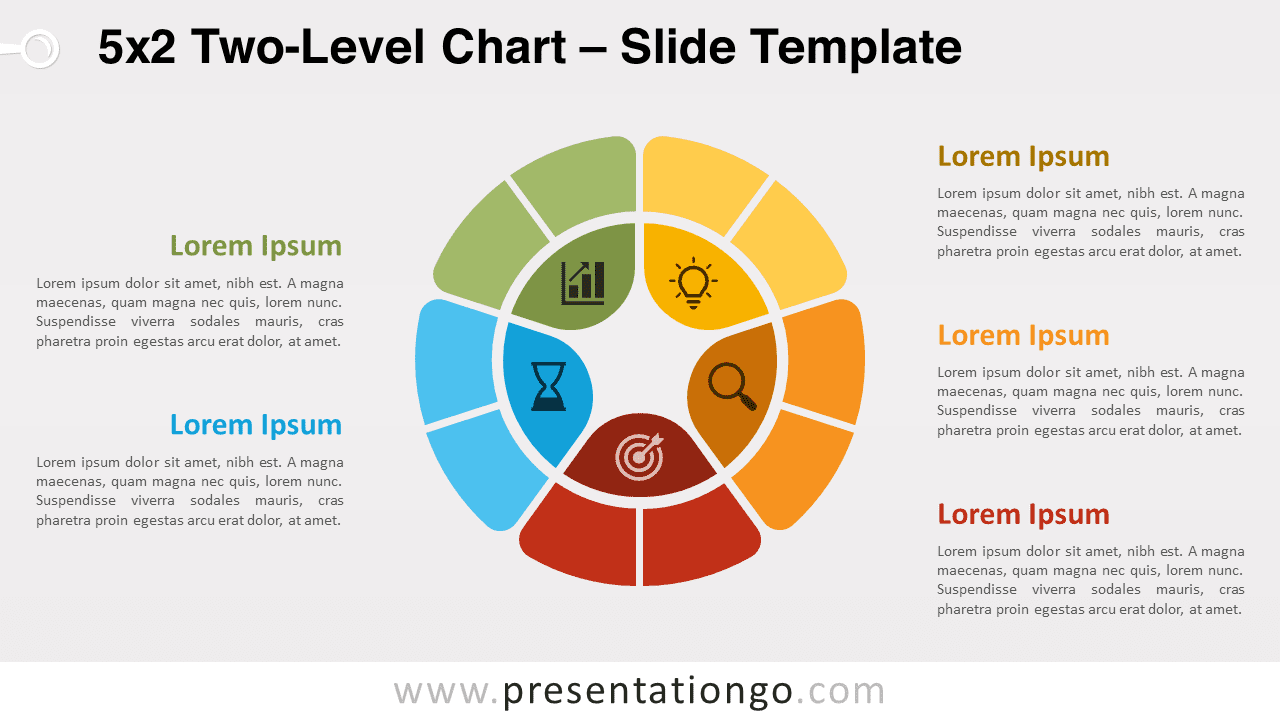
The versatile 5x2 Two-Level Chart template for PowerPoint and Google Slides will elevate your presentations with its modern and intuitive design.
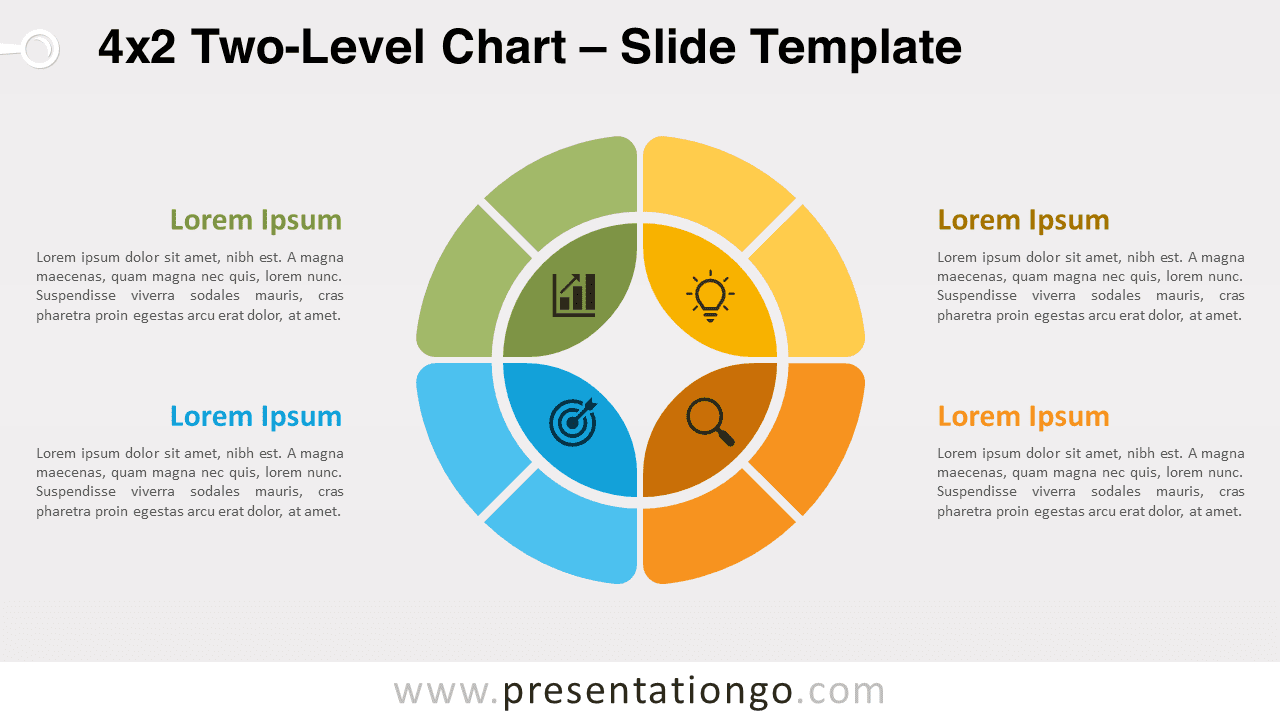
This free 4x2 Two-Level Chart for PowerPoint and Google Slides will showcase hierarchies and complex relationships. Editable graphics.
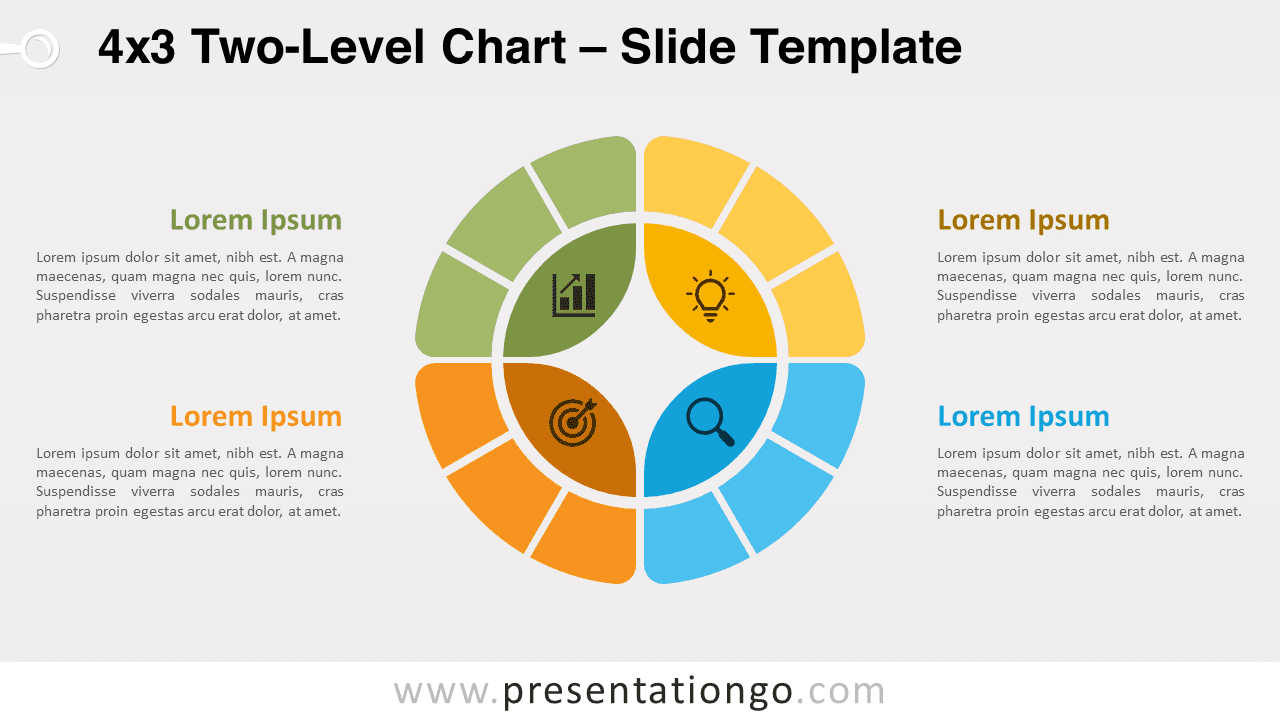
This free 4x3 Two-Level Chart for PowerPoint and Google Slides will help you complex, interconnected ideas, and hierarchies effectively.
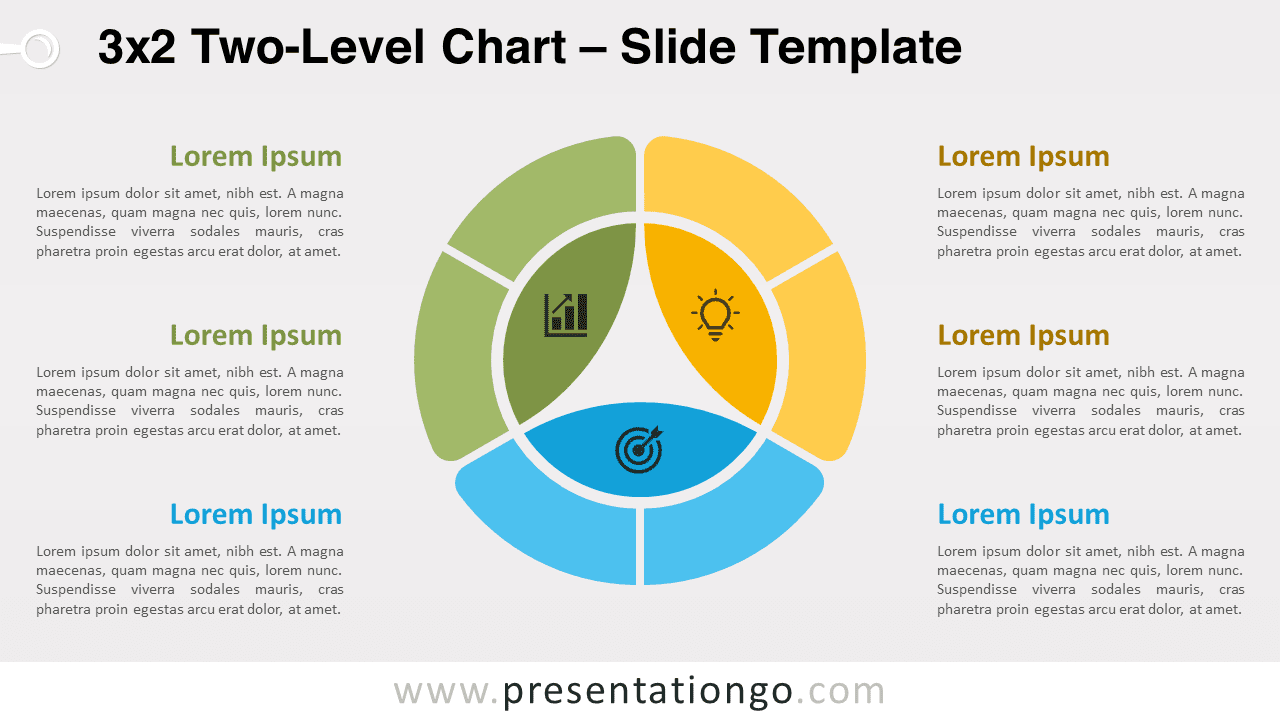
The 3x2 Two-Level Chart for PowerPoint and Google Slides is multi-level doughnut chart to simplify the presentation of interconnected ideas.
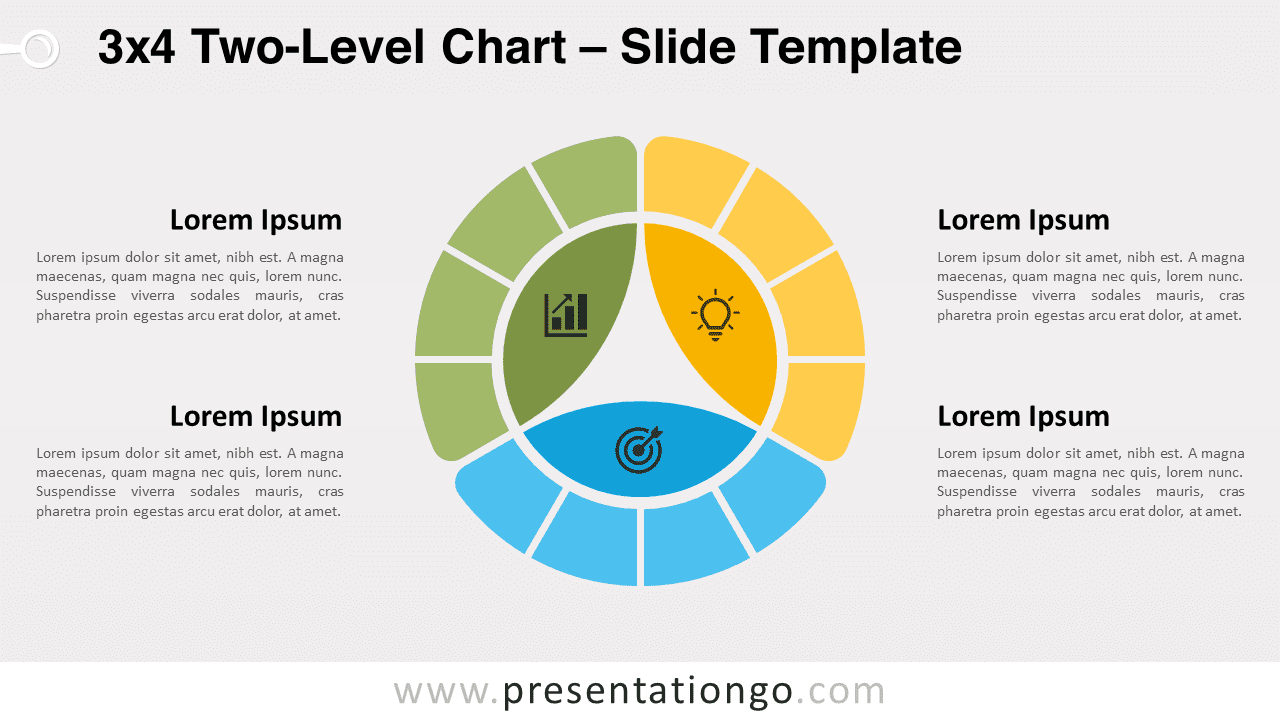
Enhance your presentations by showcasing complex relationships and hierarchies with the 3x4 Two-Level Chart for PowerPoint & Google Slides.
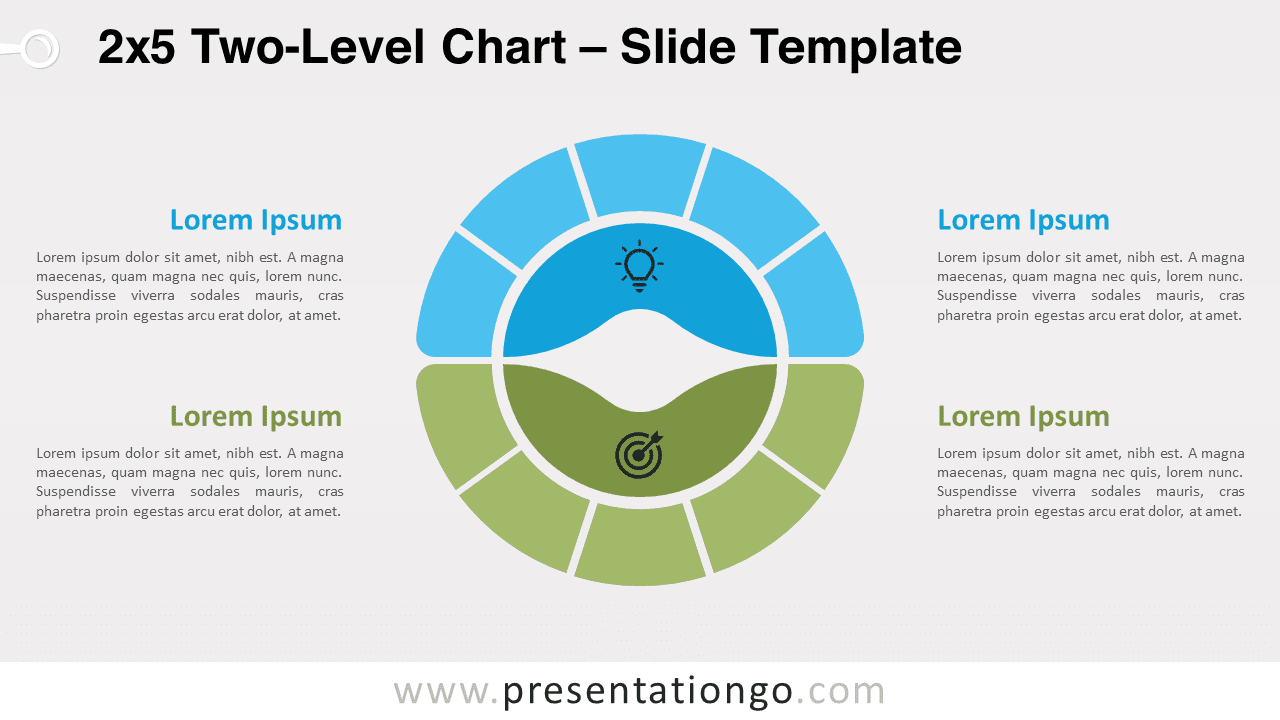
Download the 2x5 Two-Level Chart for PowerPoint and Google Slides, a versatile graphic to convey complex, interconnected ideas with ease.
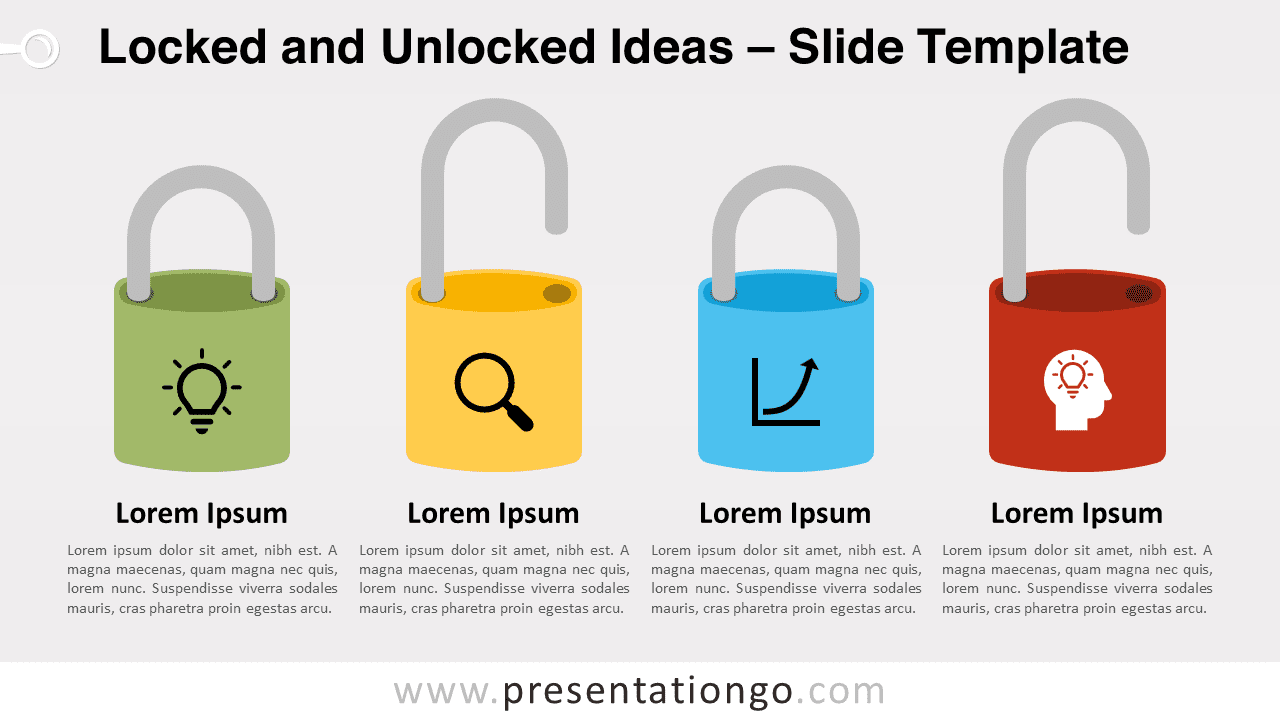
Showcase your ideas with our Locked & Unlocked Ideas template for PowerPoint and Google Slides. Use padlocks to illustrate positive and negative concepts.