Loading resources…
Total 18197 resources
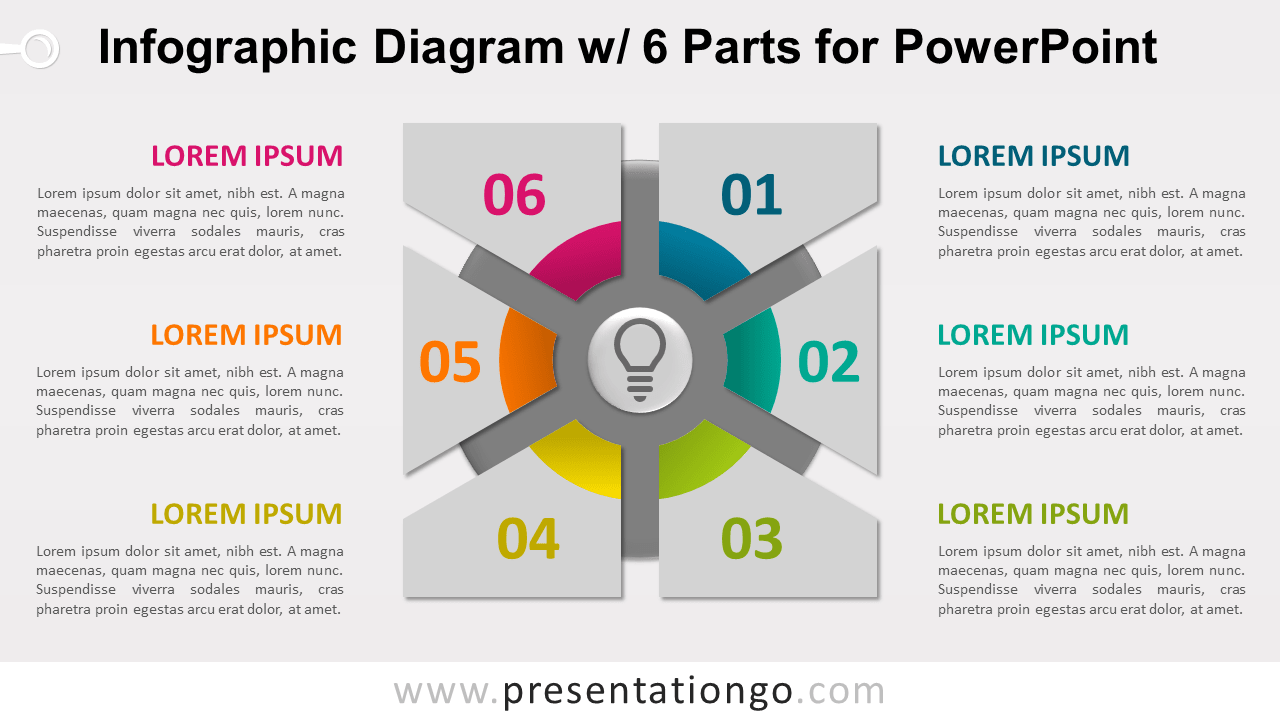
Free infographic diagram with 6 parts for PowerPoint. Rectangle or square shape divided in 6 equal parts and with 6 block arcs, or slices.
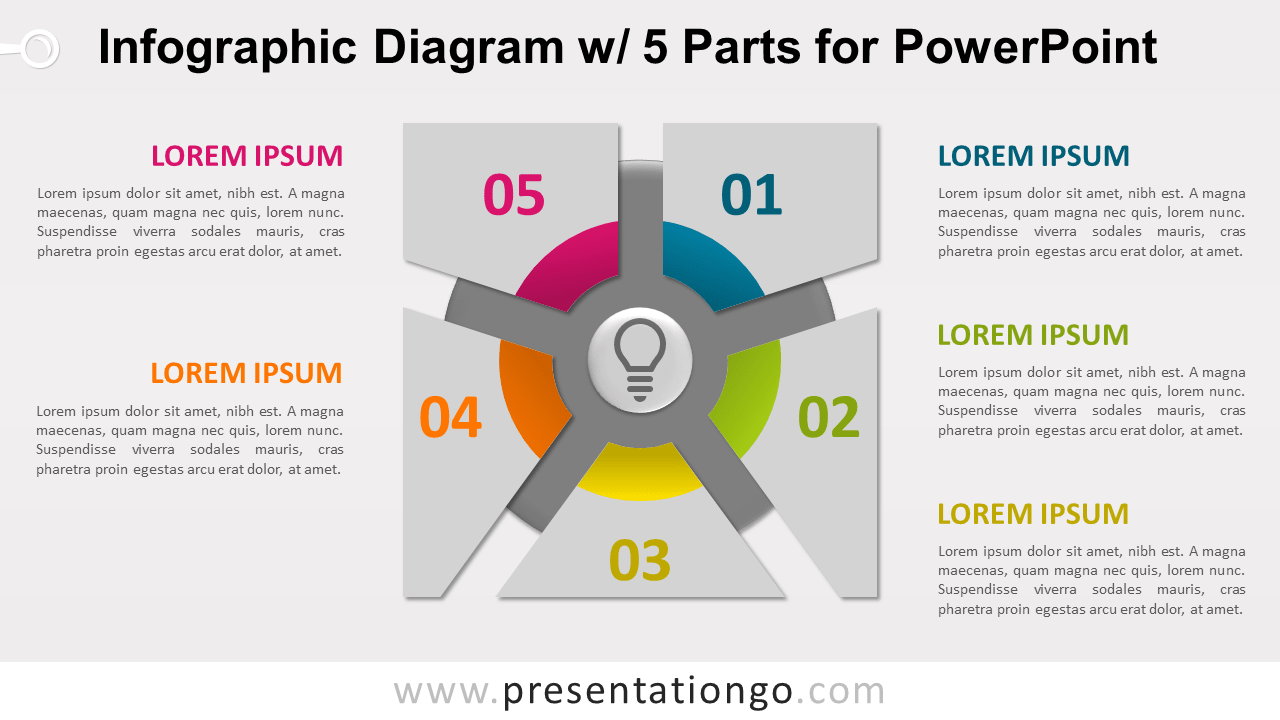
Free infographic diagram with 5 parts for PowerPoint. Rectangle or square shape divided in 5 equal parts and with 5 block arcs, or slices.
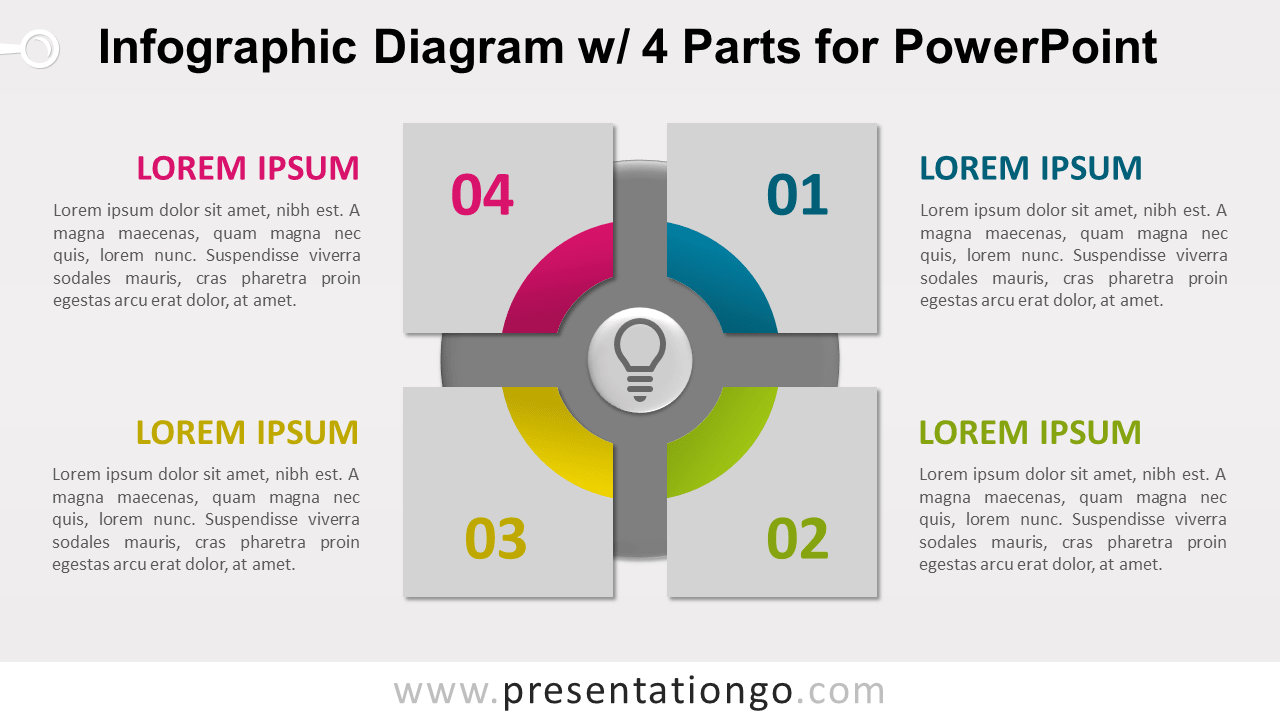
Free infographic diagram with 4 parts for PowerPoint. Colored graphic design with 4 quadrants and with 4 block arcs, or slices.
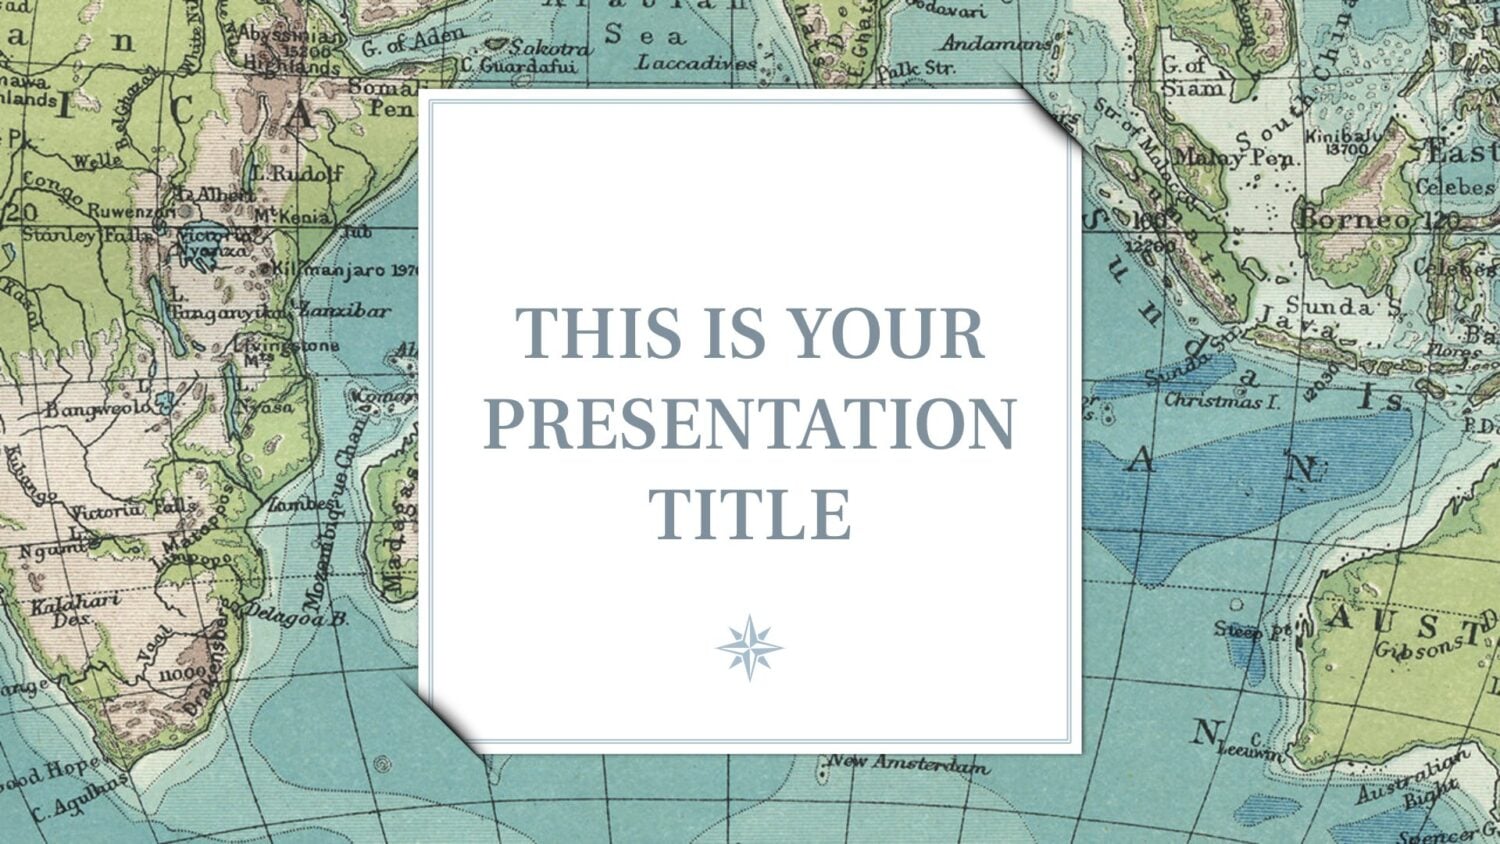
Choose this free template with vintage maps as backgrounds, and your Powerpoint or Google Slides presentation will stand out. With lots of slide layouts.
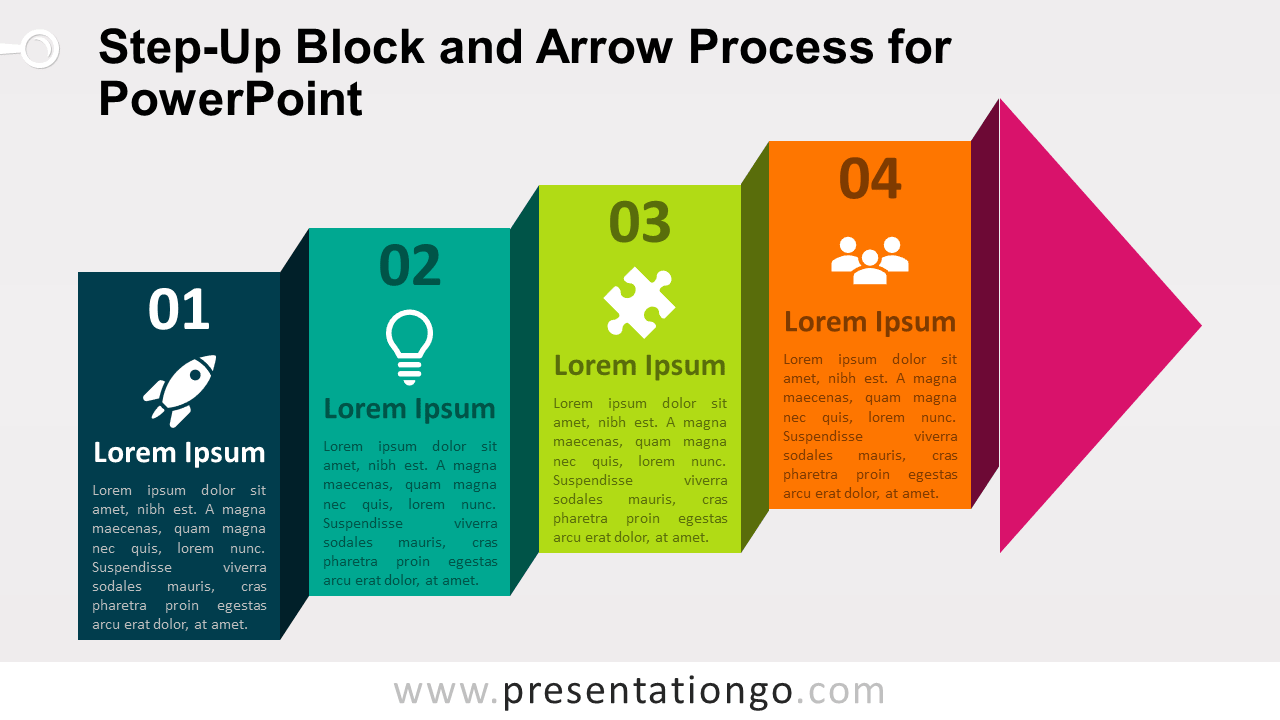
Free step-up block and arrow process diagram for PowerPoint. Origami-effect 4-step ascending process diagram with text blocks and arrow (end).
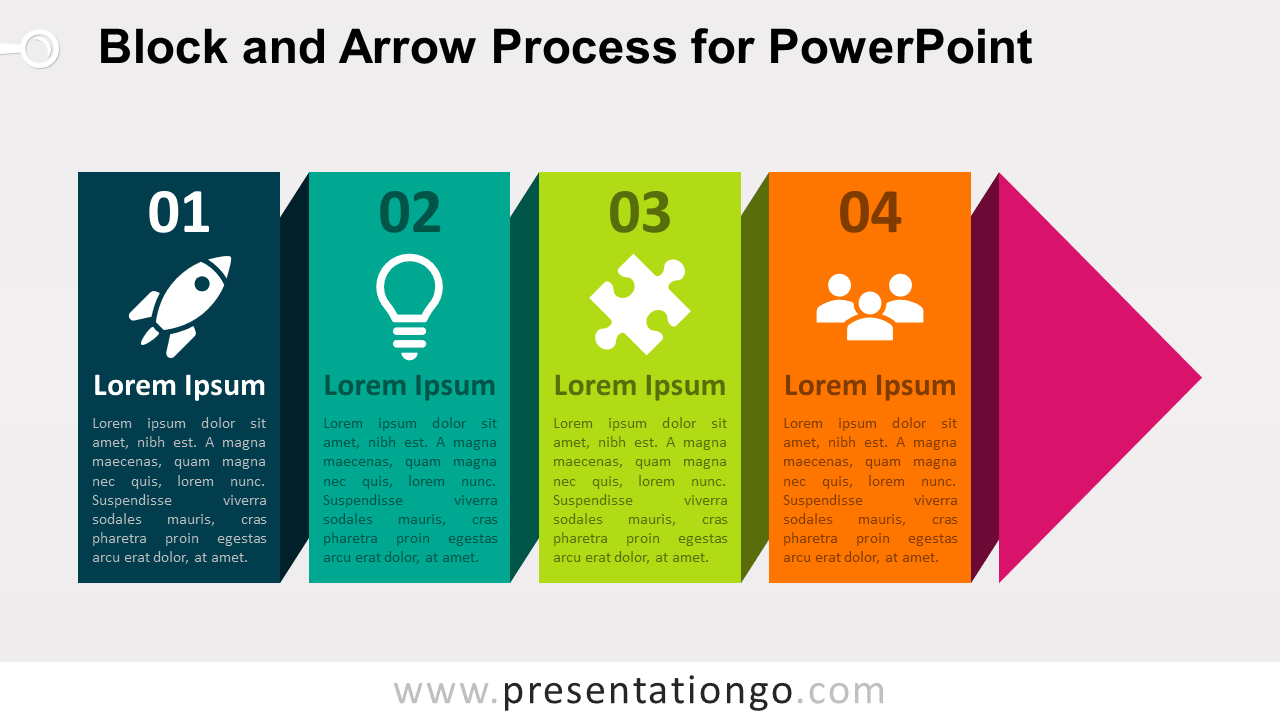
Free block and arrow process diagram for PowerPoint. Right arrow with a 4-step origami effect. Completely editable shapes.
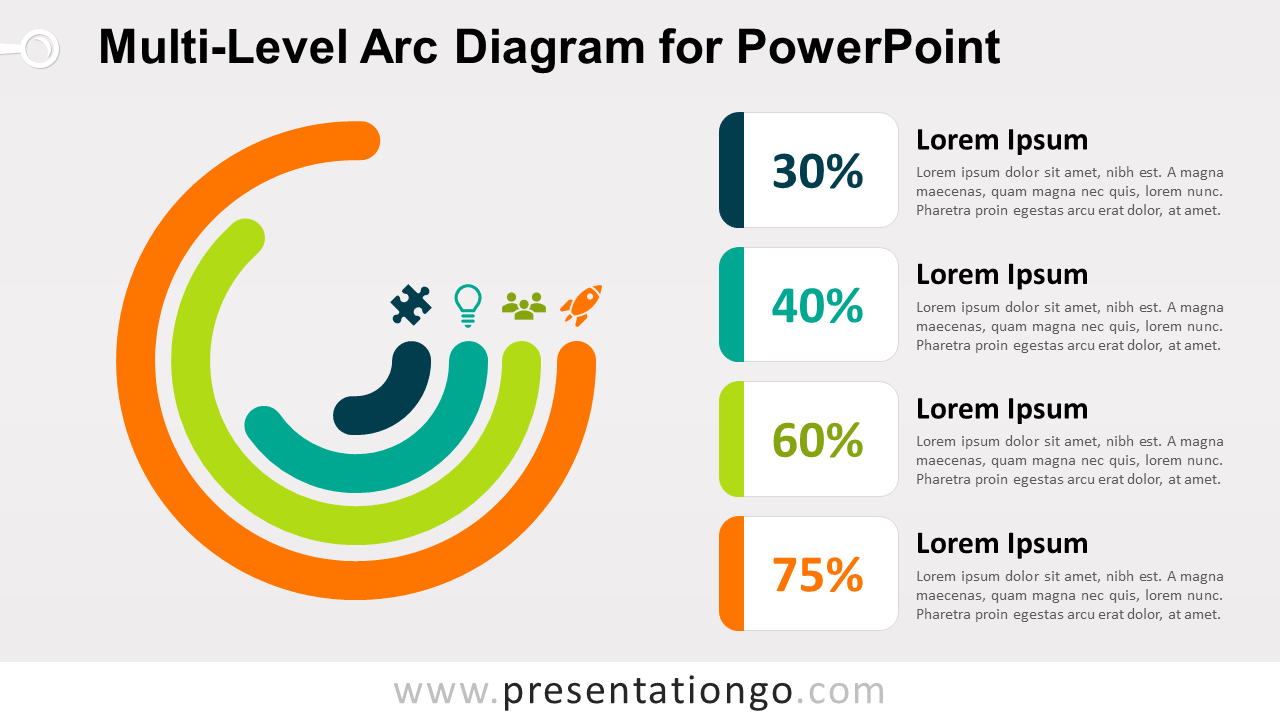
Free multi-level arc diagram for PowerPoint. 4 layers of colorful arc shapes with various circumference lines to illustrate custom results.
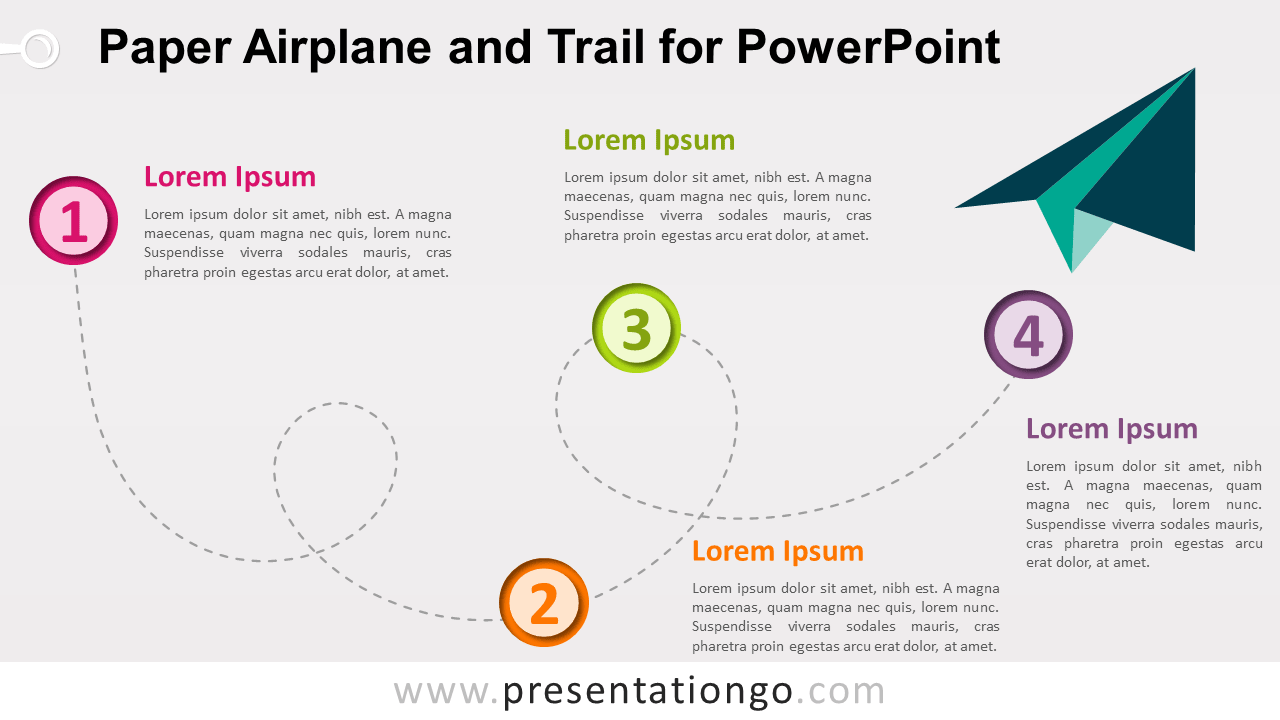
Free paper airplane and trail for PowerPoint. A flying traditional folded paper plane, with a trail (dotted curved line) and numbers.
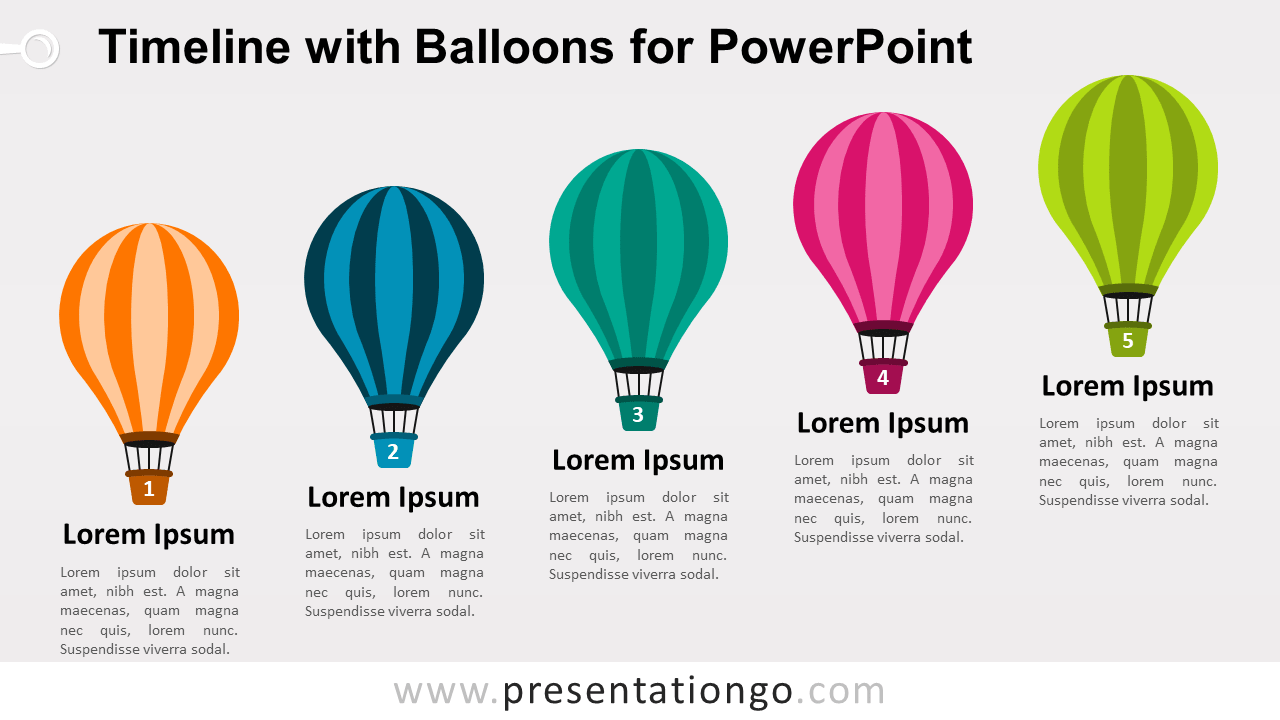
Free timeline with balloons for PowerPoint. Design illustration of 5 colorful diagonally-aligned rising hot air balloons. Editable graphics.
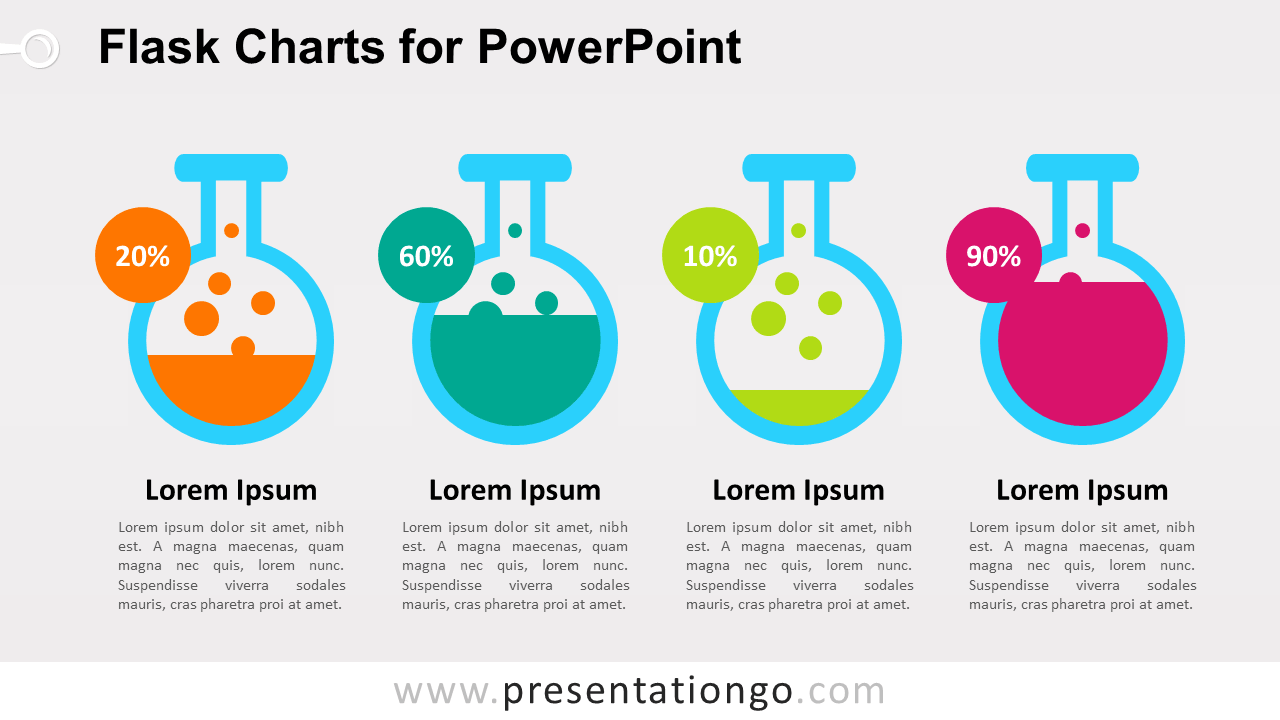
Free flask charts for PowerPoint. 4 laboratory round-bottom flasks with adjustable liquid volumes to illustrate custom results.
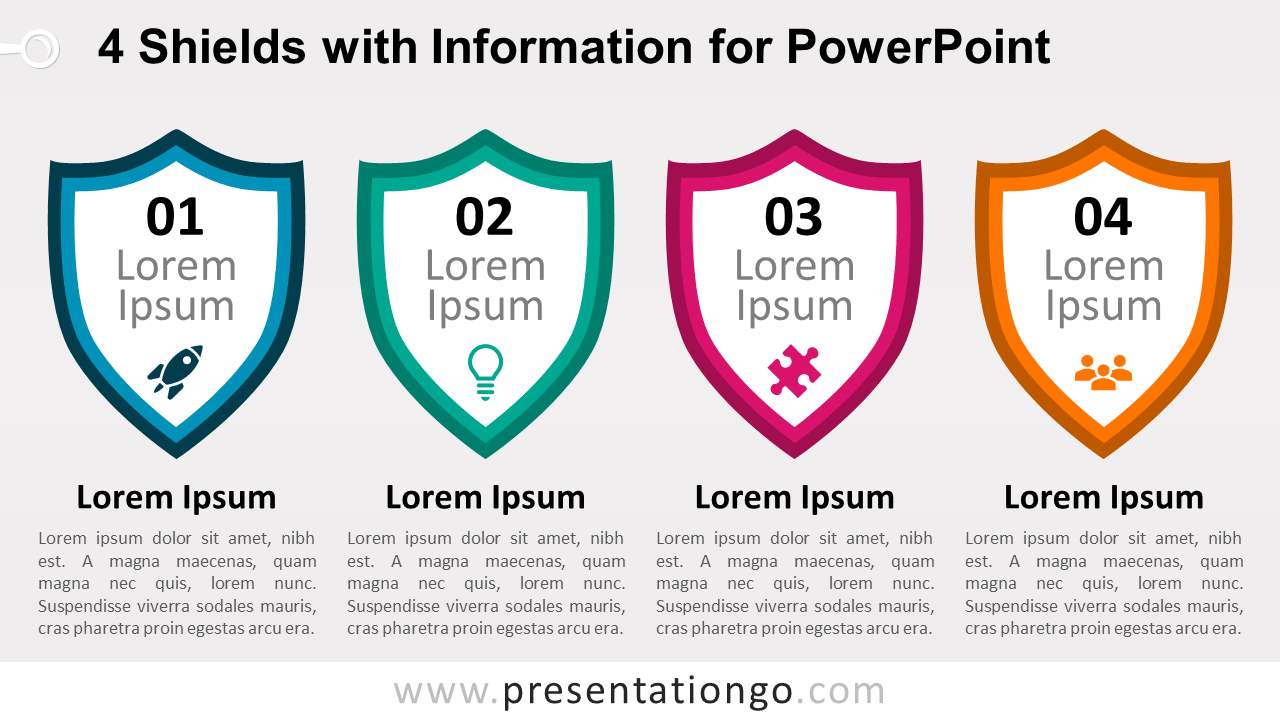
Free 4 shields with information for PowerPoint. 4 colorful horizontally aligned shields. Editable graphics with text and chart placeholders.
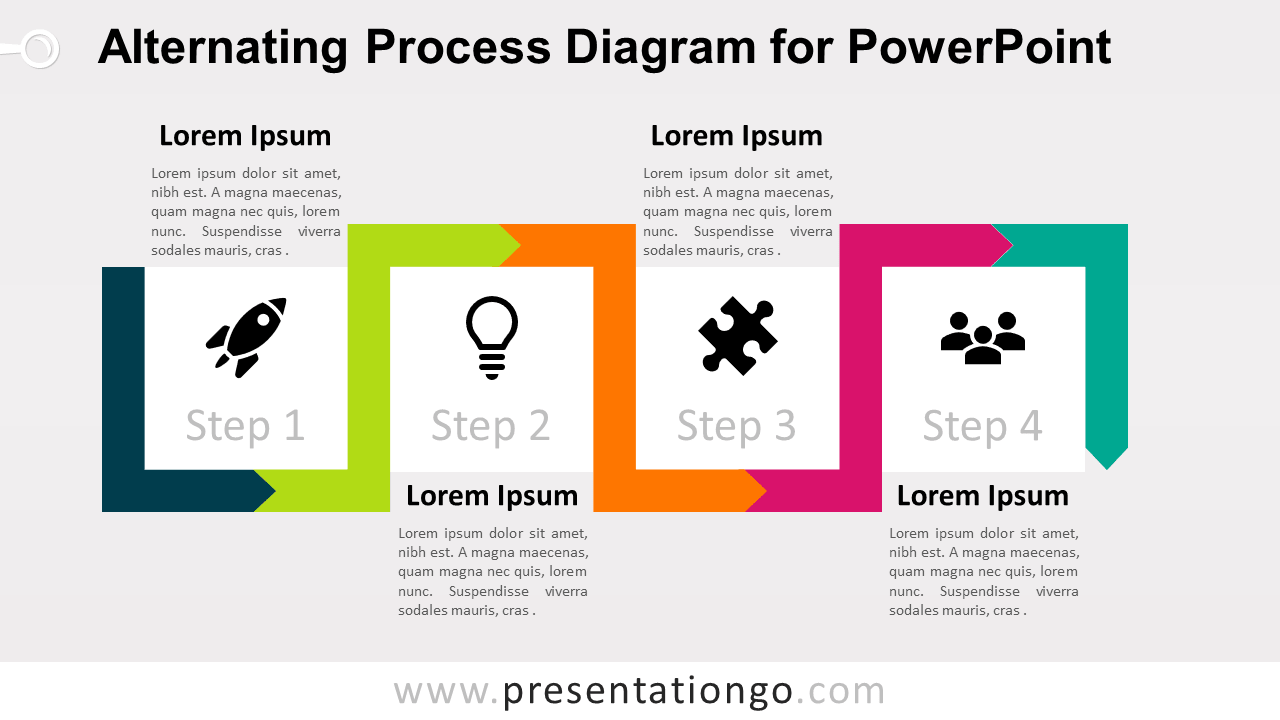
Free alternating process diagram for PowerPoint. 4-step horizontal serpentine process diagram with 5 bent pentagon arrows. Editable graphics.
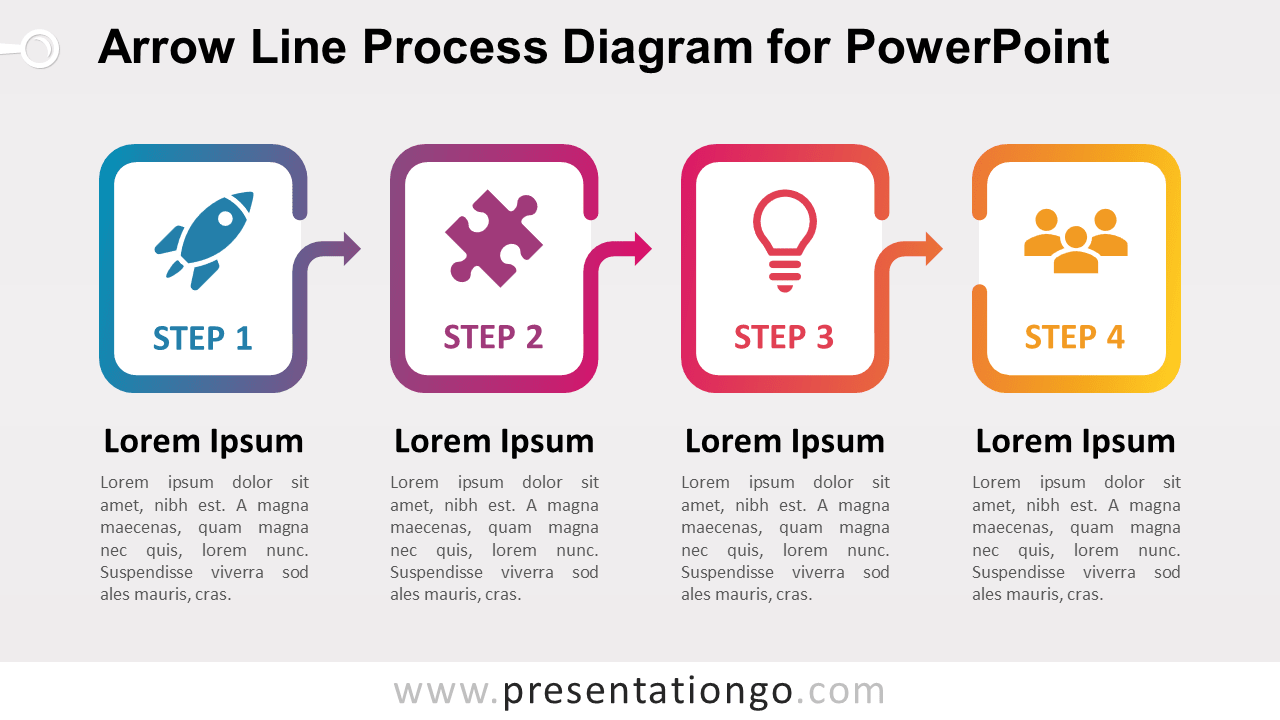
Free arrow line process diagram for PowerPoint. 4-step horizontal process diagram with arrow blocks. Editable graphics with text and icon placeholders.
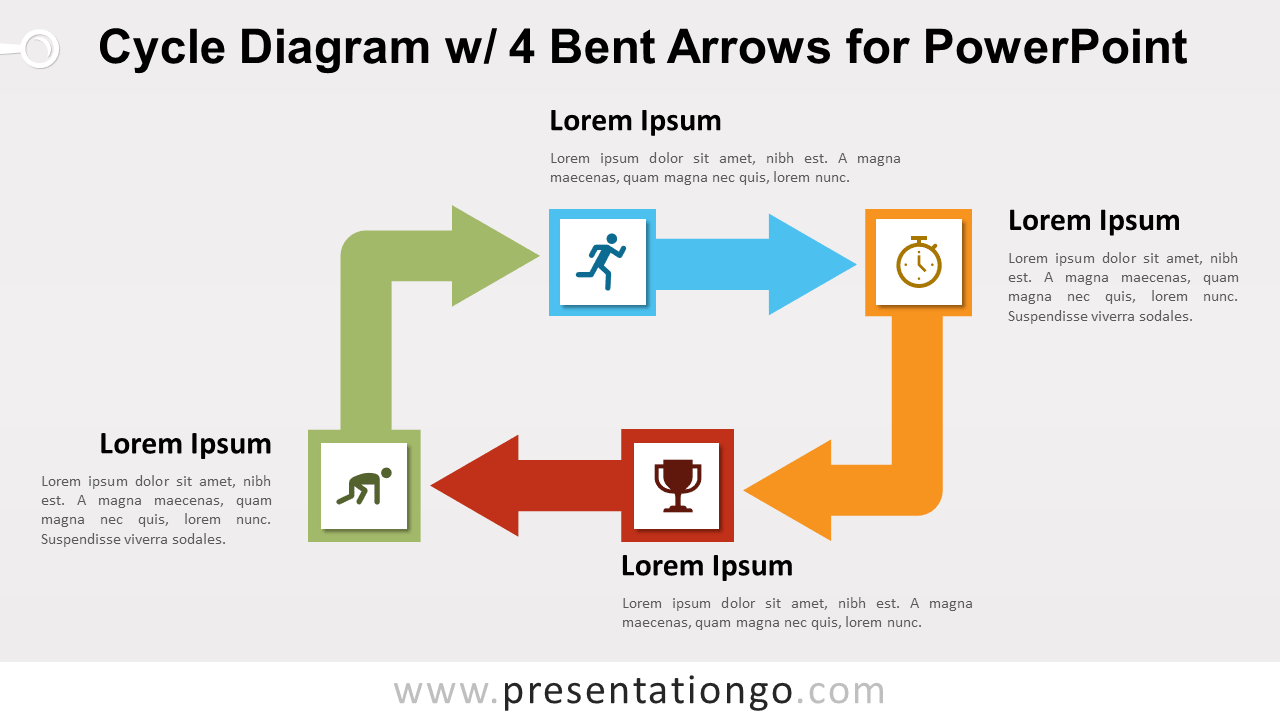
Free cycle diagram with 4 bent arrows for PowerPoint. Rectangle motion cycle diagram made with 4 bent arrow shapes. Editable graphics.
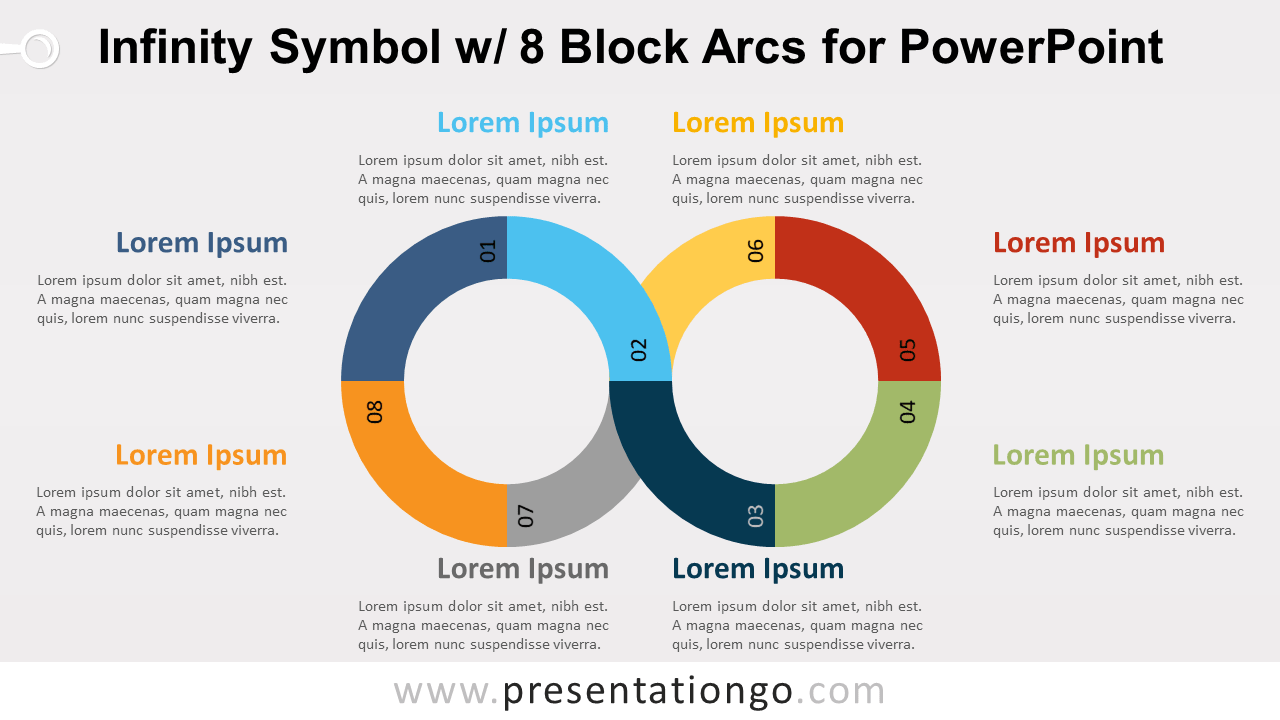
Free infinity symbol diagram with 8 block arcs for PowerPoint. Never-ending loop diagram with 8 steps, made with block arc shapes.
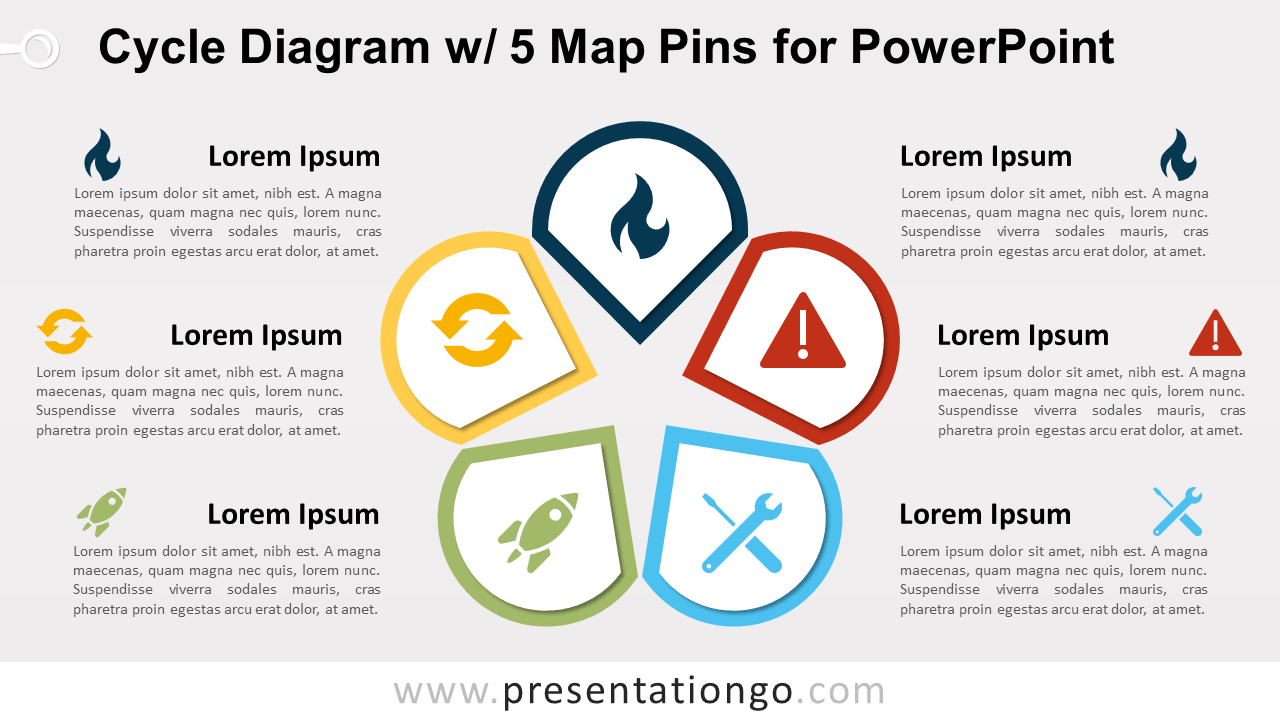
Free cycle diagram with 5 map pins for PowerPoint. Nondirectional diagram made with 5 map pins forming a 5-pointed star in the center.
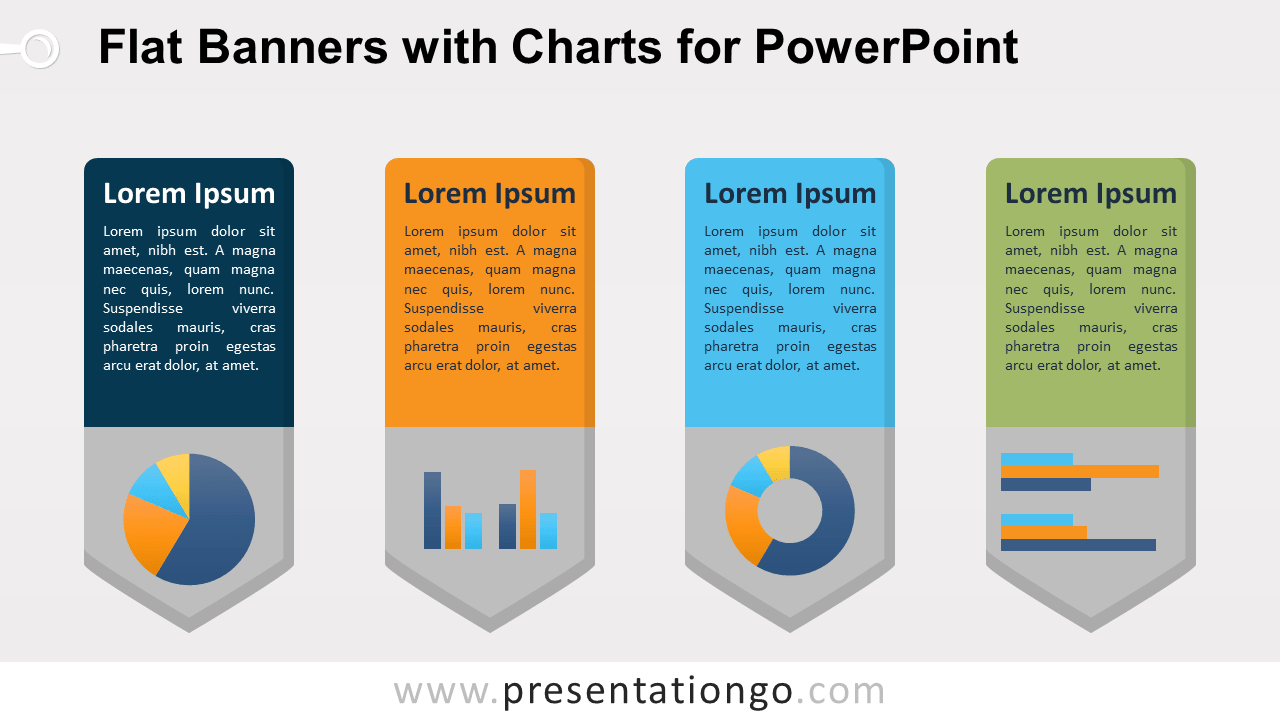
Free flat banners with charts for PowerPoint. 4 vertical pentagon arrow banners with a data-driven chart on the bottom of each.
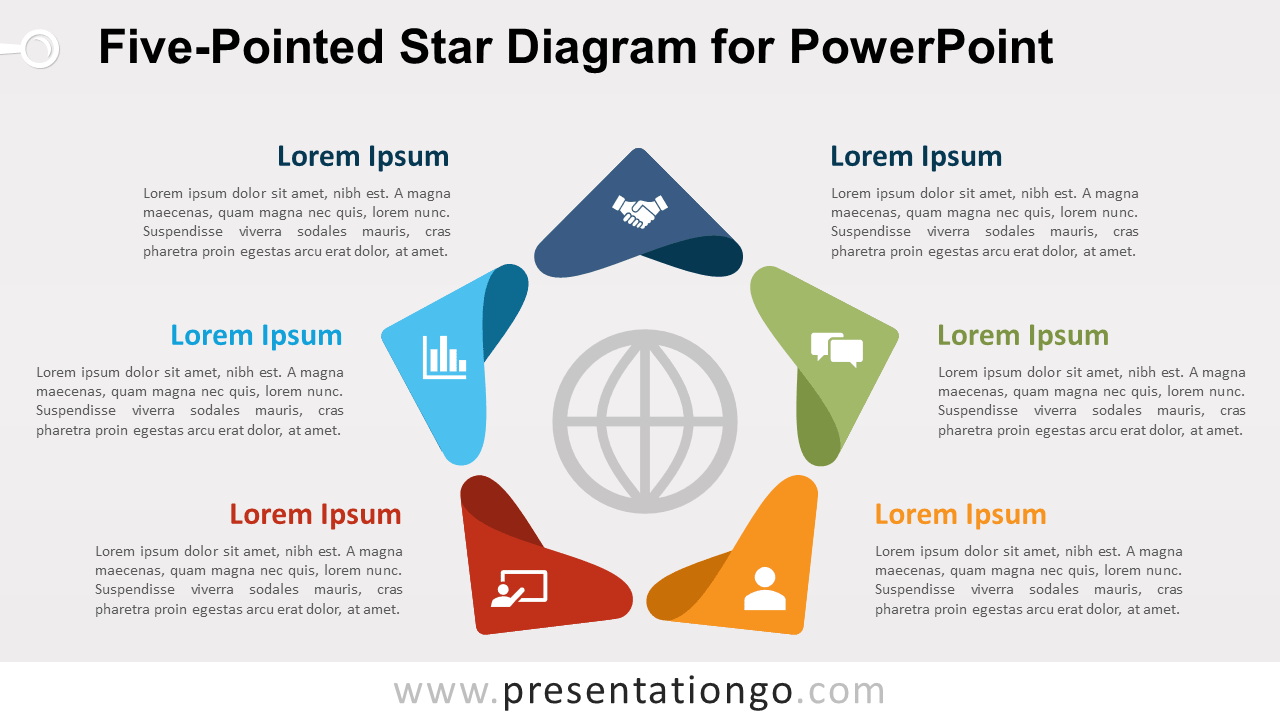
Free five-pointed star cycle diagram for PowerPoint. Nondirectional diagram with 5 folded cones in a circular flow. Editable shapes.
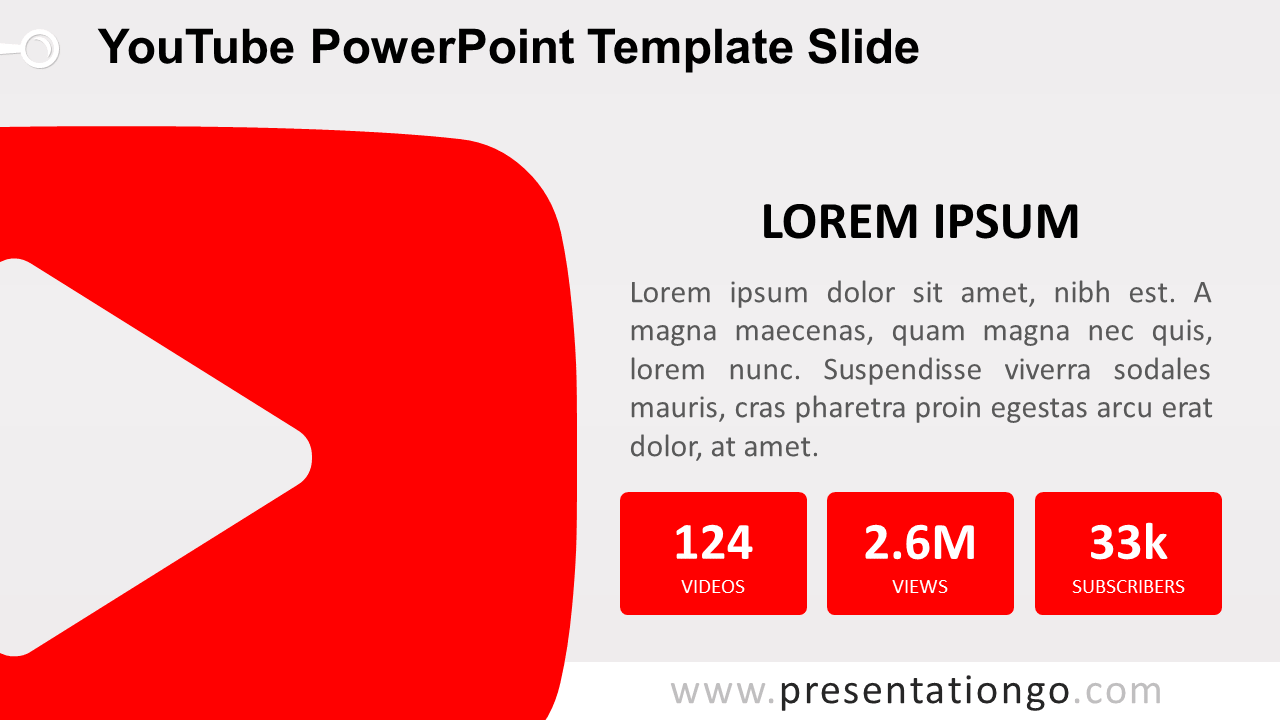
Free YouTube PowerPoint template slide. Clearly present key metrics, analytics or performance for your YouTube (brand or business) account.
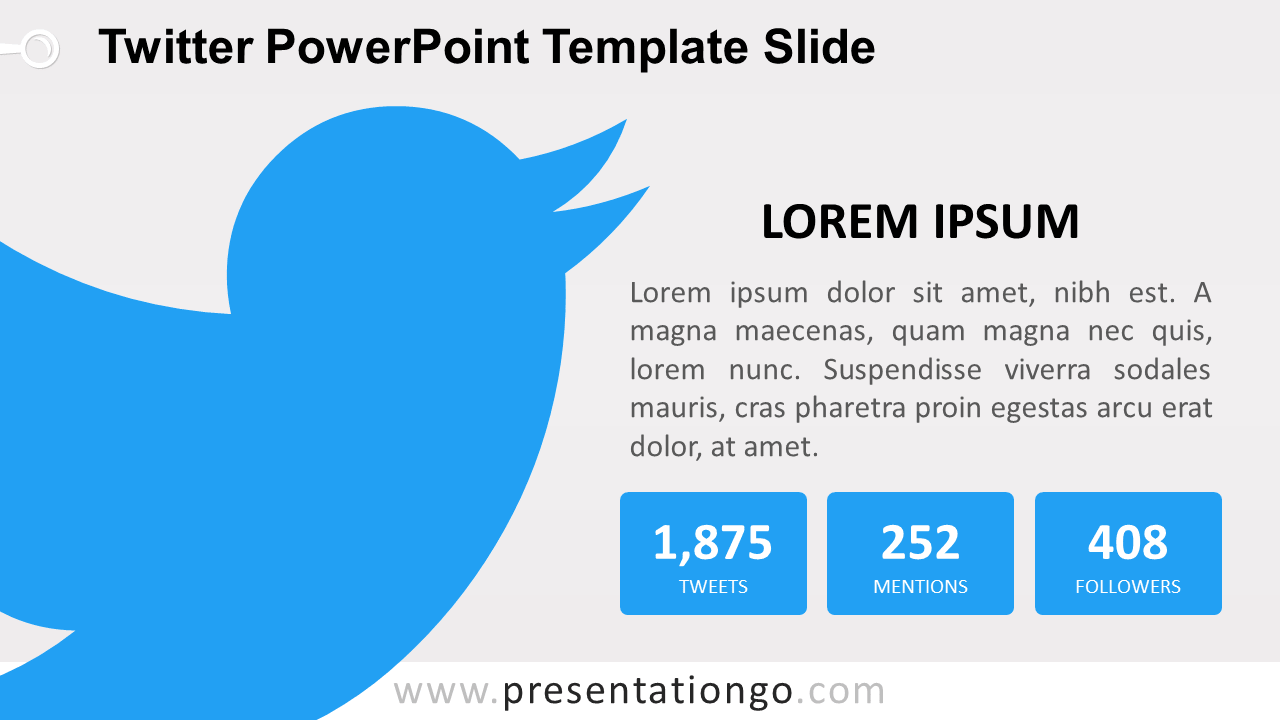
Free Twitter PowerPoint template slide. Clearly present key metrics, analytics or performance for your Twitter (brand or business) account.
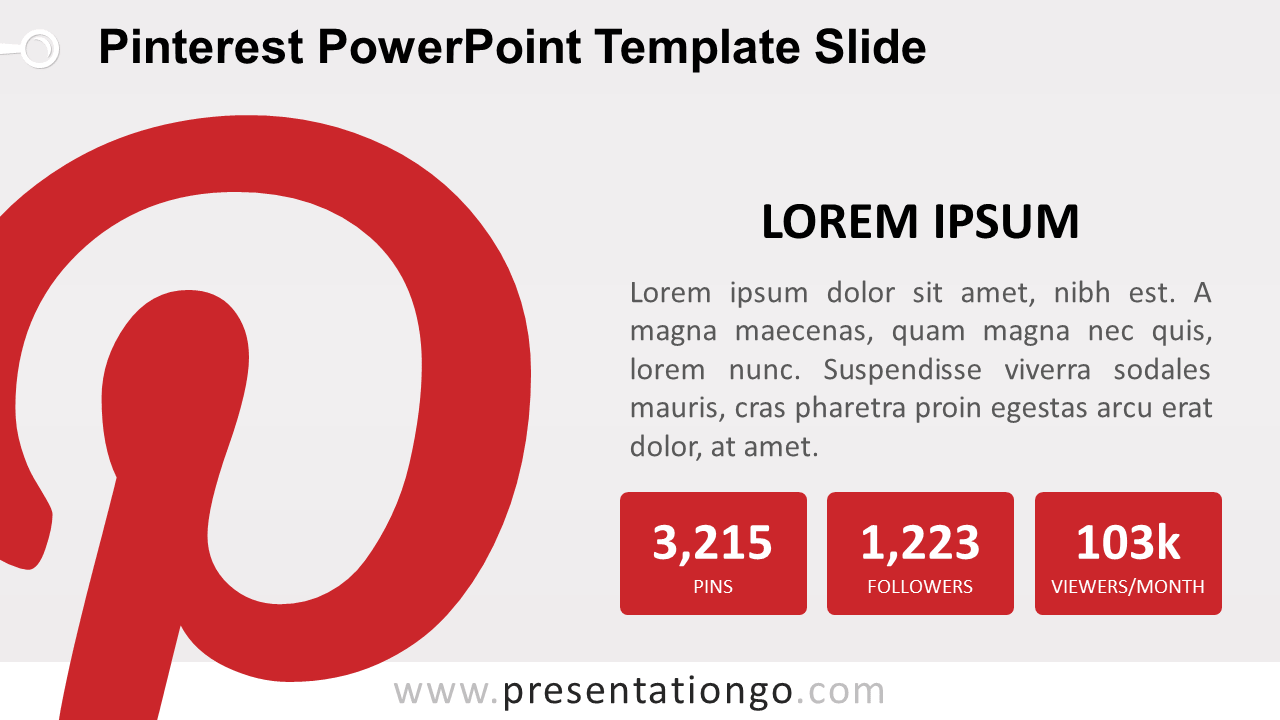
Free Pinterest PowerPoint template slide. Clearly present key metrics, analytics or performance for your Pinterest (brand or business) account.
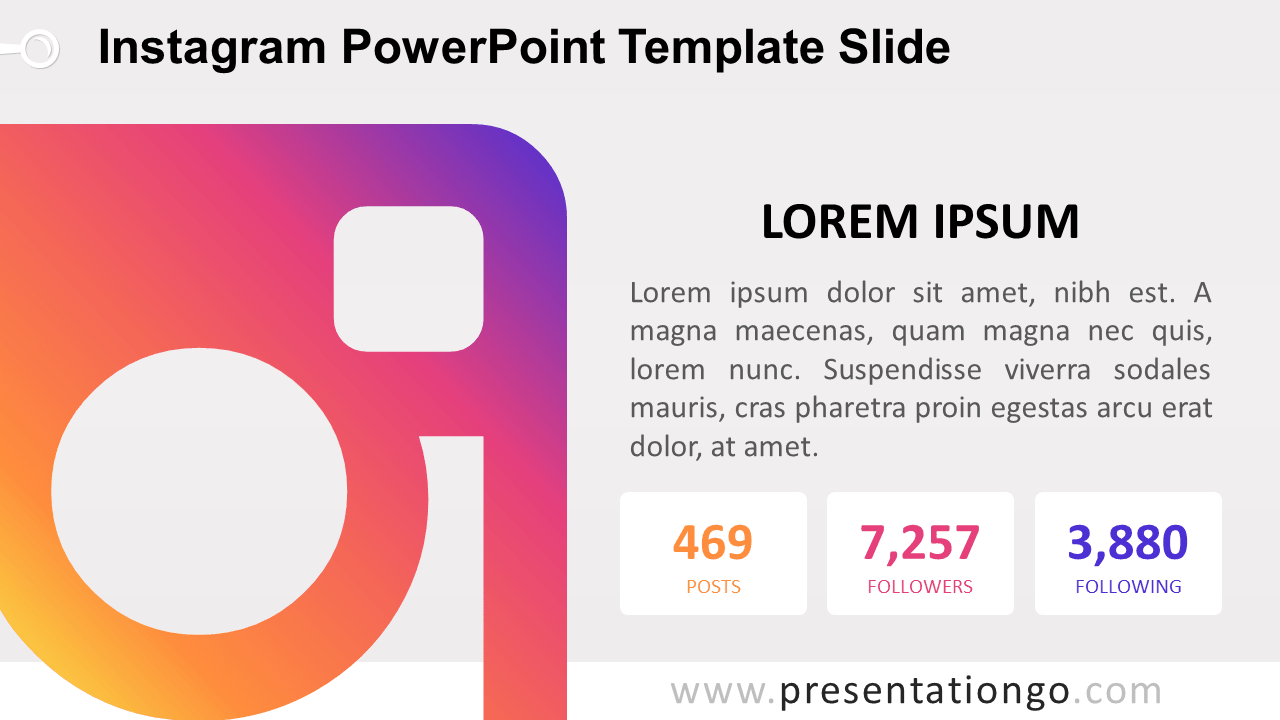
Free Instagram PowerPoint template slide. Clearly present your most important metrics, analytics or performance with your Instagram account.
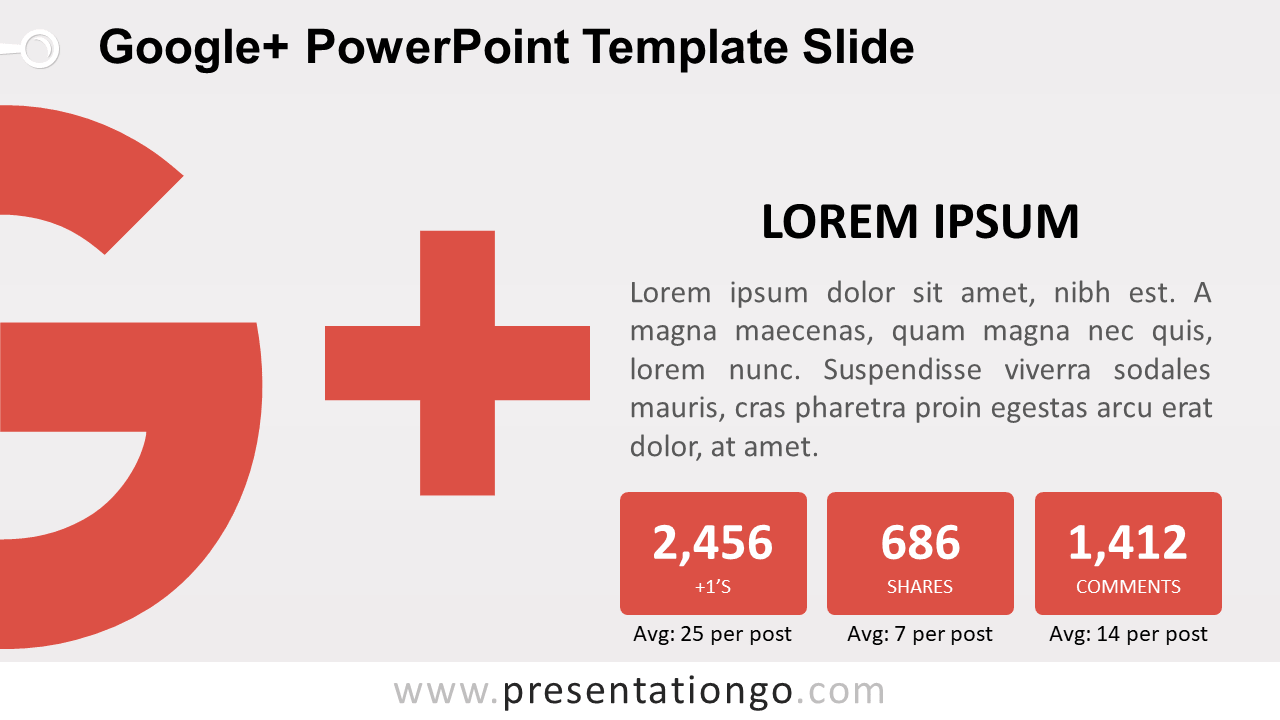
Free Google Plus PowerPoint template slide. Clearly present your most important metrics, analytics or performance with your Google+ account.
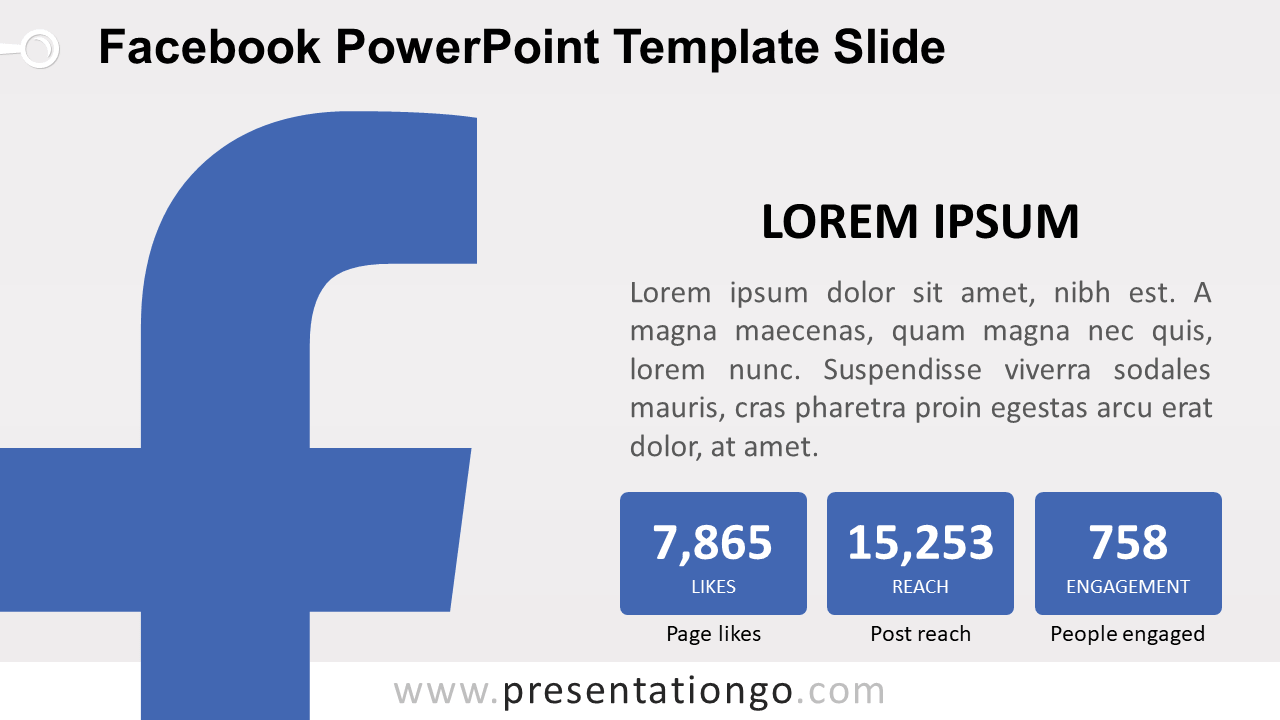
Free Facebook PowerPoint template slide. Clearly present your most important metrics, analytics or performance with your Facebook account.