 100% 免费
堆叠图表PowerPoint
3D Stacked Column Chart for PowerPoint
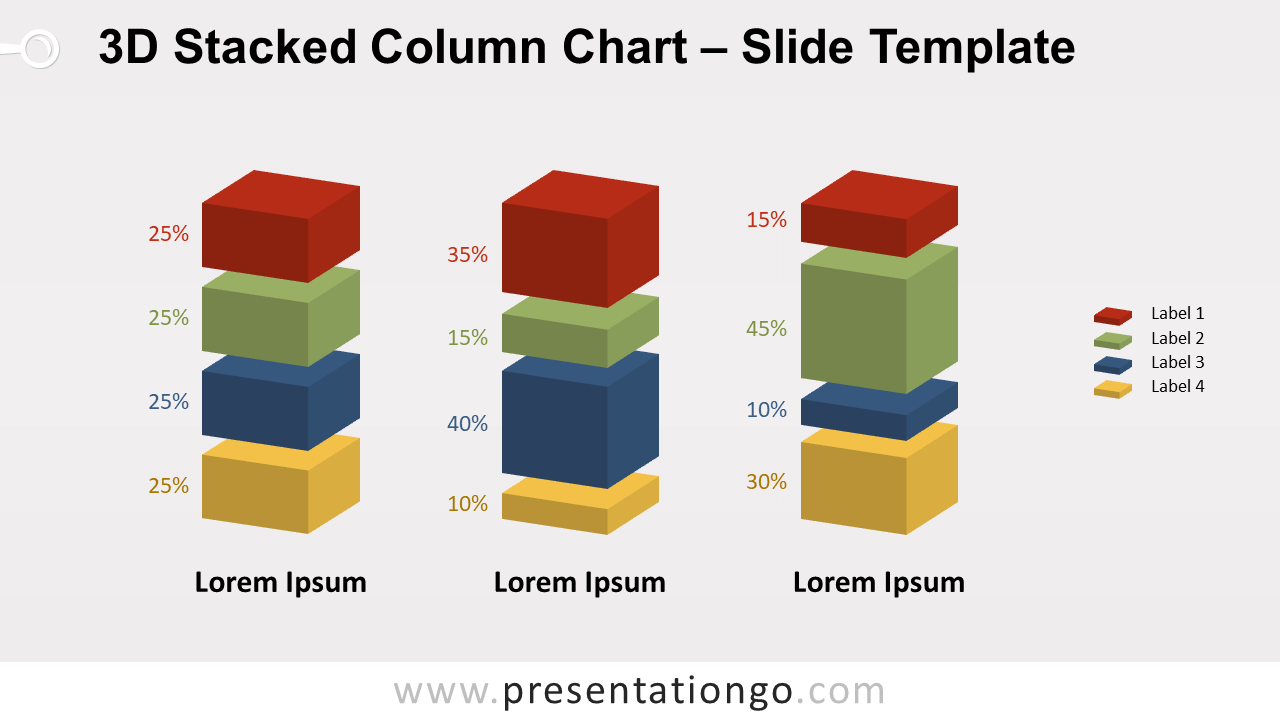
Free 3D stacked column chart for PowerPoint. A beautiful alternative to the regular column chart. Editable graphics designed with the 3-D function.
模板详情
Free 3D stacked column chart for PowerPoint. A beautiful alternative to the regular data-driven column chart. Editable graphics designed with the 3-D function. If you are looking for more design options for your column charts , this template surely will grab your interest. This chart alternative offers a nice depth to your graphics and reinforces the 3D effect. The difference? Each category (or series) is detached from the others. And adding this space between the series beautifully optimizes the visualization of your data. In order to adapt the height of the blocks according to your data, you need to manually adjust each depth from the Format Shape menu. First, select the block, right-click, then go to Format Shape and click the 3-D Format tab. Adjust the “ Depth ” size accordingly.
- 来源
- PresentationGo
- 文件格式
- pptx
- 文件大小
- 68 KB
- 下载次数
- 0
- 幻灯片页数
- 2
- 页面比例
- 16:9
作者 / 版权:PresentationGo
原始出处:PresentationGo 原文