 100% 免费
点状地图信息图
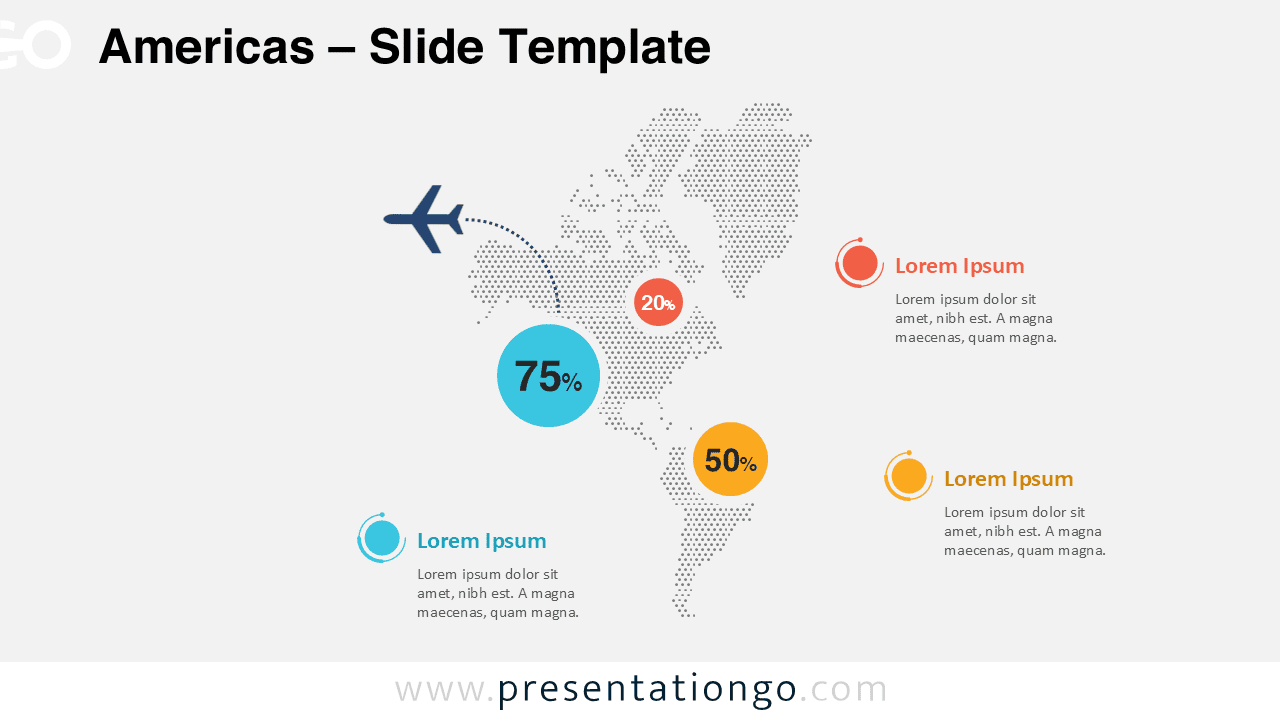
Americas Dotted Map Infographic
突出 数据 跨越 North 和 South America 使用 这款 现代 点状 地图 信息图 设计 适用于 PowerPoint 和 Google Slides 演示文稿.
查看原文(English)
Highlight data across North and South America using this modern dotted map infographic designed for PowerPoint and Google Slides presentations.
模板详情
The Americas Dotted Map Infographic provides a modern and visually engaging way to present geographic data across North America, Central America, and South America. Designed for PowerPoint and Google Slides, this infographic uses a clean dotted pattern to represent the continent while allowing presenters to highlight key regions, statistics, or strategic insights. This infographic layout is particularly useful when presenting regional performance, market expansion strategies, travel routes, or demographic information. The dotted map design keeps the slide visually light while still maintaining strong geographic recognition.
- 来源
- PresentationGo
- 文件格式
- pptx
- 文件大小
- 240 KB
- 下载次数
- 0
作者 / 版权:PresentationGo
原始出处:PresentationGo 原文