See如何信息图数据
See How This Balanced Scorecard Infographic Simplifies Data
探索我们的 橙色 和 可爱 Balanced Scorecard 信息图. 完全可自定义,且完全免费使用. 制作 您的 战略 清晰 今天!
查看原文(English)
Discover our orange and cute Balanced Scorecard Infographic. Fully customizable and completely free to use. Make your strategy clear today!
模板详情
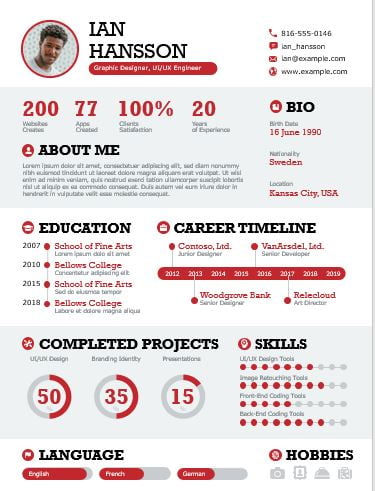
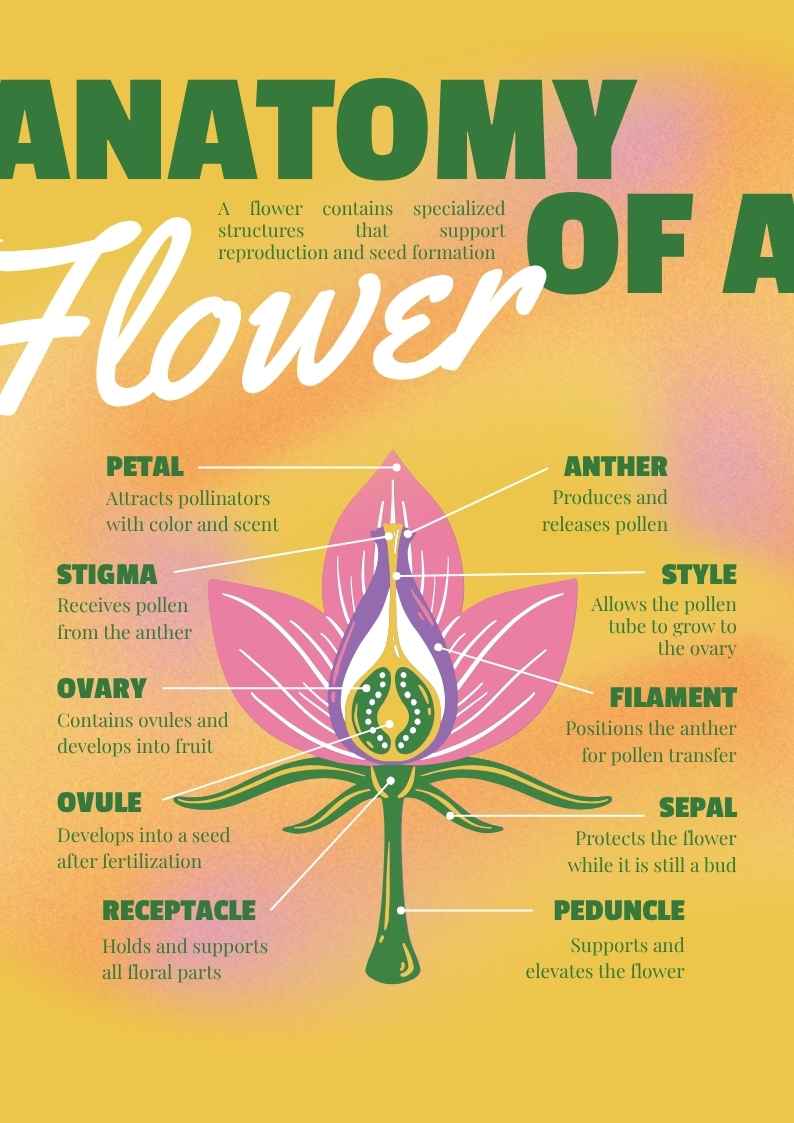
Perfect for business professionals, this delightful orange infographic template breaks down your key metrics in a visually engaging way. Whether you’re preparing for a meeting, reporting to stakeholders, or planning your next strategy, this cute and effective design will help you communicate complex information effortlessly. Use it to highlight performance indicators, outline objectives, and present data in a way that’s easy to digest and memorable.
模板特性
- 3 ready-to-use A4 infographics completely customizable to suit your needs
- Hundreds of charts, frames, lines and shapes to choose from
- Handy animation and transition features for each infographics
- Easy downloading or sharing in a wide range of formats
- An easy drag-and-drop tool to help you add graphics
- Page animation features, emojis, color palettes and font sets
- 来源
- SlidesCarnival
- 文件格式
- 文件大小
- —
- 下载次数
- 0
- 幻灯片页数
- 3
- 页面比例
- 16:9
作者 / 版权:SlidesCarnival
原始出处:SlidesCarnival 原文