 100% 免费
图表
Emotion Waffle Chart
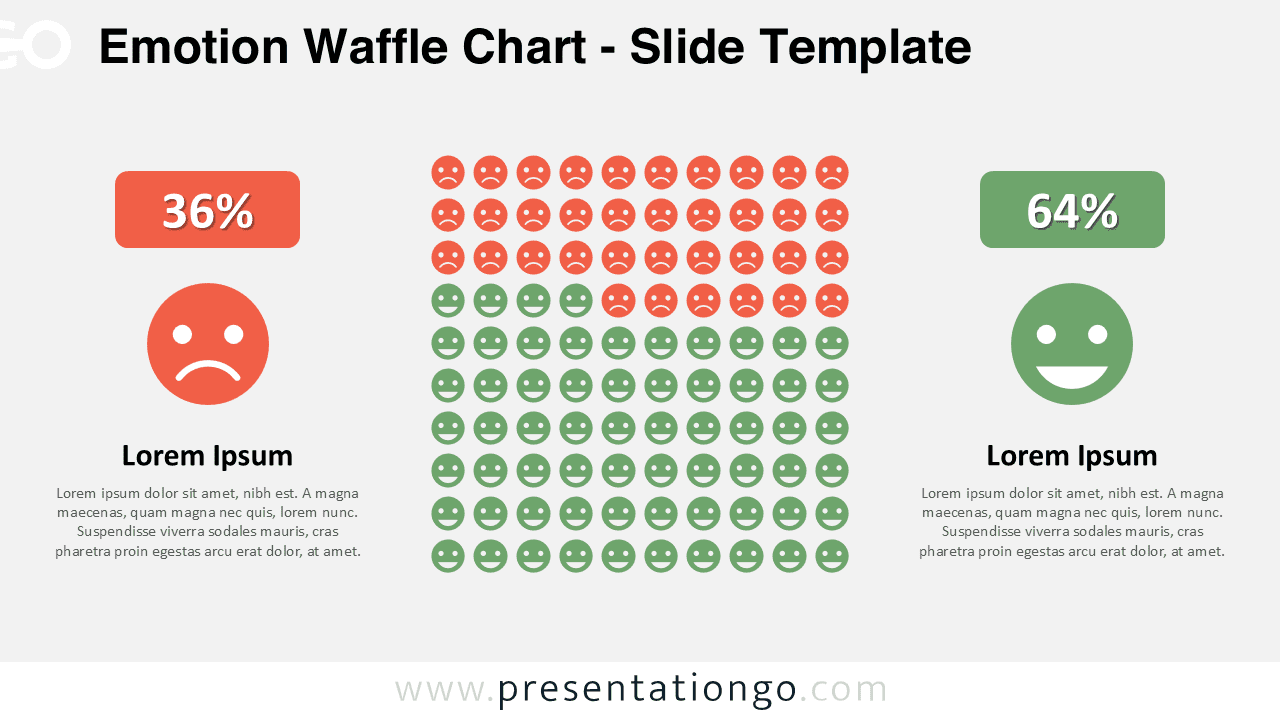
Download free Emotion Waffle Chart for PowerPoint and Google Slides to show positive and negative sentiments using smiley and frowny icons.
模板详情
The Emotion Waffle Chart displays sentiment data through 100 circular face icons arranged in a 10×10 grid, designed for PowerPoint and Google Slides presentations. This waffle chart visualizes data using a 10×10 grid filled with 100 round face icons—each representing one percent of the total data. The top 36 icons feature red-toned frowny faces while the remaining 64 display green smiley faces. These expressive visuals are color-coded and aligned with two side panels that summarize the sentiment data. Each vertical side panel includes a large circular face icon, a percentage badge, a title, and a short explanation. The design is clean, mirrored, and emotion-focused—ideal for immediate recognition and comparison.
模板特性
- 2 unique slides + 1 instruction slide on how to replace icons
- Options for both light and dark themes
- Pre-populated with icons, numbers, and text placeholders
- Fully customizable shapes for complete control
- Available in both Standard (4:3) and Widescreen (16:9) ratios
- Offered in both PowerPoint PPTX and Google Slides formats
- 来源
- PresentationGo
- 文件格式
- pptx
- 文件大小
- 201 KB
- 下载次数
- 0
- 幻灯片页数
- 2
- 页面比例
- 16:9
作者 / 版权:PresentationGo
原始出处:PresentationGo 原文