 100% 免费
四阶段图表
Four-Stage Serpentine Chart
Show four-step workflows with this serpentine chart template, fully editable for PowerPoint and Google Slides. Download now!
模板详情
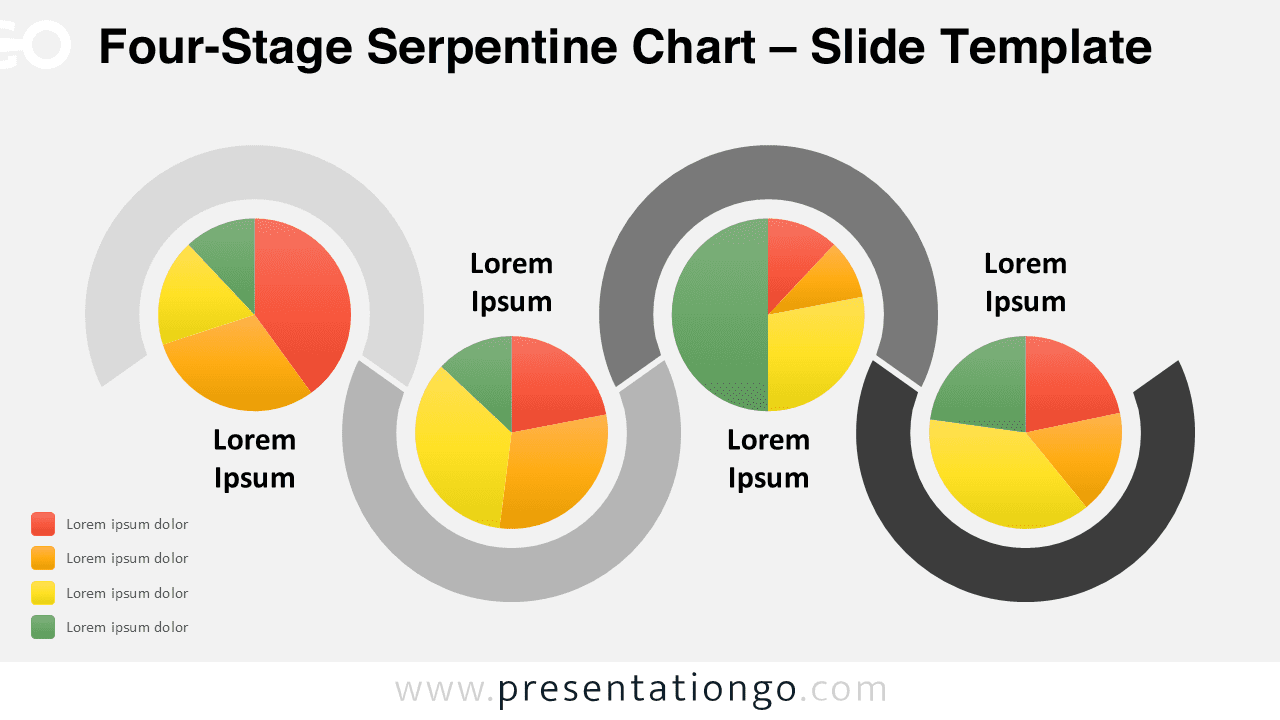
The Four-Stage Serpentine Chart illustrates a sequence of four connected stages, integrating pie charts, designed for PowerPoint and Google Slides. This diagram features a serpentine structure with four interconnected steps, each housing a distinct pie chart. The steps are formed using partial circular segments, visually flowing in a wave-like manner. These charts enable data segmentation and comparison while maintaining a cohesive design. Customizable text placeholders, vibrant colors, and partial circles enhance readability and provide flexibility for customization. Pie charts are ideal for showcasing proportions, comparisons, or segmented data. The Four-Stage Serpentine Chart is perfect for illustrating workflows, processes, or multi-step strategies, such as marketing campaigns, project milestones, or customer journeys. Its fluid serpentine design links the stages logically, ensuring the audience understands progression effortlessly.
模板特性
- 2 unique slides
- Options for both light and dark themes
- Pre-populated with text placeholders
- Fully customizable shapes for complete control
- Data-driven pie-charts for dynamic data representation
- Available in both Standard (4:3) and Widescreen (16:9) ratios
- 来源
- PresentationGo
- 文件格式
- pptx
- 文件大小
- 197 KB
- 下载次数
- 0
- 幻灯片页数
- 2
- 页面比例
- 16:9
作者 / 版权:PresentationGo
原始出处:PresentationGo 原文