 100% 免费
信息图图表PowerPoint谷歌幻灯片
Infographic Column Chart for PowerPoint and Google Slides
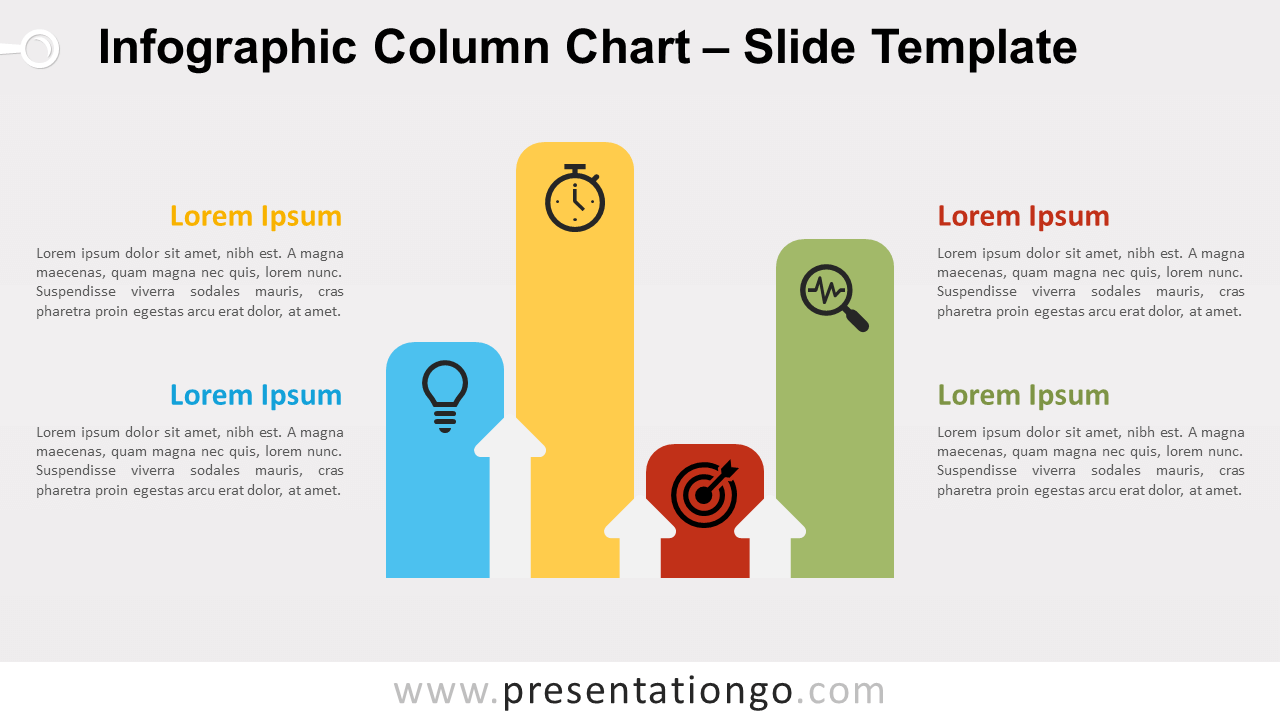
Free infographic column chart for PowerPoint and Google Slides. Vertical rounded bars with arrows to visualize and compare data. Editable graphics.
模板详情
Free infographic column chart for PowerPoint and Google Slides. Vertical rounded bars with arrows to visualize and compare data. Editable graphics with icons and text placeholders. Column charts are very famous graphics to easily visualize data . In brief, the relative length of the vertical bars makes this kind of graphic perfect to compare different values on the same slide. But the regular data-driven chart designs, while being very convenient, can also be kind of boring. However, with little imagination, you can make your column charts more appealing. More specifically, this infographic column chart comes with simple arrows. They are displayed in-between each bar. Very important: the color of the arrows is the same as your background. They will also work well with data-driven charts .
- 来源
- PresentationGo
- 文件格式
- pptx
- 文件大小
- 86 KB
- 下载次数
- 0
- 幻灯片页数
- 2
- 页面比例
- 16:9
作者 / 版权:PresentationGo
原始出处:PresentationGo 原文