 100% 免费
浅色Bulb图表PowerPoint
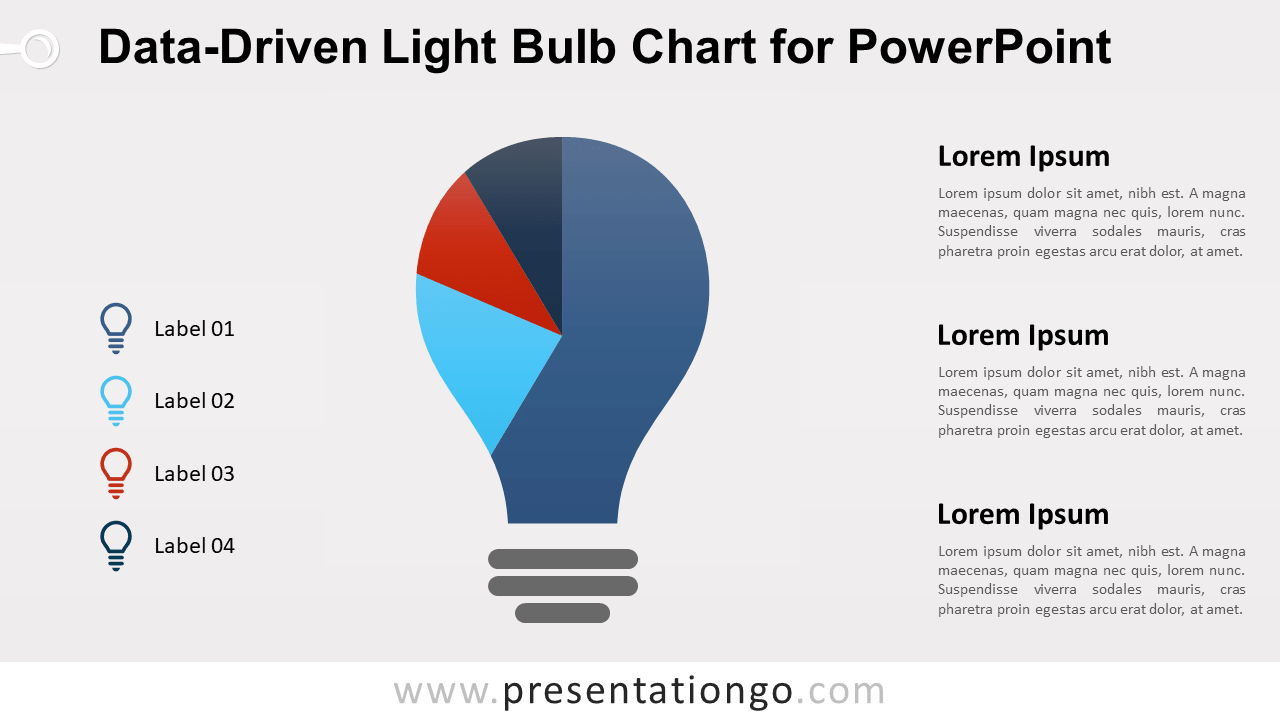
Light Bulb Chart for PowerPoint
Free light bulb chart for PowerPoint. Bulb design made with a data-driven pie chart. Infographic metaphor for ideas, innovation. 100% editable graphics.
模板详情
Free light bulb chart for PowerPoint. Bulb design made with a data-driven pie chart. Editable graphics with text placeholder. Use this creative chart in your presentation for quantitative results about (bright) ideas , innovations, or about electricity, for example. Built-in data driven PowerPoint chart: you can easily change data series and format (e.g., colors). Click on the shape to change the background color – to fit yours. Then, just right-click the chart to edit the data series ( Edit Data ):
- 来源
- PresentationGo
- 文件格式
- pptx
- 文件大小
- 164 KB
- 下载次数
- 0
- 幻灯片页数
- 2
- 页面比例
- 16:9
作者 / 版权:PresentationGo
原始出处:PresentationGo 原文