 100% 免费
简洁图示PowerPoint谷歌幻灯片
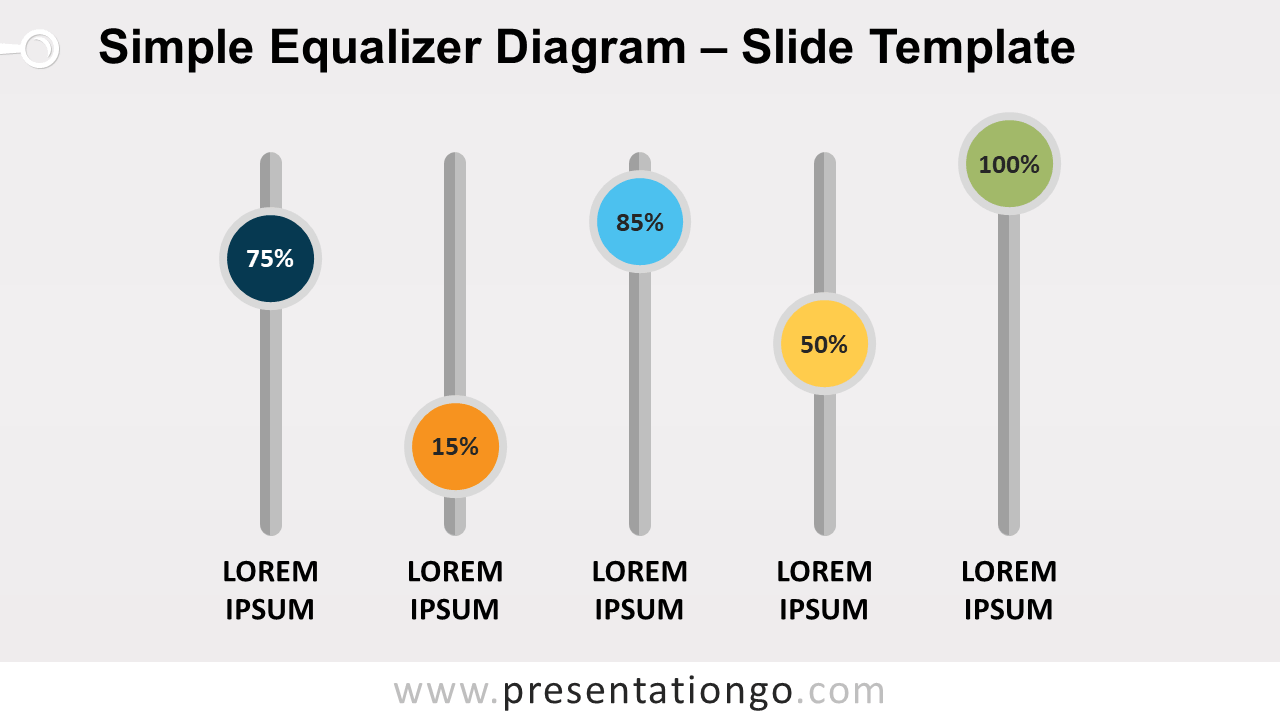
Simple Equalizer Diagram for PowerPoint and Google Slides
Free simple equalizer diagram for PowerPoint. 5 vertical bars with circles to be manually adjusted for the required (custom) frequency. Editable graphics.
模板详情
Free simple equalizer diagram for PowerPoint and Google Slides. Five (5) vertical bars with circles to be manually adjusted for the required (custom) frequency. Non-data-driven chart alternative. Editable graphics with text placeholders. Use this chart for quantitative results, to show and compare percentages for example.
- 来源
- PresentationGo
- 文件格式
- pptx
- 文件大小
- 70 KB
- 下载次数
- 0
- 幻灯片页数
- 2
- 页面比例
- 16:9
作者 / 版权:PresentationGo
原始出处:PresentationGo 原文