 100% 免费
图表PowerPoint谷歌幻灯片
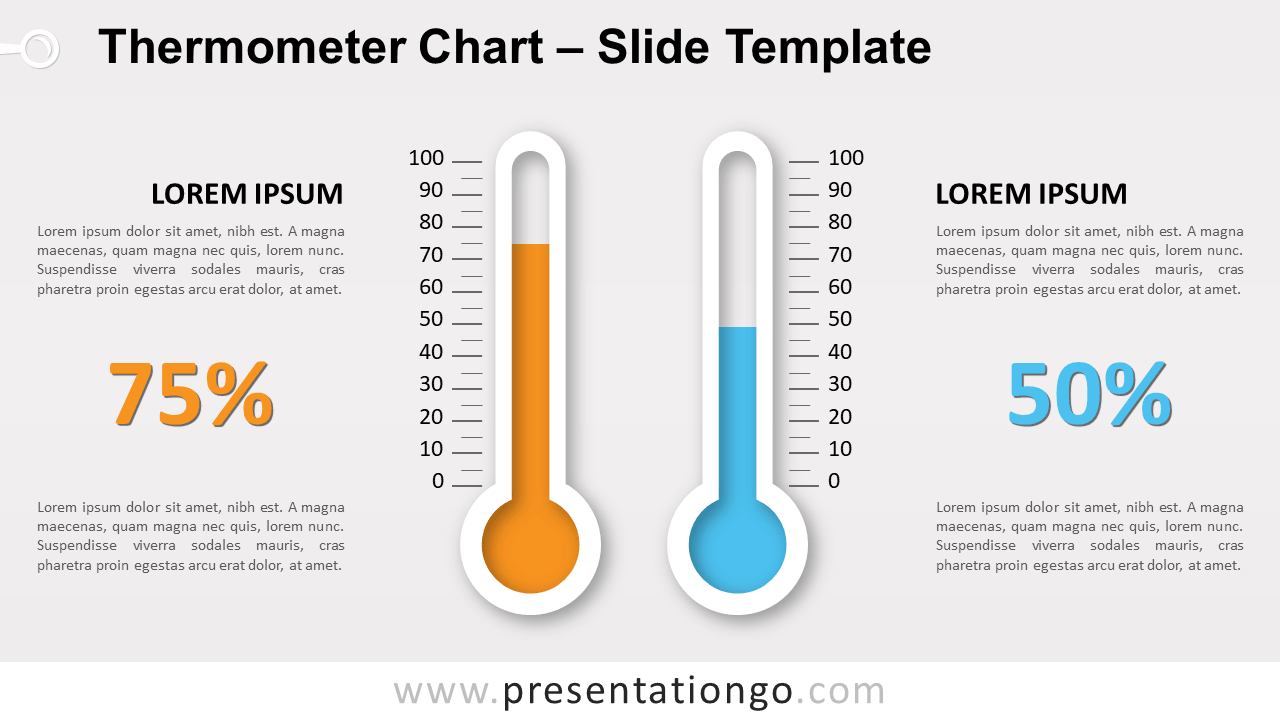
Thermometer Chart for PowerPoint and Google Slides
Free thermometer chart for PowerPoint and Google Slides. 2 editable thermometer graphics with scale and text. Great to compare quantitative results.
模板详情
Free thermometer chart for PowerPoint and Google Slides. 2 thermometer graphics with scale. Editable graphics with text placeholders. Use this infographic chart in your presentation to compare quantitative results. Built-in data driven PowerPoint chart: made with stacked column chart, you can easily change data series and format (e.g., colors).
- 来源
- PresentationGo
- 文件格式
- pptx
- 文件大小
- 172 KB
- 下载次数
- 0
- 幻灯片页数
- 3
- 页面比例
- 16:9
作者 / 版权:PresentationGo
原始出处:PresentationGo 原文