 100% 免费
红酒图表
Wine Glass Charts
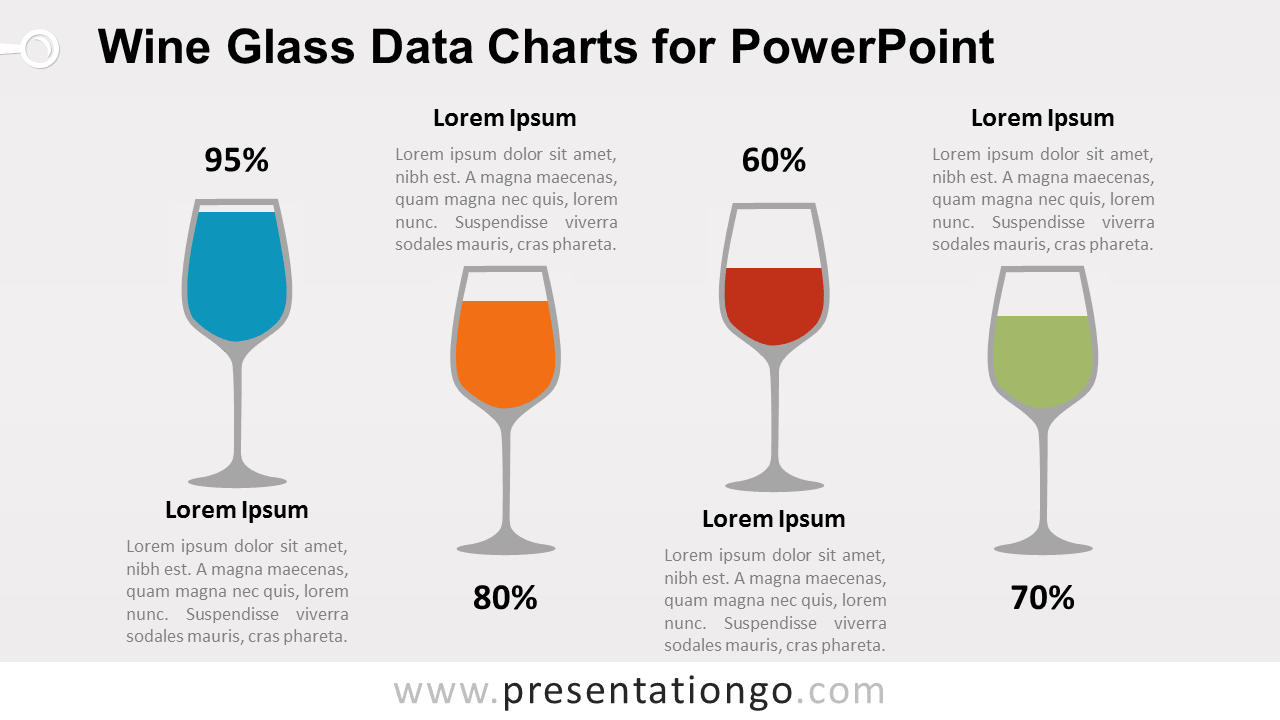
Download Wine Glass Charts for PowerPoint with editable data-driven charts, 2 slides, and wine glass visuals for percentage comparison presentations.
模板详情
The Wine Glass Charts for PowerPoint present four percentage values through wine glass-shaped data-driven charts. Each glass combines a visual fill level, percentage label, heading, and supporting text. The layout works well for comparing performance, survey results, KPIs, completion rates, category values, or other quantitative data in a more visual format.
- 来源
- PresentationGo
- 文件格式
- pptx
- 文件大小
- 173 KB
- 下载次数
- 0
标签
作者 / 版权:PresentationGo
原始出处:PresentationGo 原文