 100% Gratis
Up-Arrows Chart for PowerPoint and Google Slides
Free up-arrows chart for PowerPoint and Google Slides. Replace your data-driven column charts with easy-to-adjust up-arrows.
Detalles de la plantilla
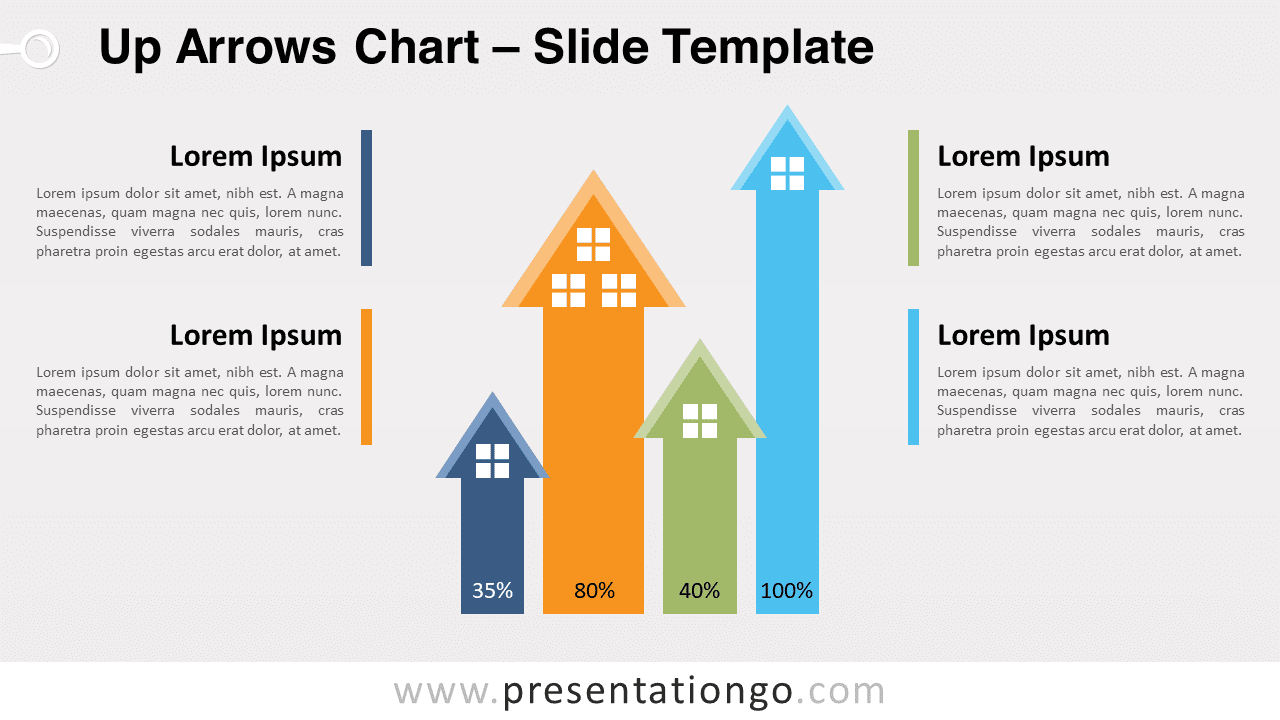
Free up-arrows chart for PowerPoint and Google Slides. Replace your data-driven column charts with easy-to-adjust up-arrows. Editable graphics with percentage percentages, icons, and text placeholders. Show your audience you have more than one arrow in your quiver! It is indeed time to display a new way to share quantitative results thanks to this free Up-Arrows Chart template! This slide shows 4 arrows pointing up. Therefore, it gives you 4 options to share and compare your numbers, statistics, and data. Besides, all 4 arrows have a different width, height, and color. They also look like high houses with windows and a roof (you can change or remove this icon if needed). Below each arrow, you can write your percentage or number in writing too. Finally, there are 4 text placeholders to explain your results further. This free Up-Arrows Chart template is an amazing tool for data visualization. It will indeed help your audience memorize your important numbers and ideas. You can also use this diagram as a column chart.
- Fuente
- PresentationGo
- Formato
- pptx
- Tamaño
- 73 KB
- Descargas
- 0
- Diapositivas
- 2
- Relación
- 16:9
Autor / Copyright:PresentationGo
Fuente original:PresentationGo original