Loading resources…
Loading categories…
Free PPT templates and design assets in this category — all open for download.
합계 173 건
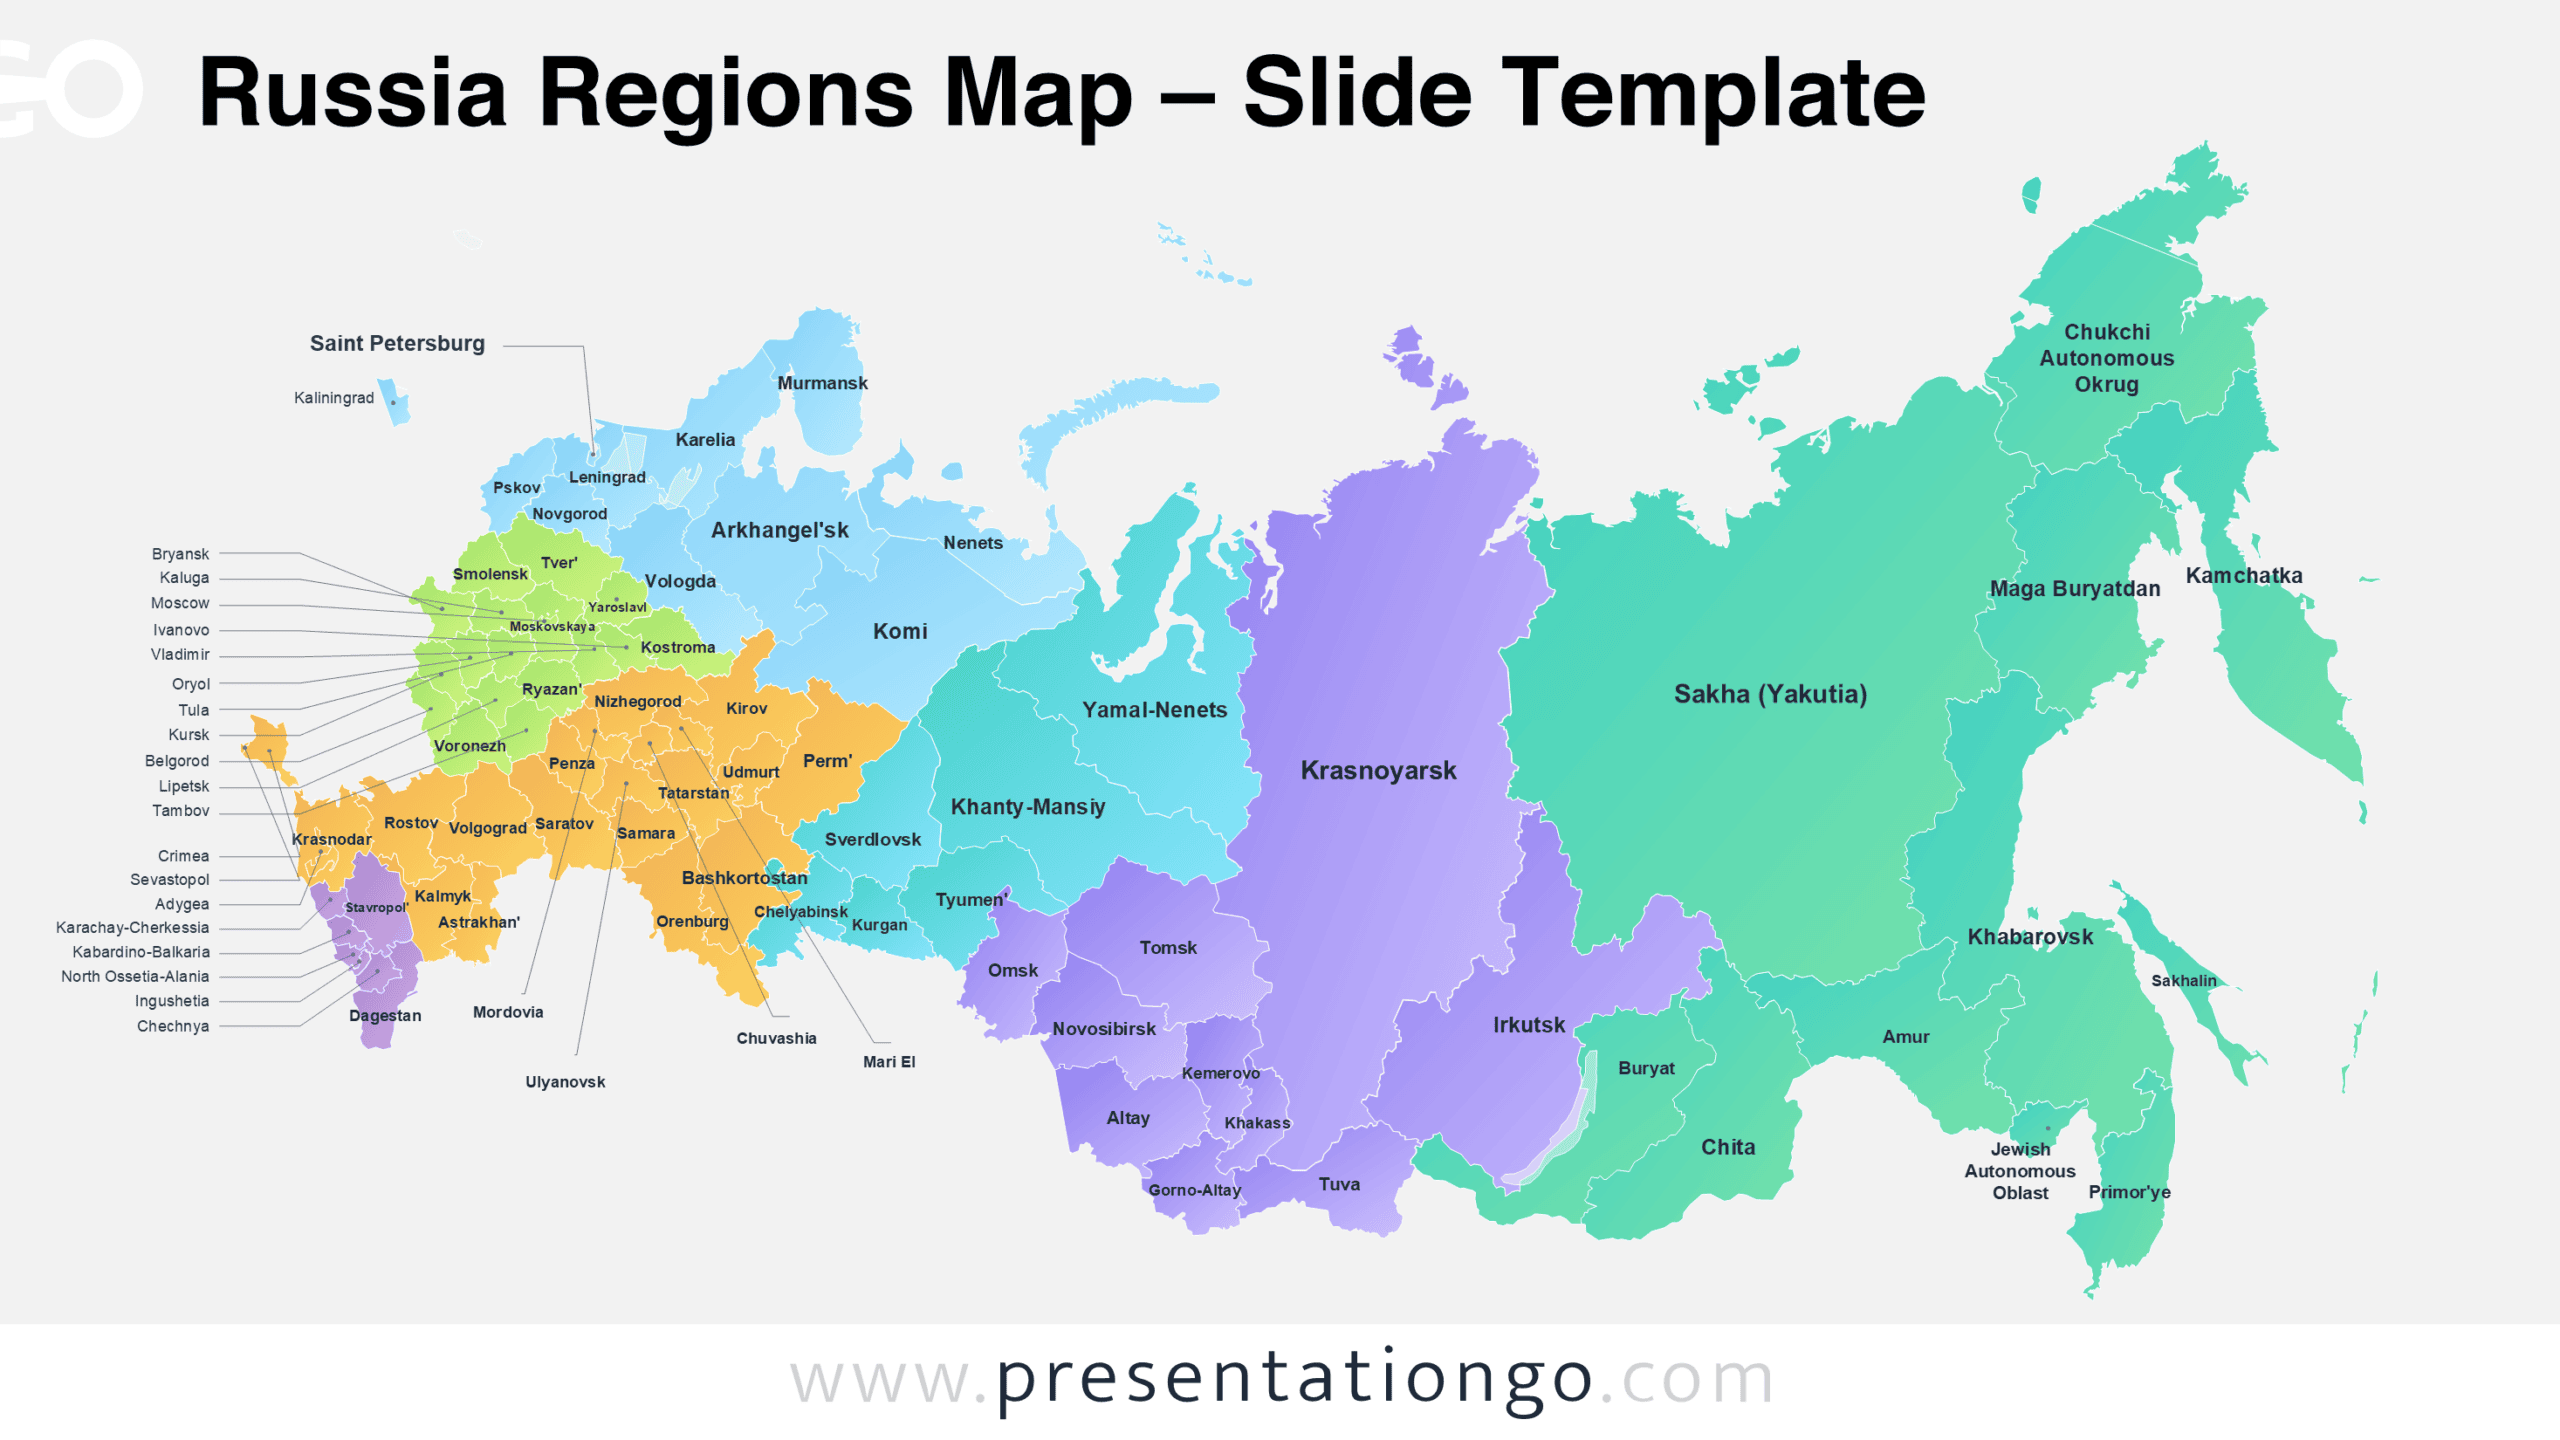
Download Russia Regions Map, a free editable map for PowerPoint and Google Slides with labeled administrative areas and two presentation-ready slide versions.
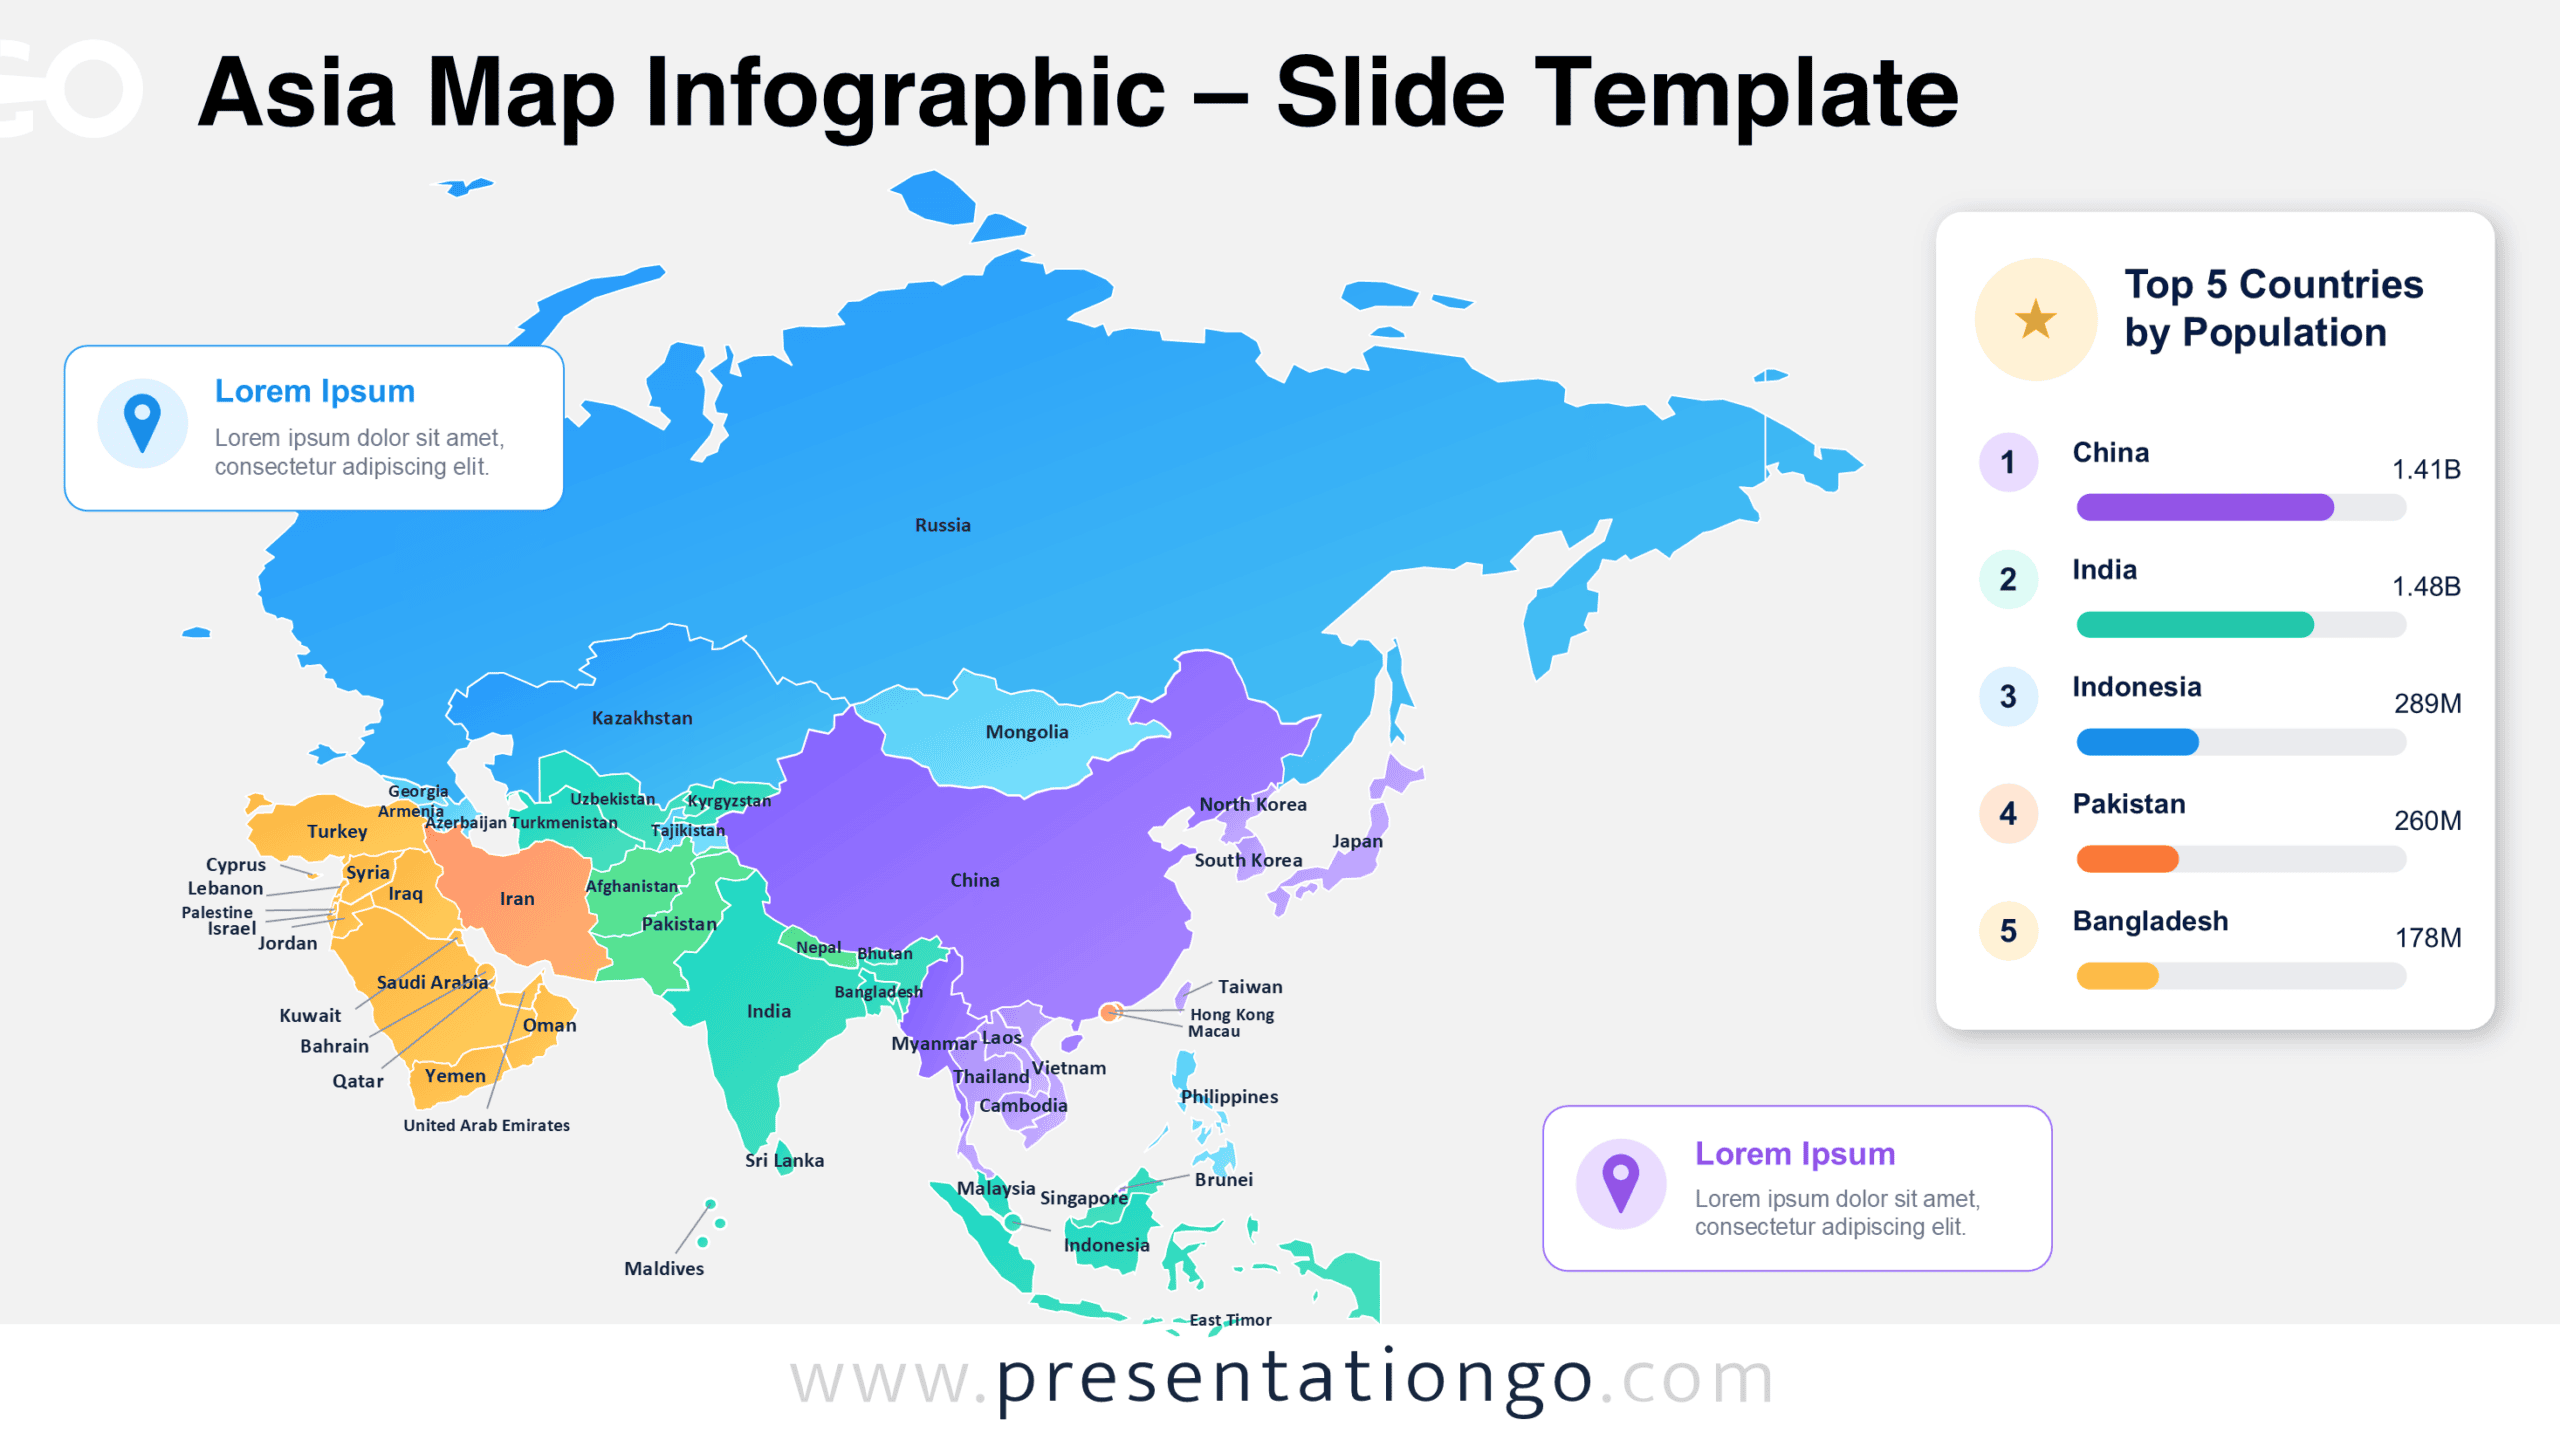
Present geographic information with the Asia Map Infographic. Customize country shapes, labels, location markers, and statistics in PowerPoint or Google Slides.
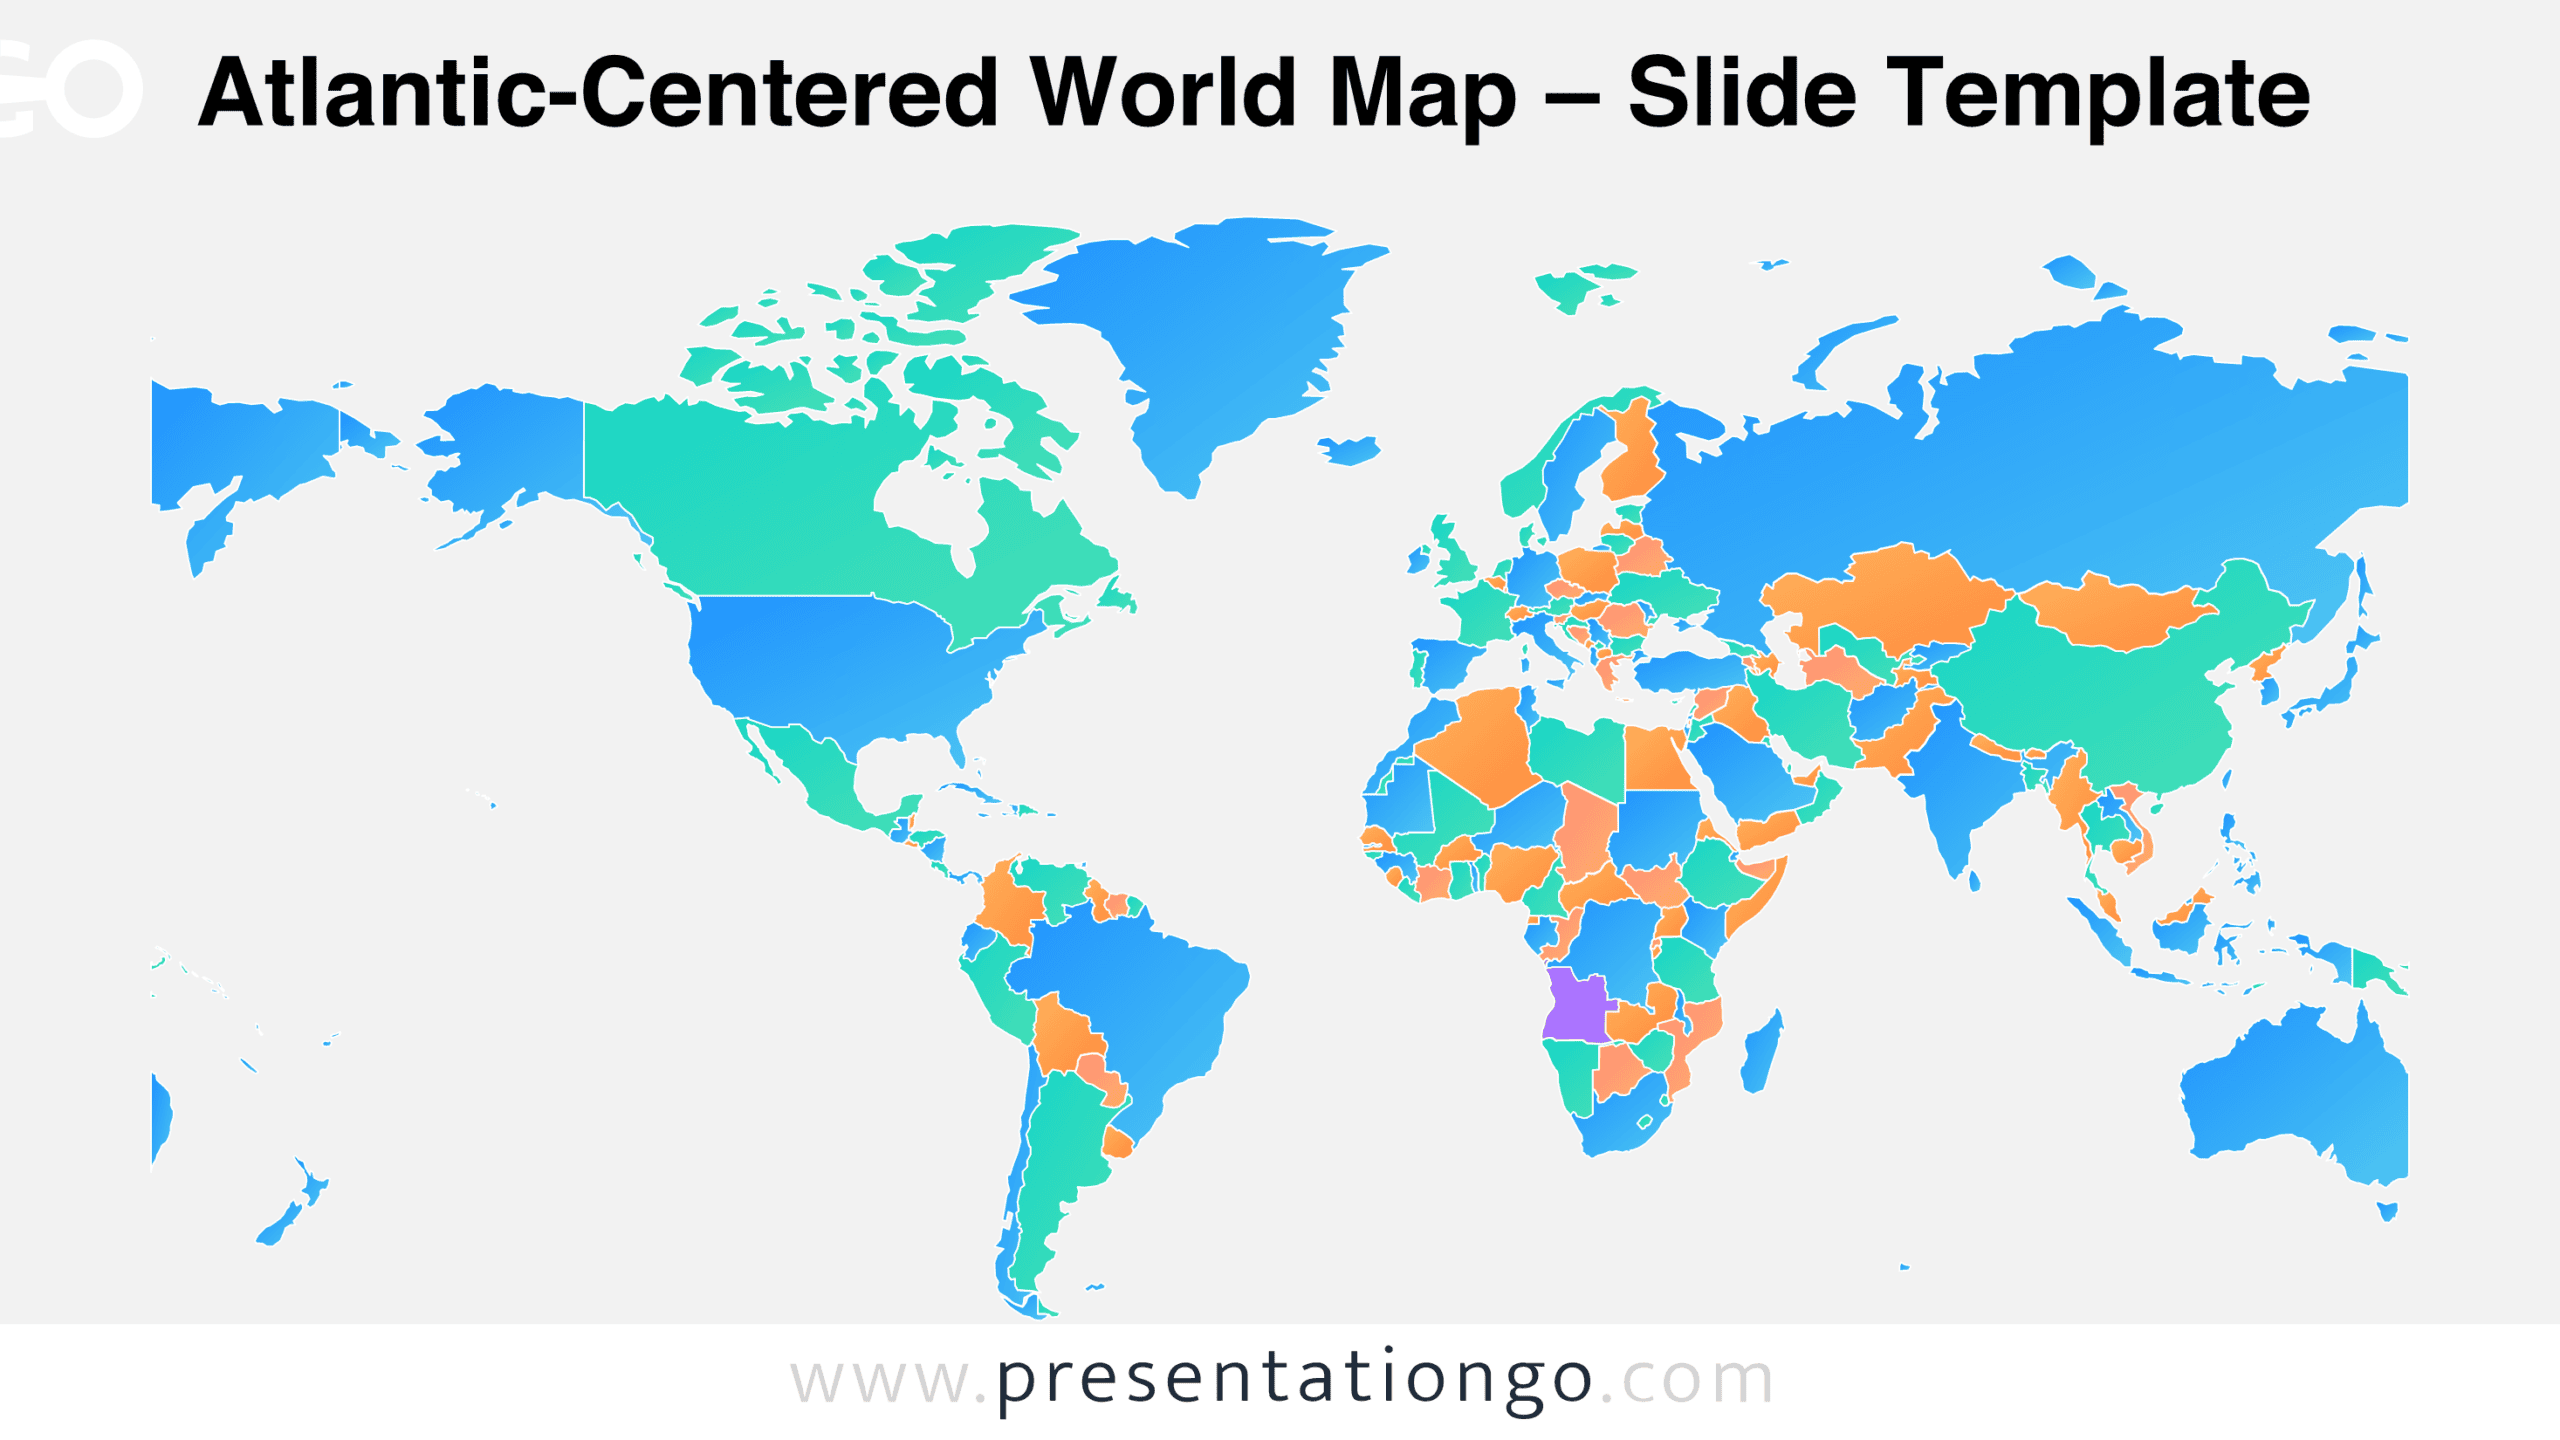
Download the Atlantic-Centered World Map for PowerPoint and Google Slides. Present country-level information with a detailed world layout and editable shapes.
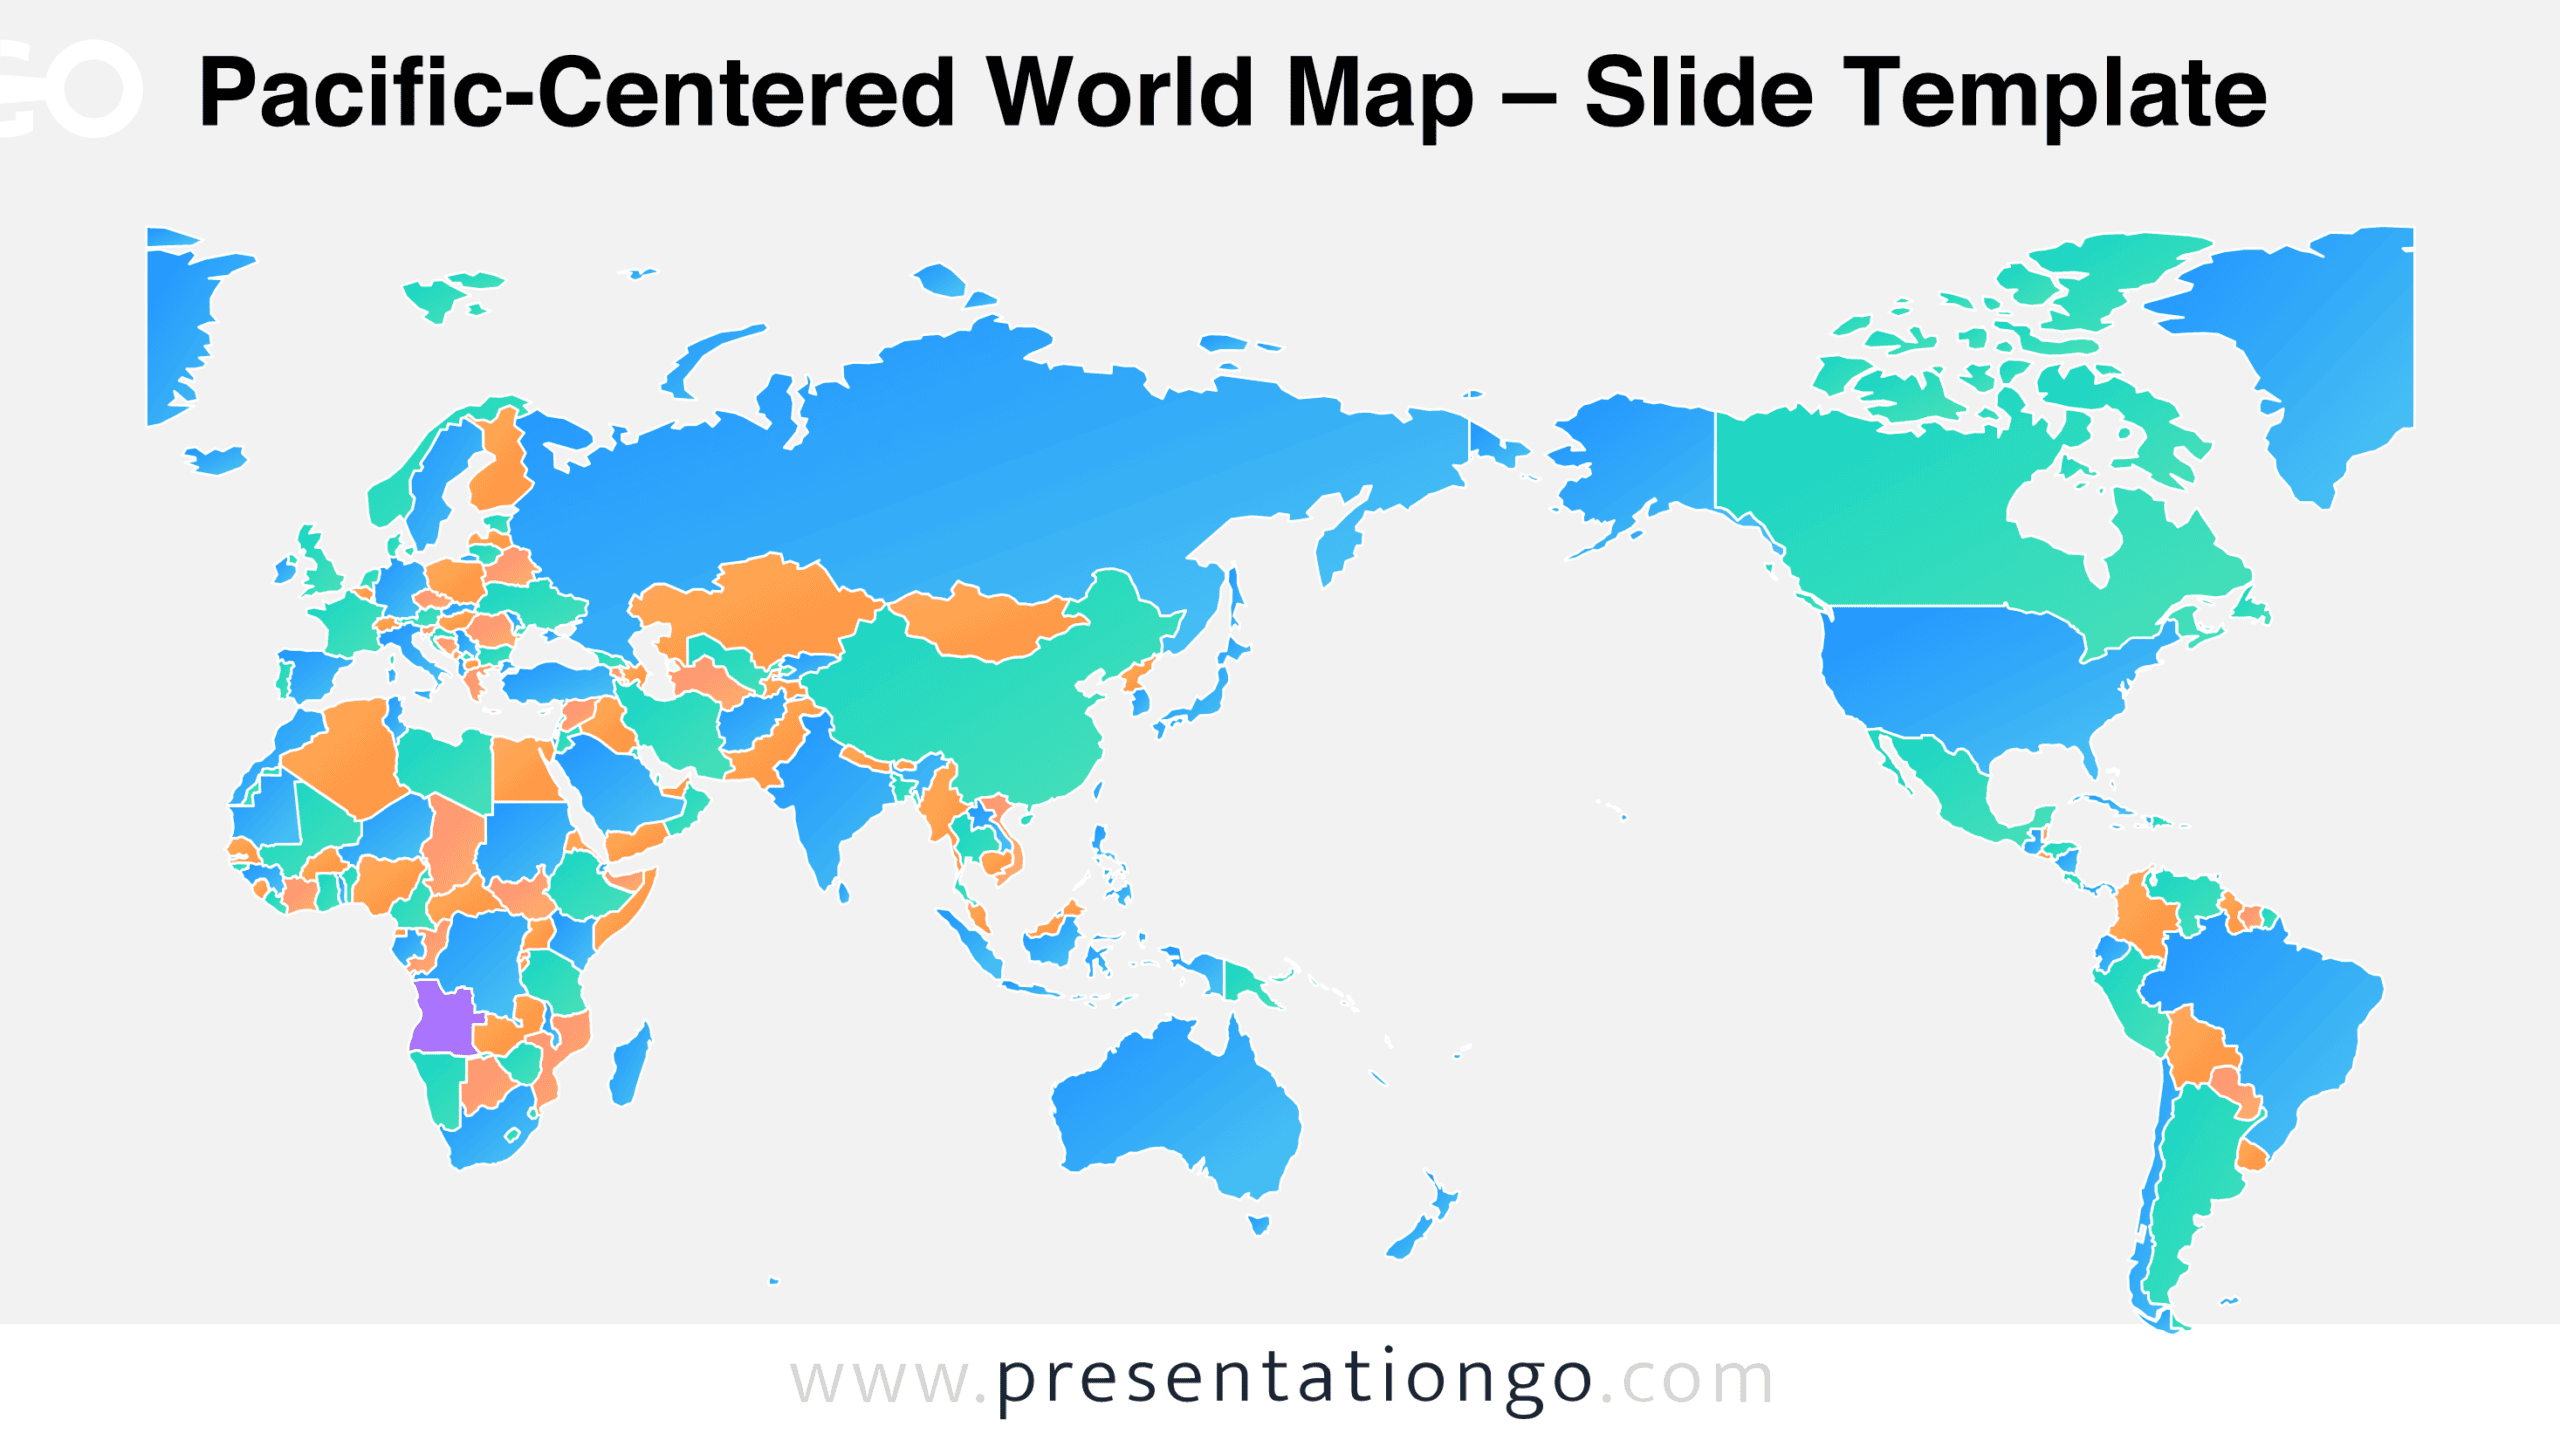
Download the free Pacific-Centered World Map for PowerPoint and Google Slides. Customize country shapes for geography lessons and international presentations.
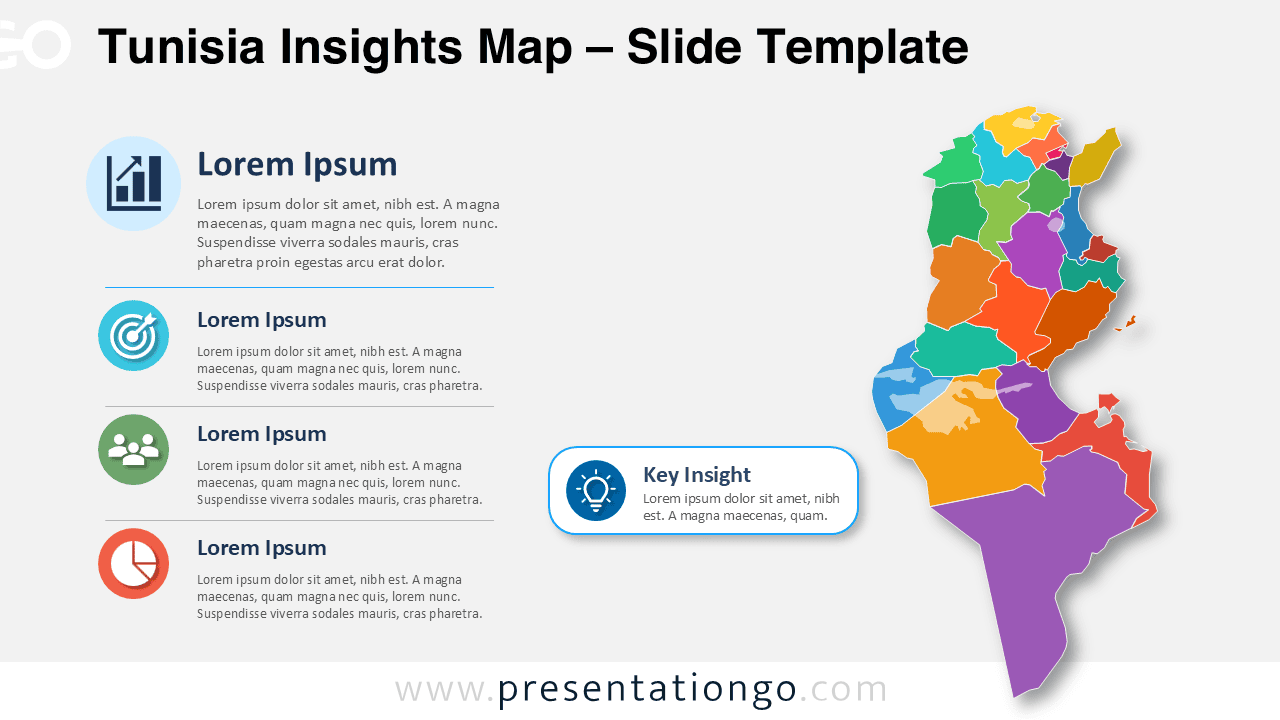
Use the Tunisia Insights Map to present regional data, market findings, and key messages in PowerPoint or Google Slides with fully editable elements.
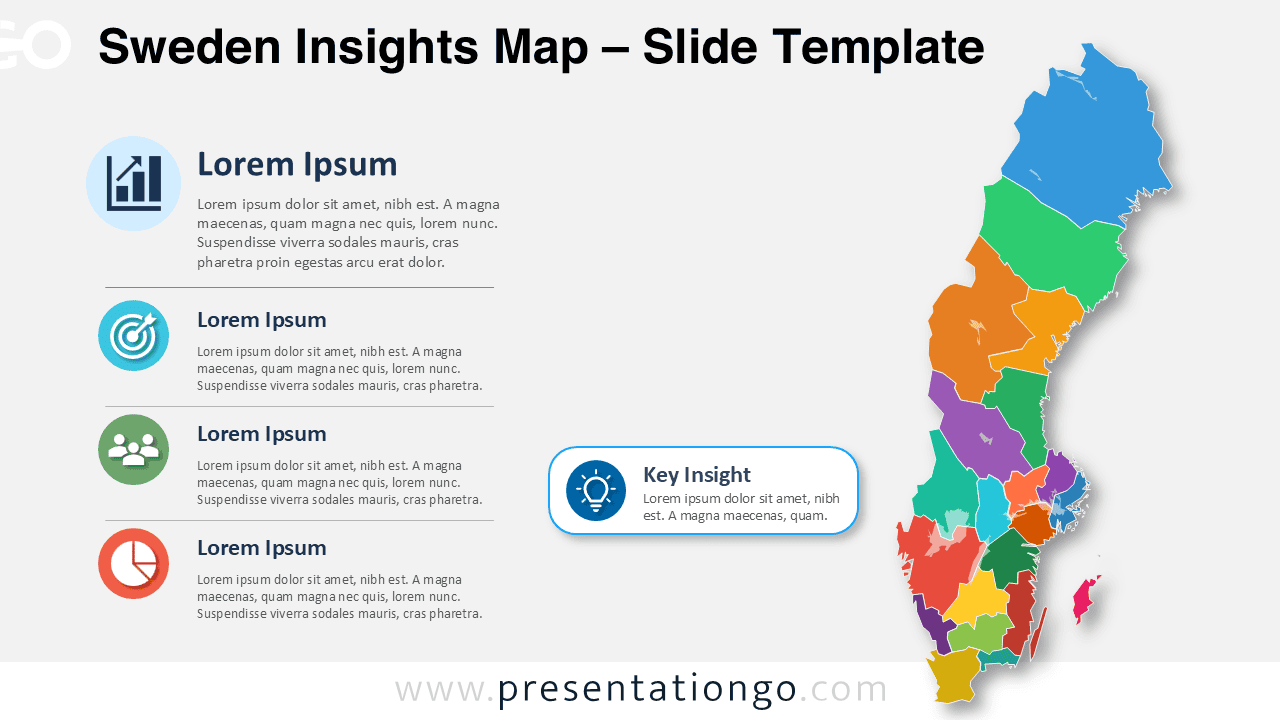
Download the Sweden Insights Map for PowerPoint and Google Slides to showcase regional statistics, business insights, and key findings clearly.
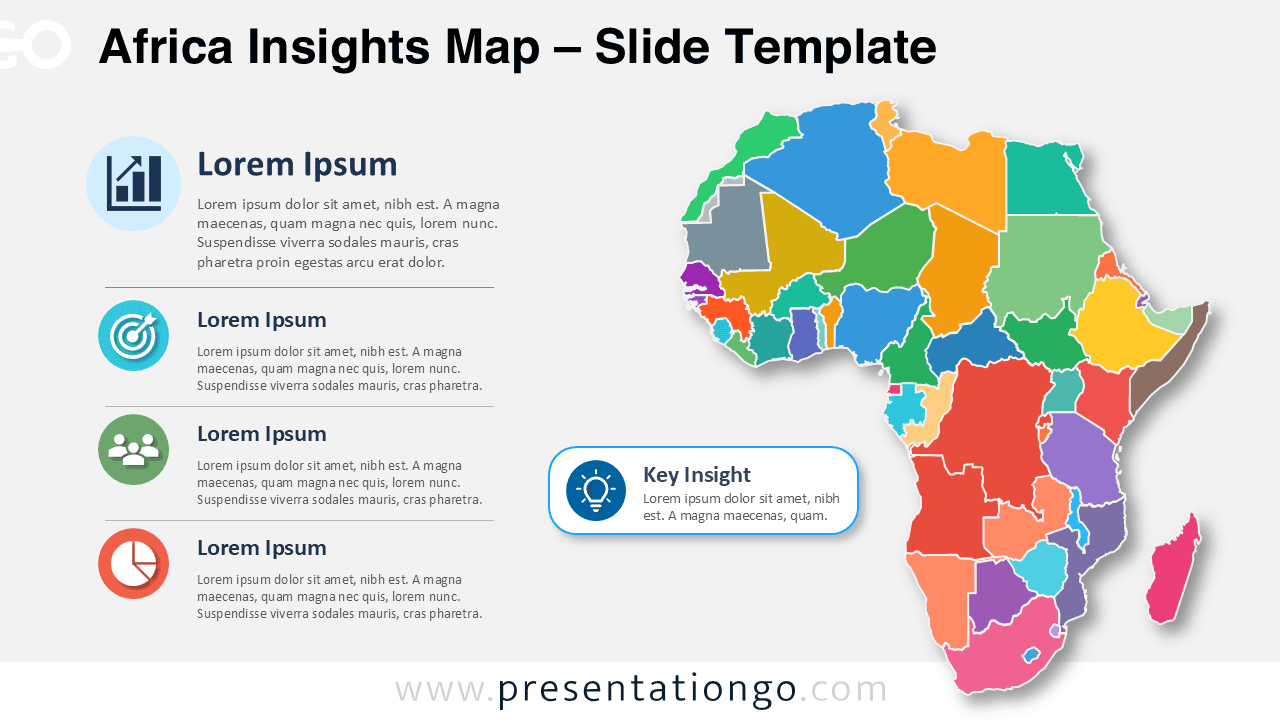
Download the Africa Insights Map for PowerPoint and Google Slides to present regional analysis, market findings, and country-level insights.
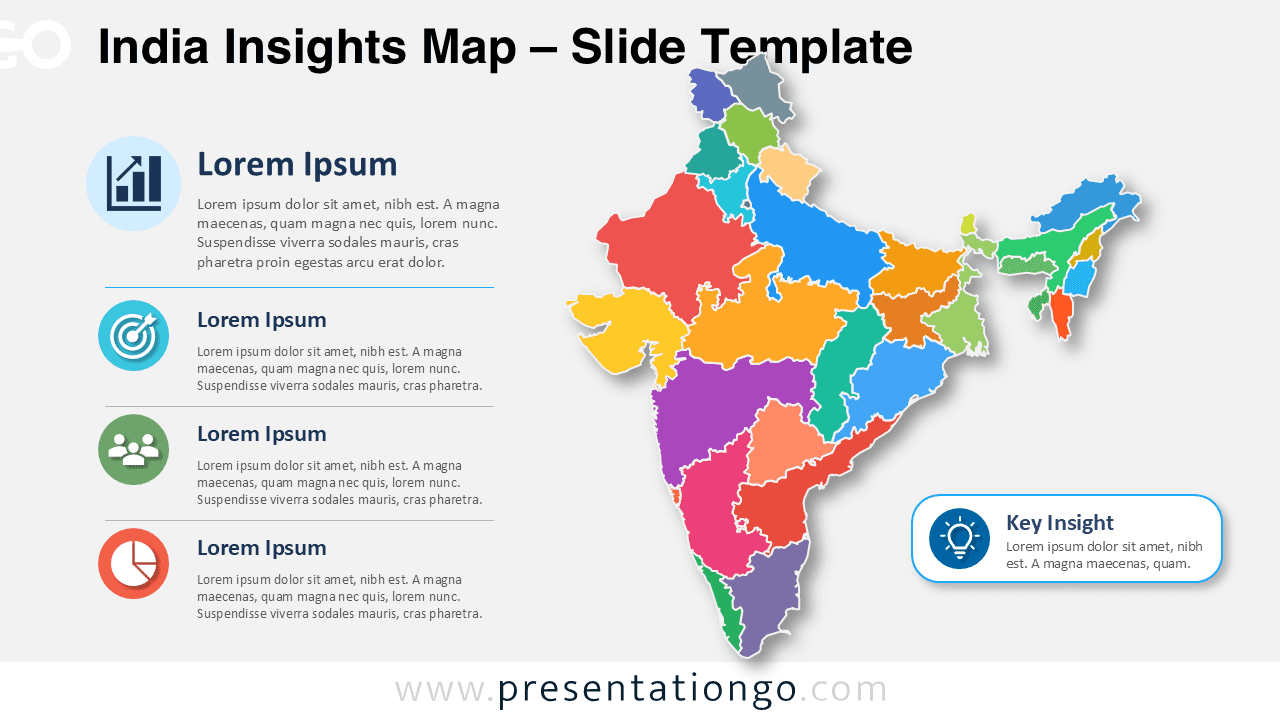
Download the India Insights Map for PowerPoint and Google Slides. Edit the India map, change colors, update text, and customize Office icons for reports.
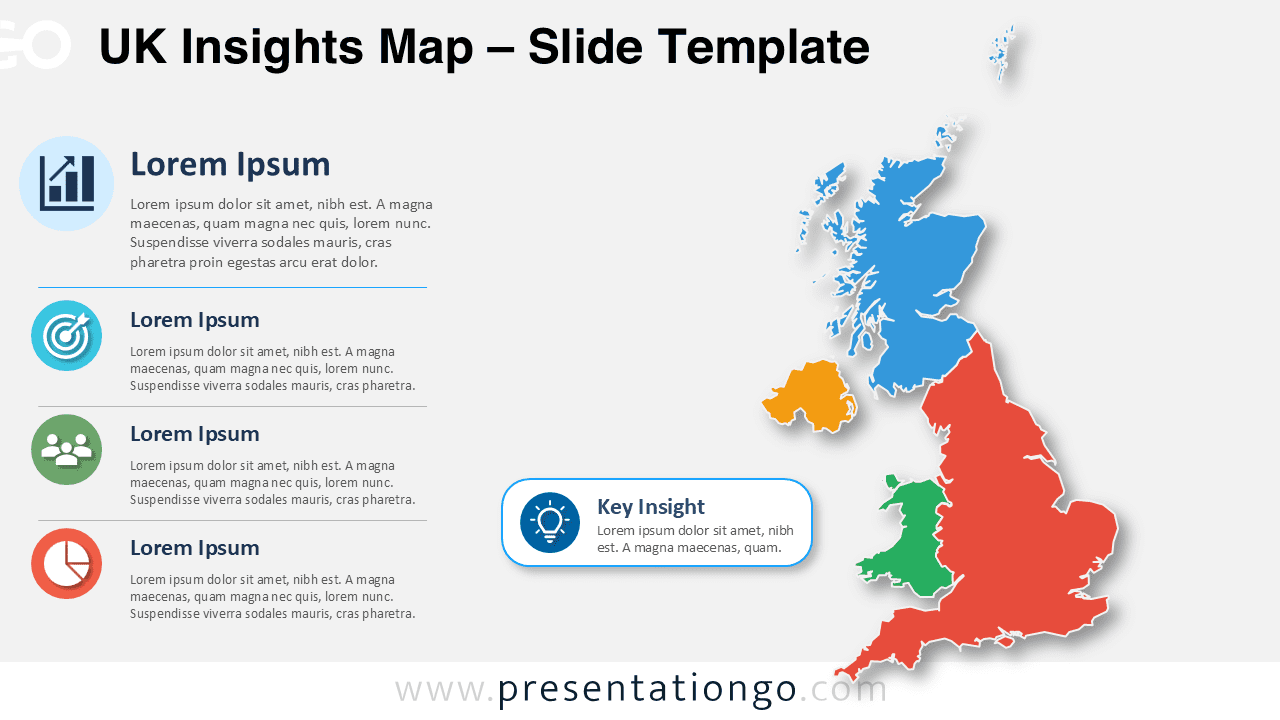
Download the free UK Insights Map for PowerPoint and Google Slides. Edit the UK map, Office icons, callout, and text for regional business analysis tasks.
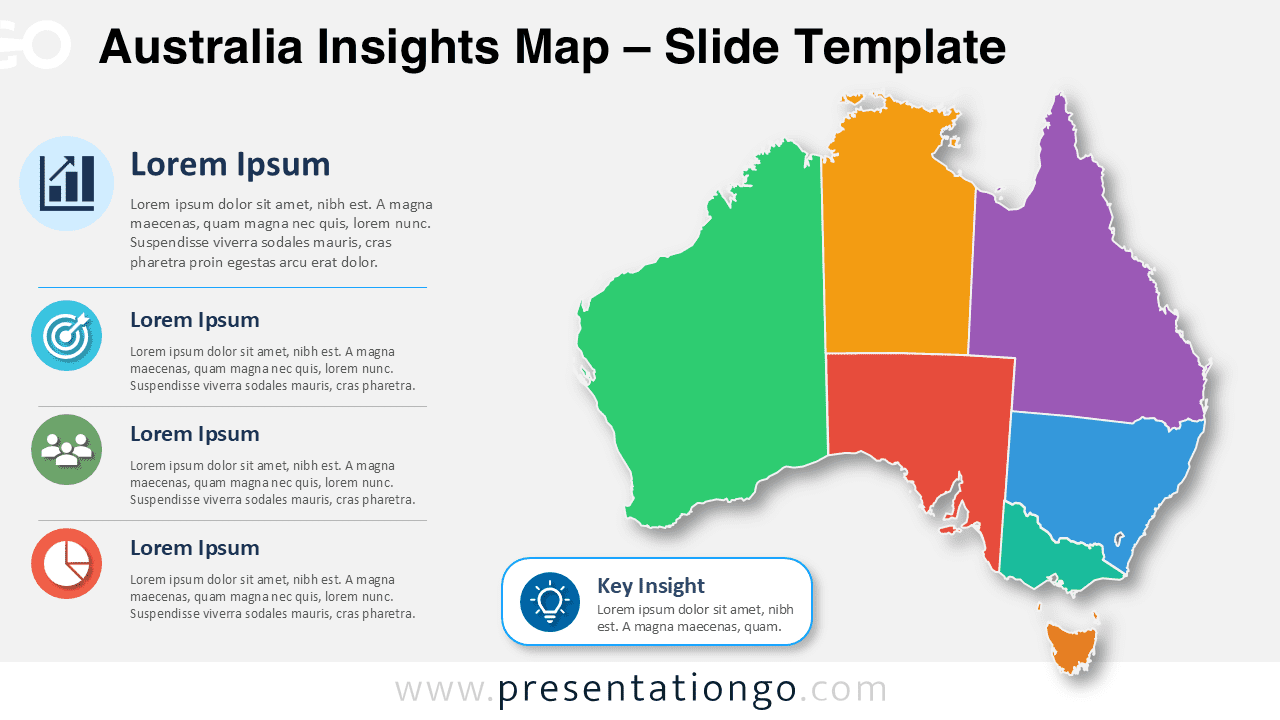
Show business insights across Australia with an editable map for PowerPoint and Google Slides, including callouts and Office library icons for reports.
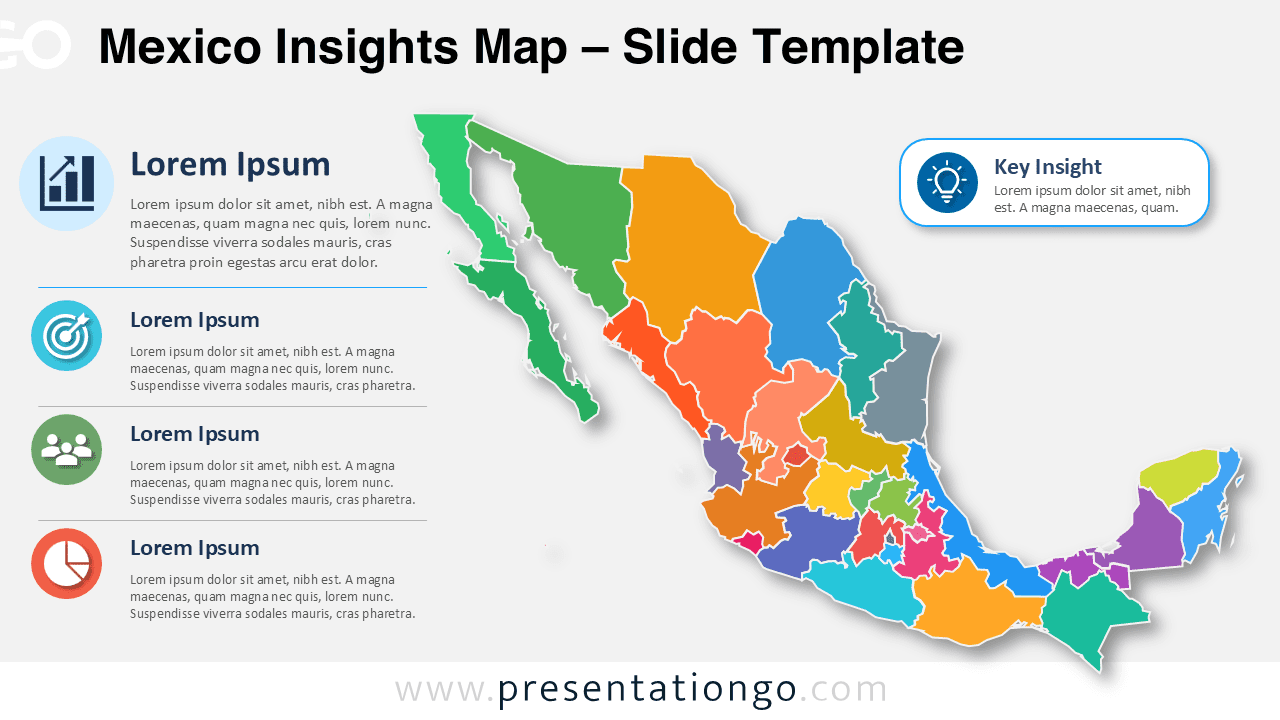
Download the Mexico Insights Map for PowerPoint and Google Slides. Edit the map, labels, Office icons, and callouts for regional analysis reports and plans.
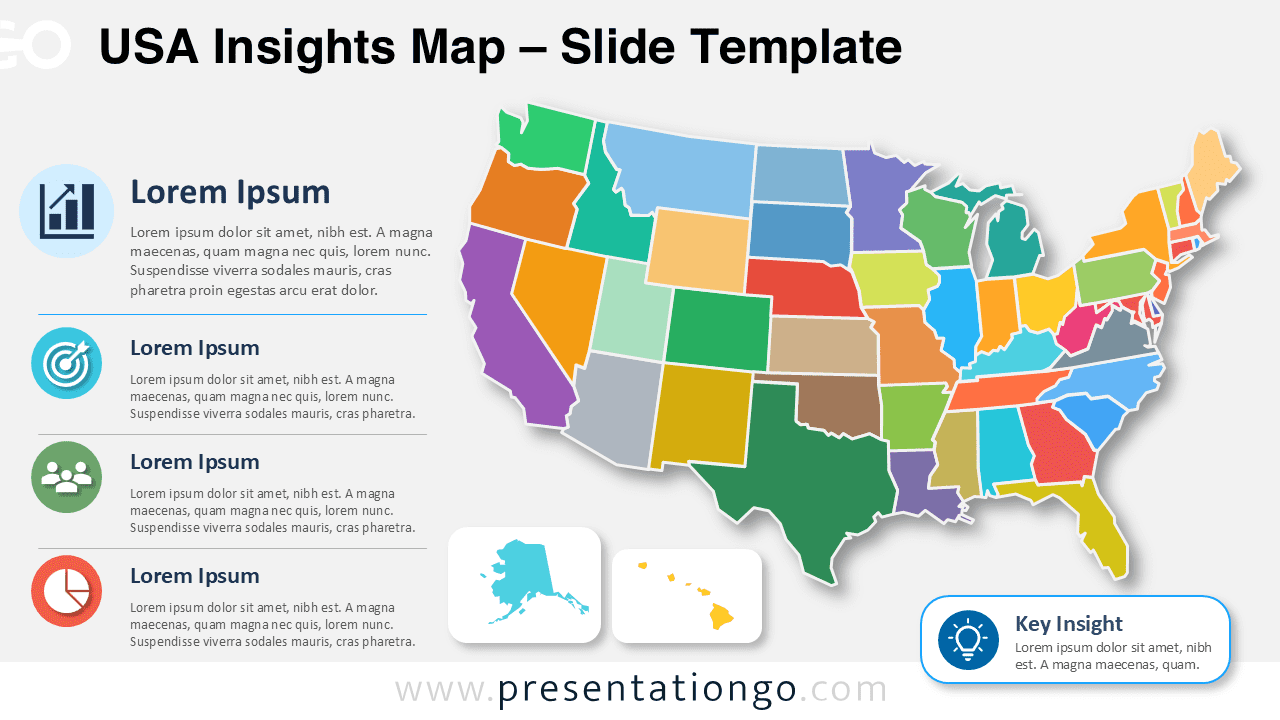
Download the USA Insights Map for PowerPoint and Google Slides. Edit each state, customize labels, and present clear regional data with icons and confidence.
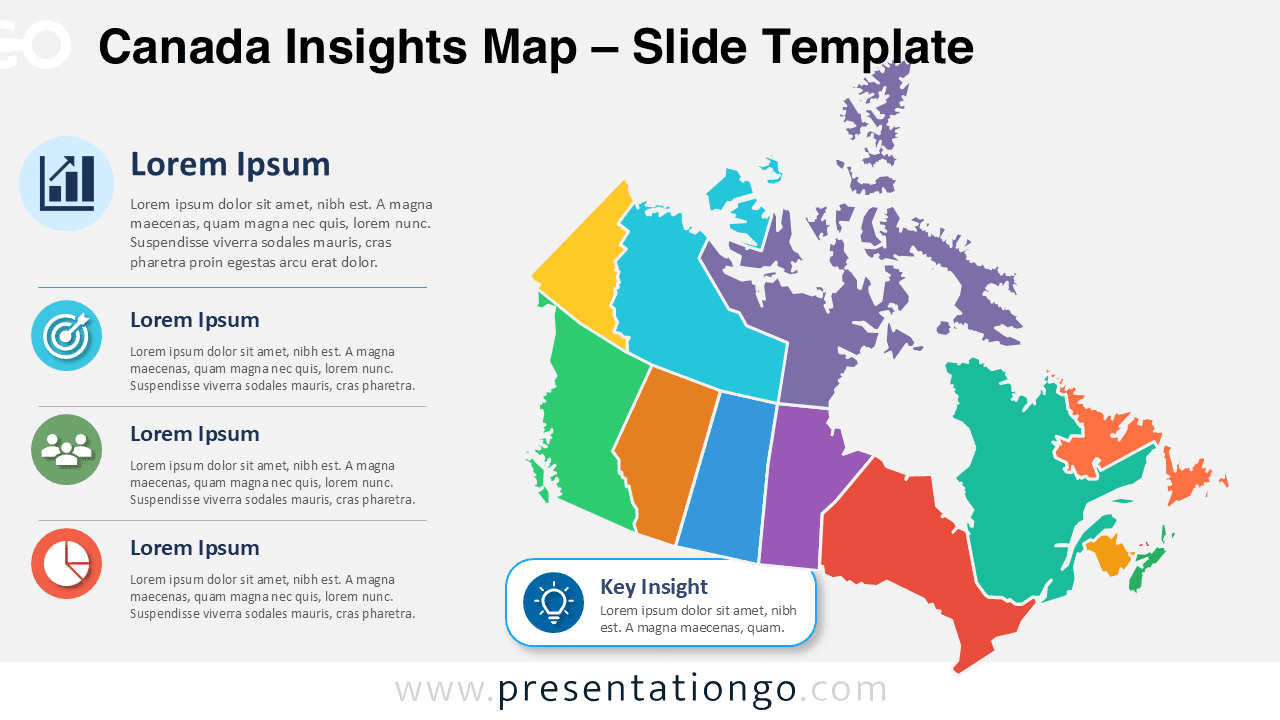
Download the Canada Insights Map for PowerPoint and Google Slides. Edit regions, icons, labels, and callouts for clear regional analysis and reports.
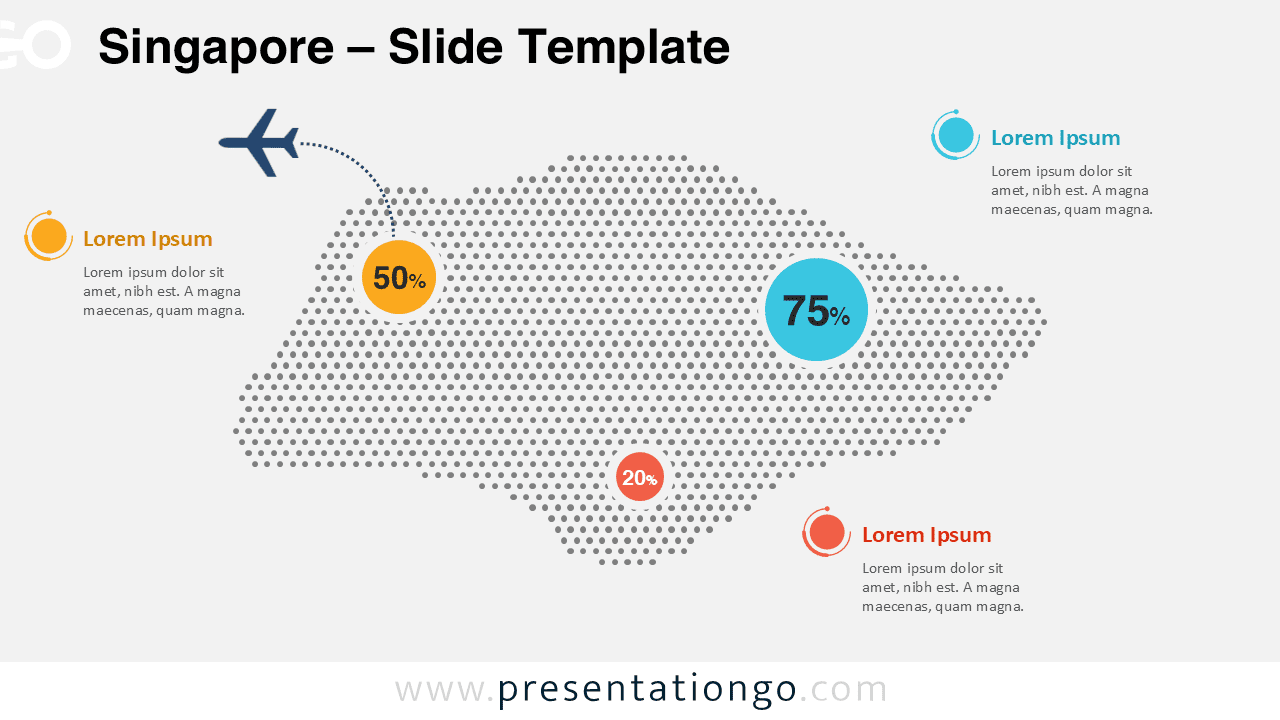
Use this free Singapore Dotted Map Infographic in PowerPoint and Google Slides to showcase demographics, tourism figures, business reach, and key areas.
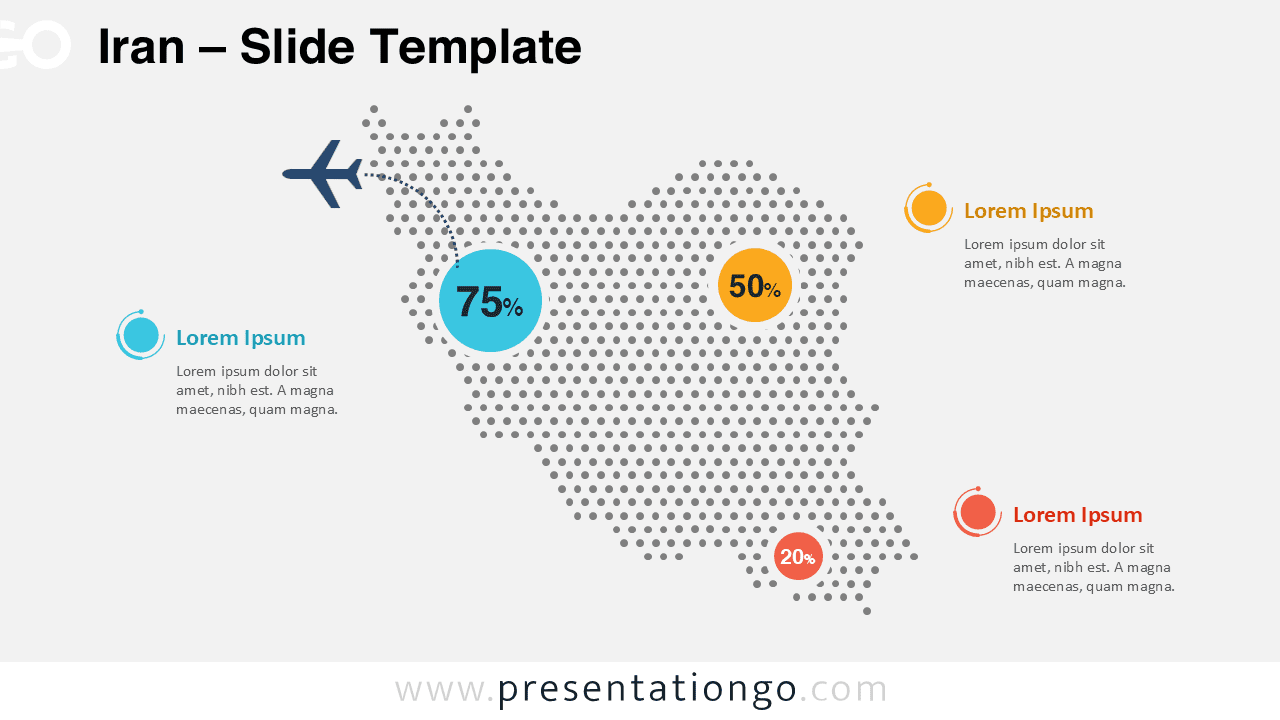
Show Iran data by region with this free dotted map for PowerPoint and Google Slides. Edit colors, labels, and callouts for any topic or industry focus.
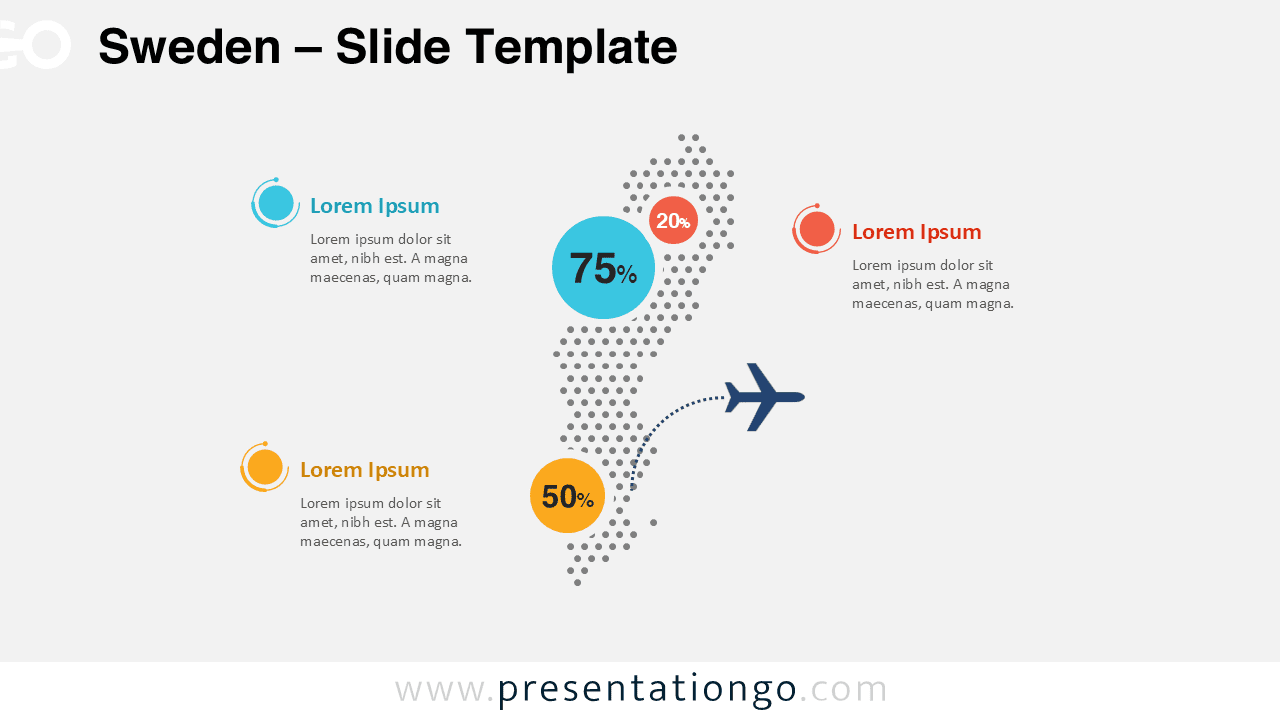
Download this free Sweden Dotted Map Infographic for PowerPoint and Google Slides. Highlight regions, statistics, travel routes, and market data fast.
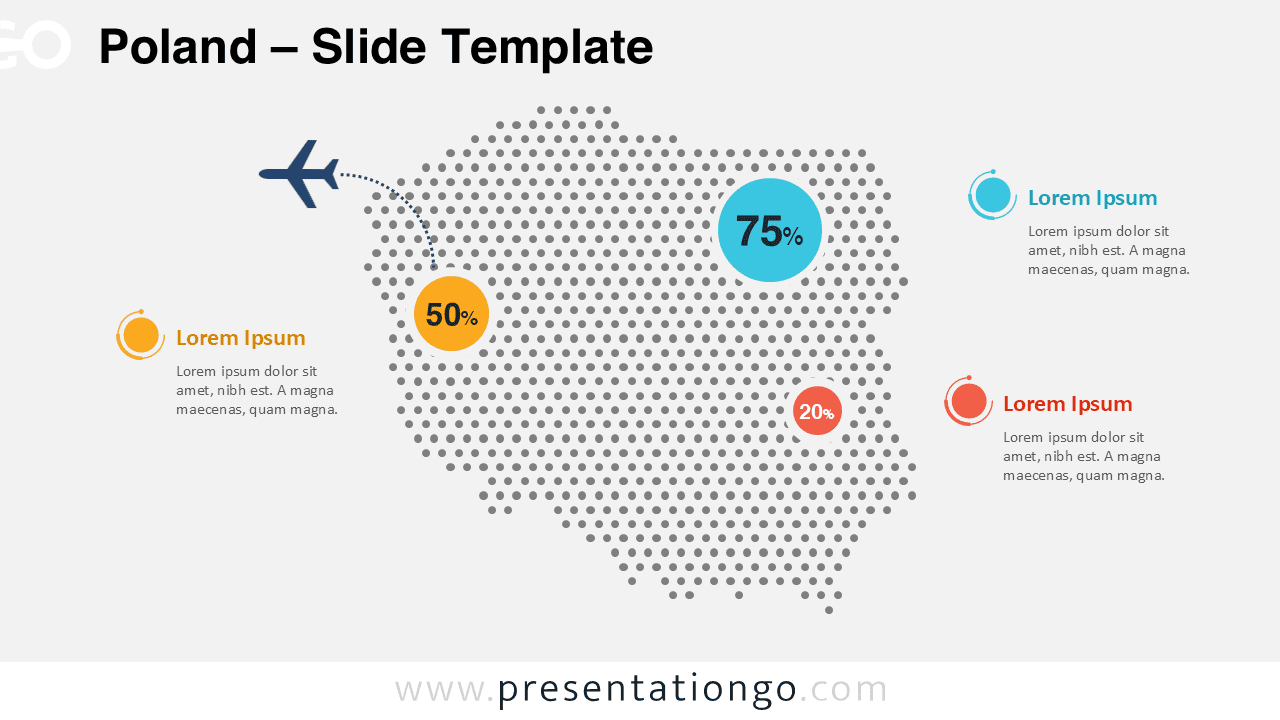
Download the free Poland Dotted Map Infographic for PowerPoint and Google Slides. Showcase regional data, travel routes, and location insights clearly.
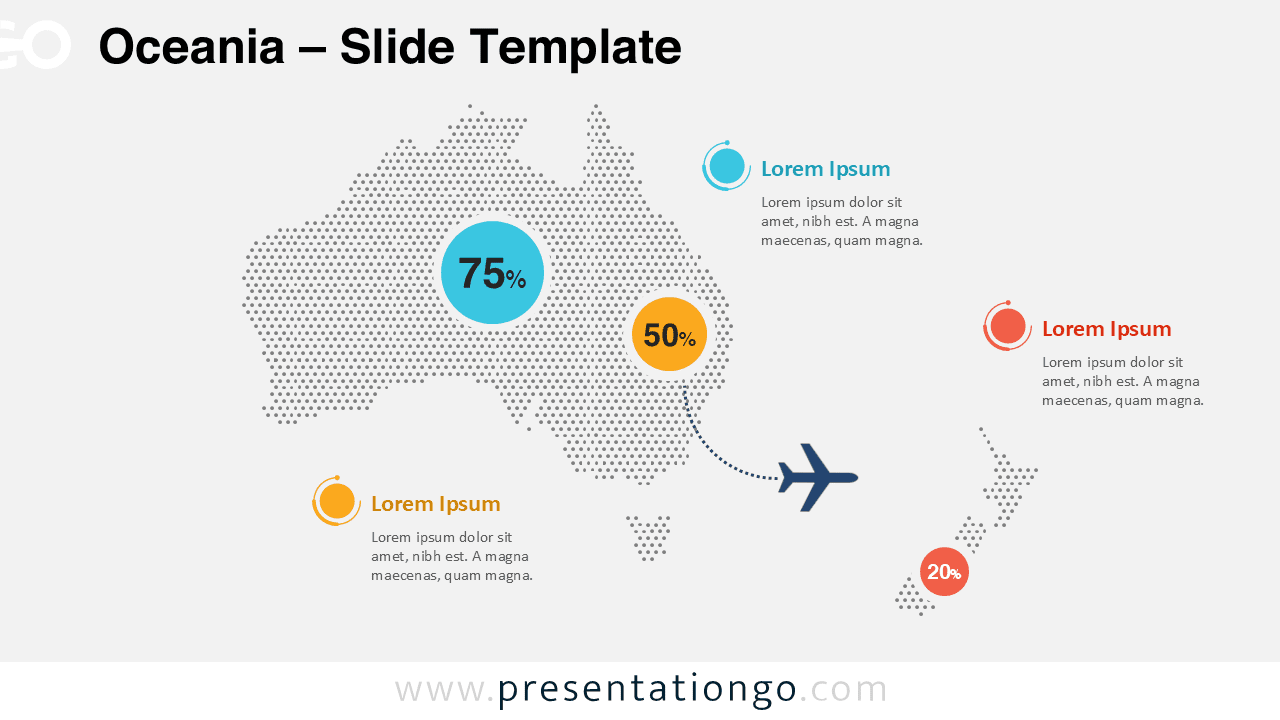
Download the free Oceania dotted map infographic for PowerPoint and Google Slides. Edit colors, data points, and labels for regional presentations today.
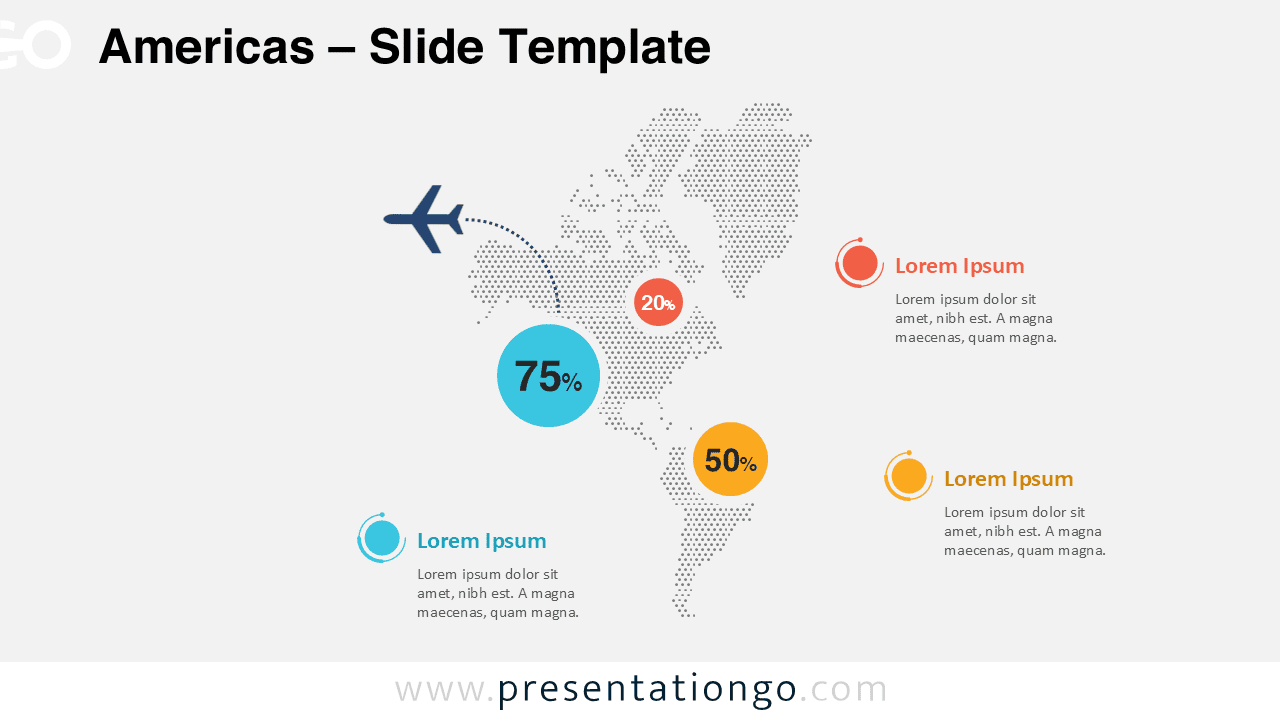
Highlight data across North and South America using this modern dotted map infographic designed for PowerPoint and Google Slides presentations.
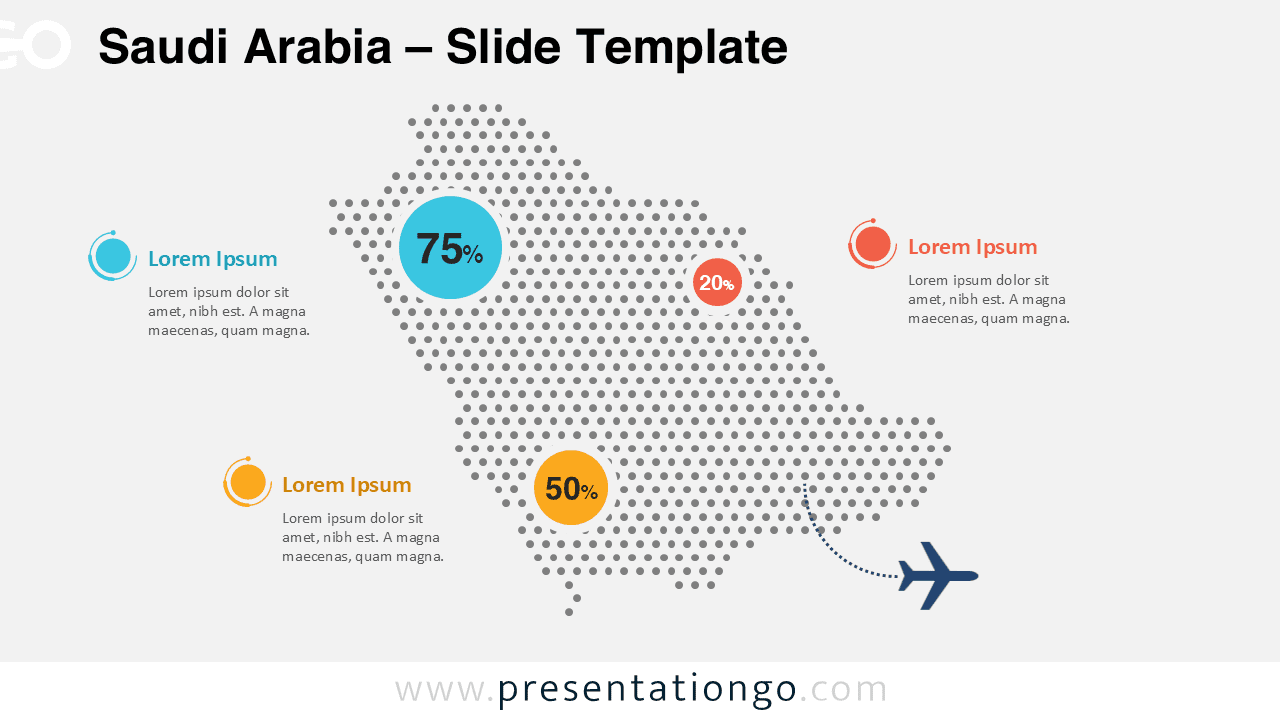
Free Saudi Arabia dotted map infographic for PowerPoint and Google Slides. Highlight locations, statistics, and regional information with a modern layout.
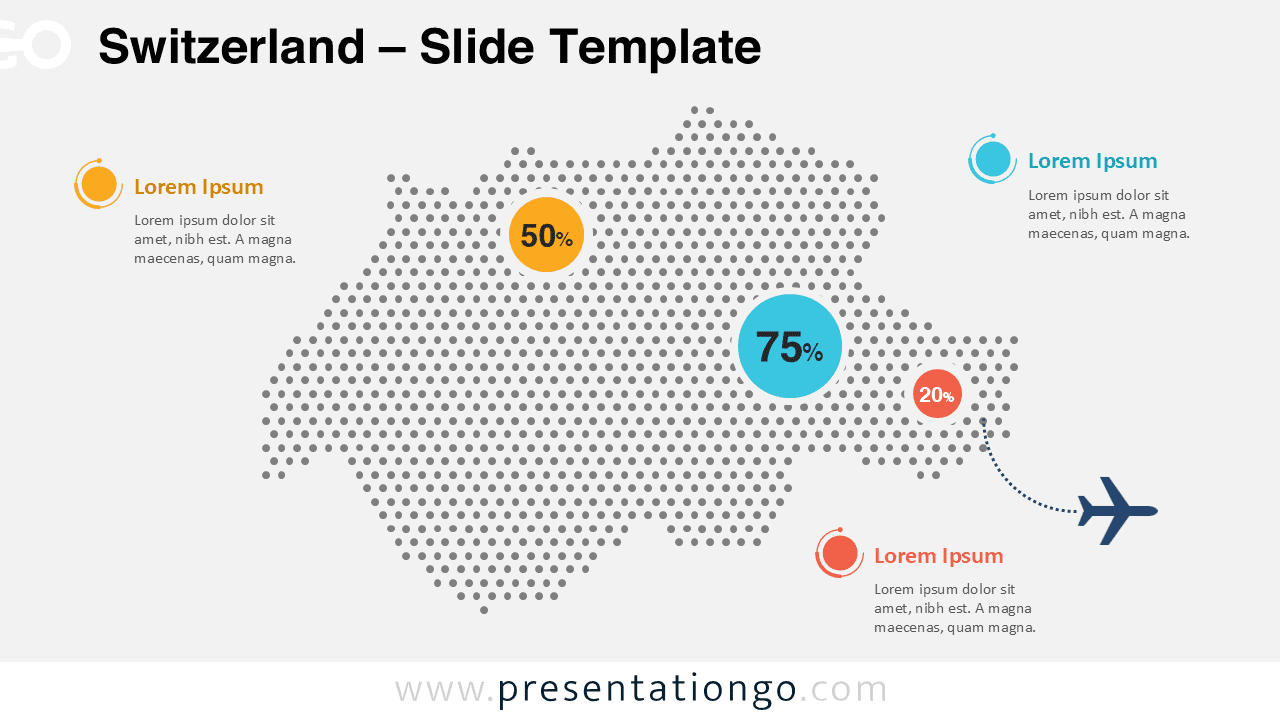
Download this Switzerland dotted map infographic for PowerPoint and Google Slides. Highlight regions, statistics, and geographic insights with editable markers.
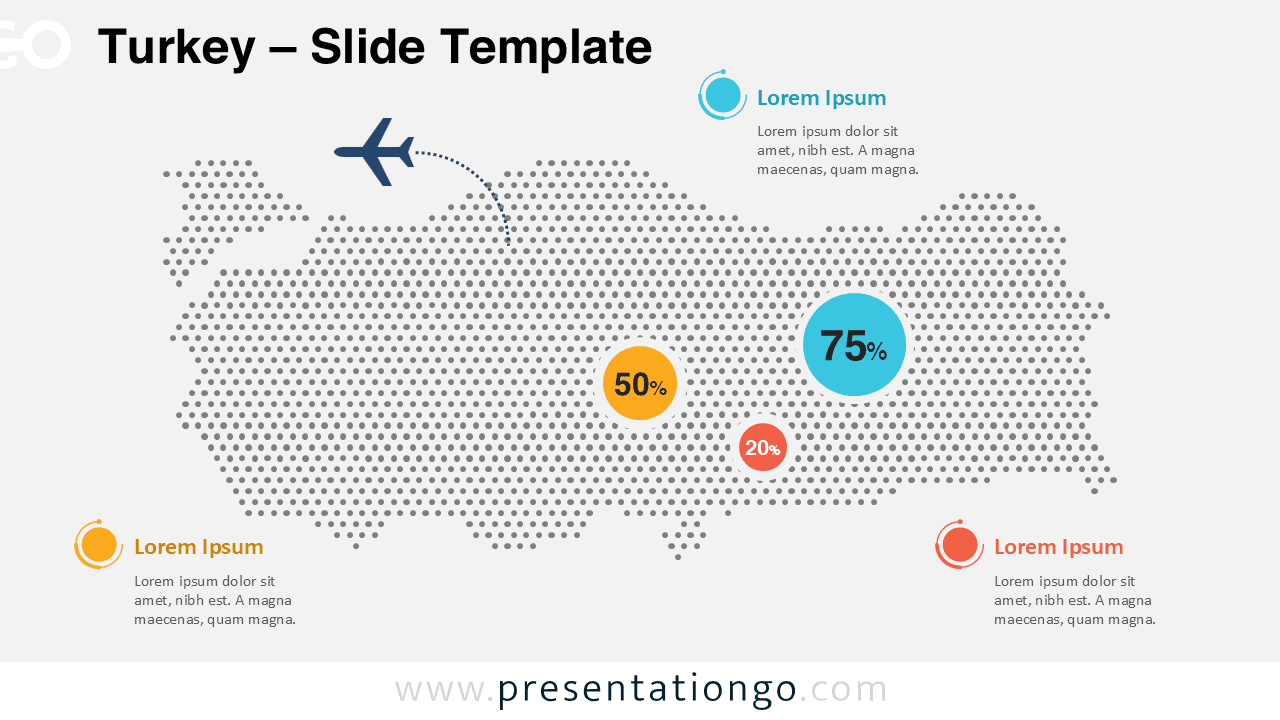
Download this Turkey Dotted Map Infographic for PowerPoint and Google Slides. Visualize geographic data, regional insights, and statistics with a modern dot map.
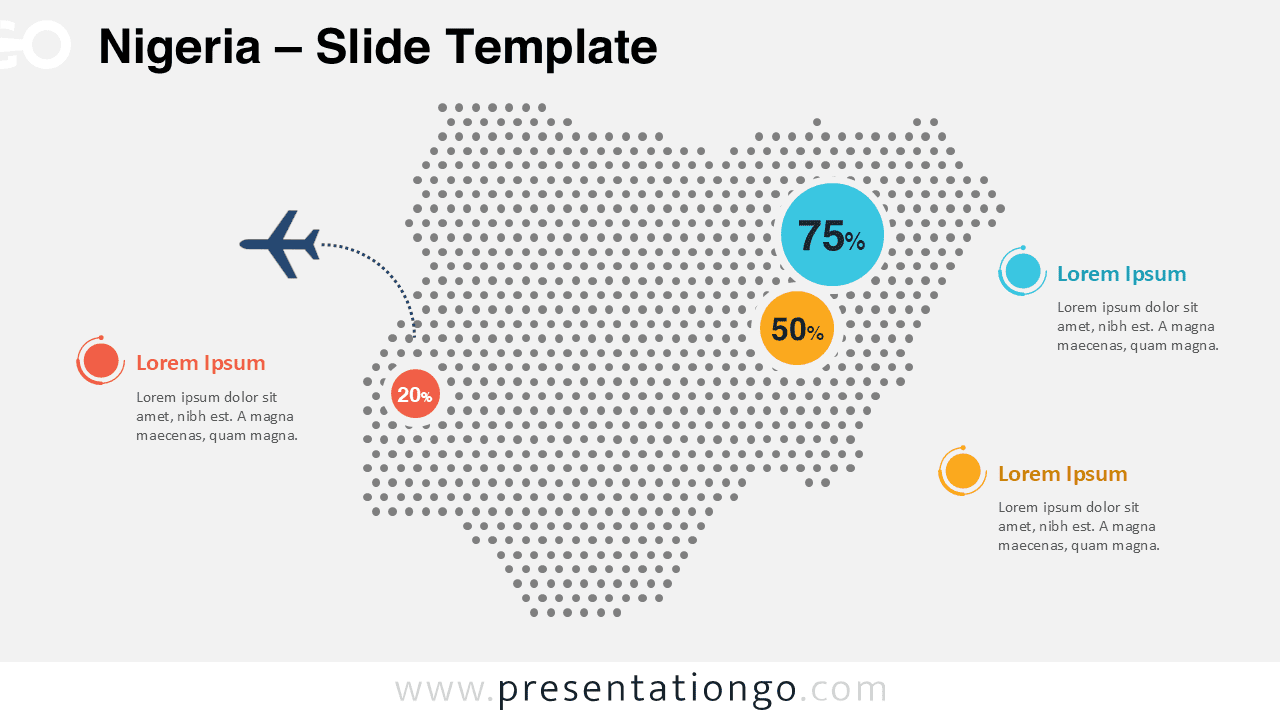
Download this Nigeria dotted map infographic for PowerPoint and Google Slides. Ideal for presenting regional data, statistics, travel routes, or market insights.
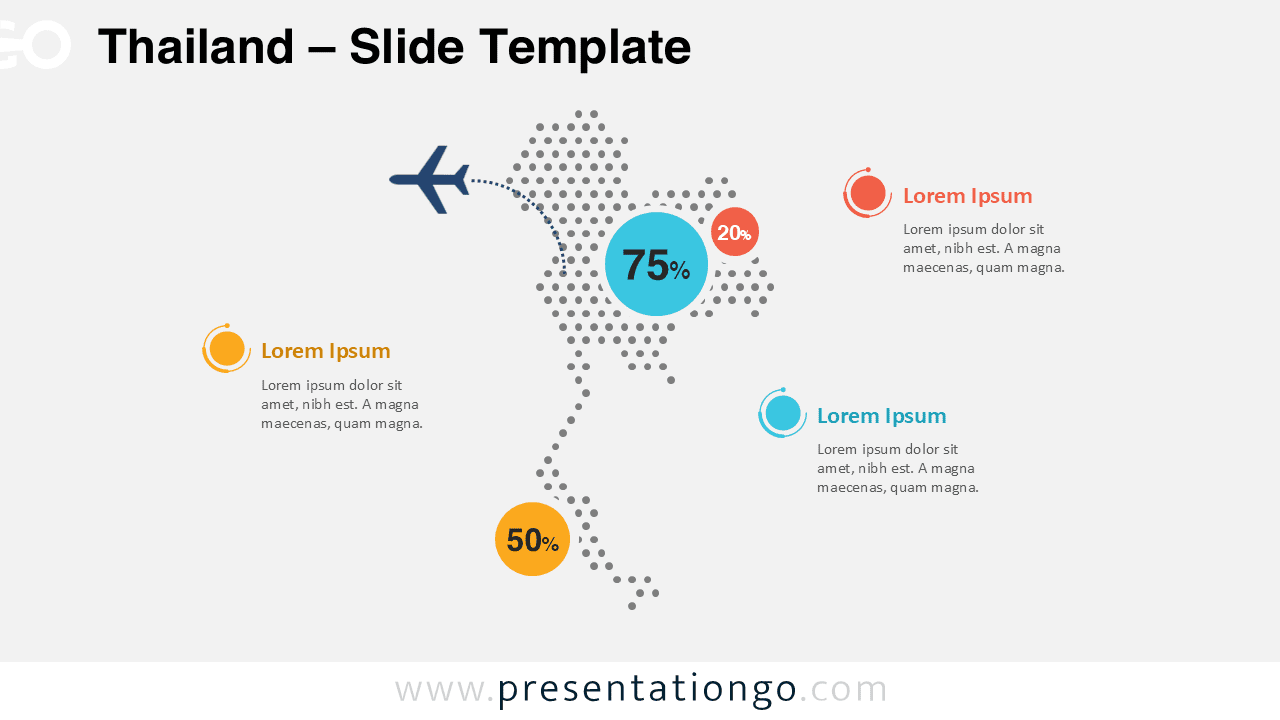
Download the Thailand Dotted Map Infographic for PowerPoint and Google Slides. Perfect for tourism, business reports, and geographic data visualization.