 100% 무료
Rounded Column Chart for PowerPoint and Google Slides
Free rounded column chart for PowerPoint and Google Slides. A non-data-driven chart alternative to the regular column chart design.
템플릿 상세
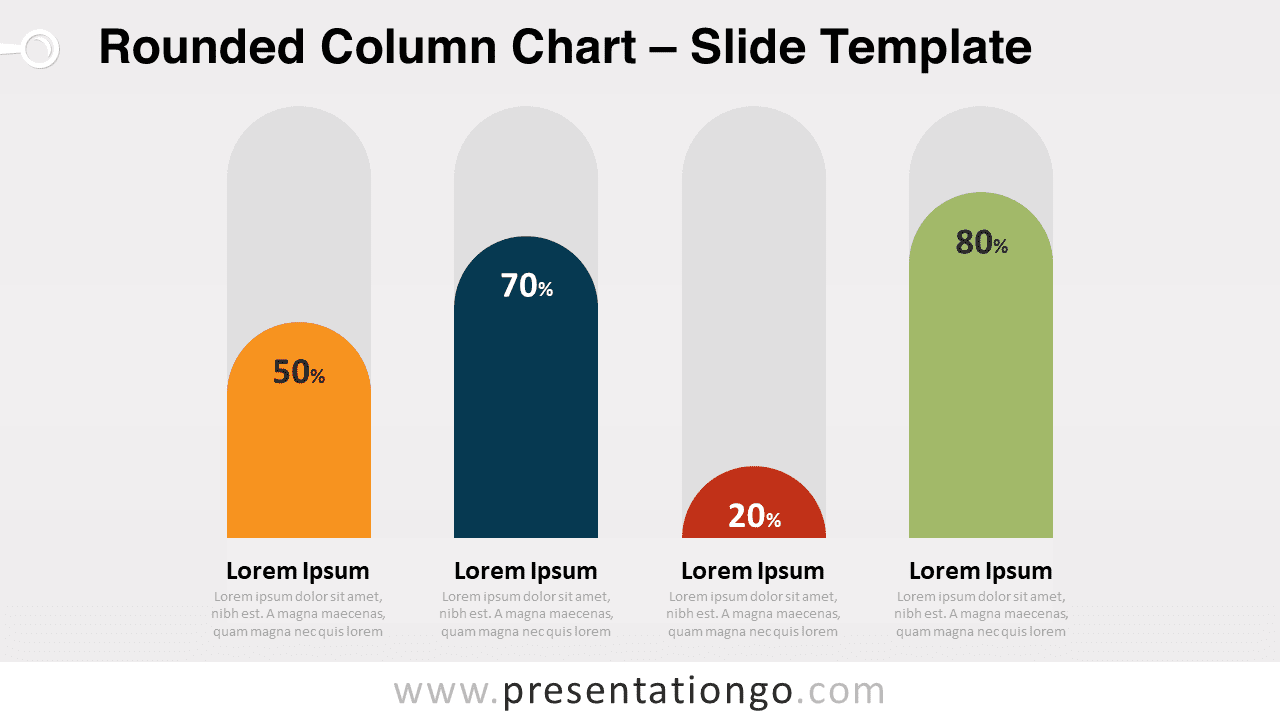
Free rounded column chart for PowerPoint and Google Slides. A non-data-driven chart alternative to the regular column chart design. Editable graphics with percentage and text placeholders. Solid and creative visual aids will be the extra feature that will end up convincing your colleagues and clients! So download and share this free Rounded Column Chart template with your audience! More specifically, this simple yet powerful infographic slide shows 4 rounded columns of different heights. Besides, each one has a distinctive color to make clear comparisons between numbers, percentages, or any quantitative results. Furthermore, you can include the actual number or percentage inside each column. Lastly, you can explain these numbers thanks to the title and text placeholders below each column. Data visualization is a key tool in your interaction with your audience. That is why this free Rounded Column Chart template is perfect to illustrate and make comparisons between 4 quantitative results. Click and move up/down the circle shape on top of the column chart. A ruler on the left side (outside of the view) will help you adapt the height (from 10 to 100).
- 출처
- PresentationGo
- 형식
- pptx
- 파일 크기
- 69 KB
- 다운로드
- 0
- 슬라이드 수
- 2
- 비율
- 16:9
제작자 / 저작권:PresentationGo
원본 링크:PresentationGo original