 100% Free
Paint Brush Chart for PowerPoint and Google Slides
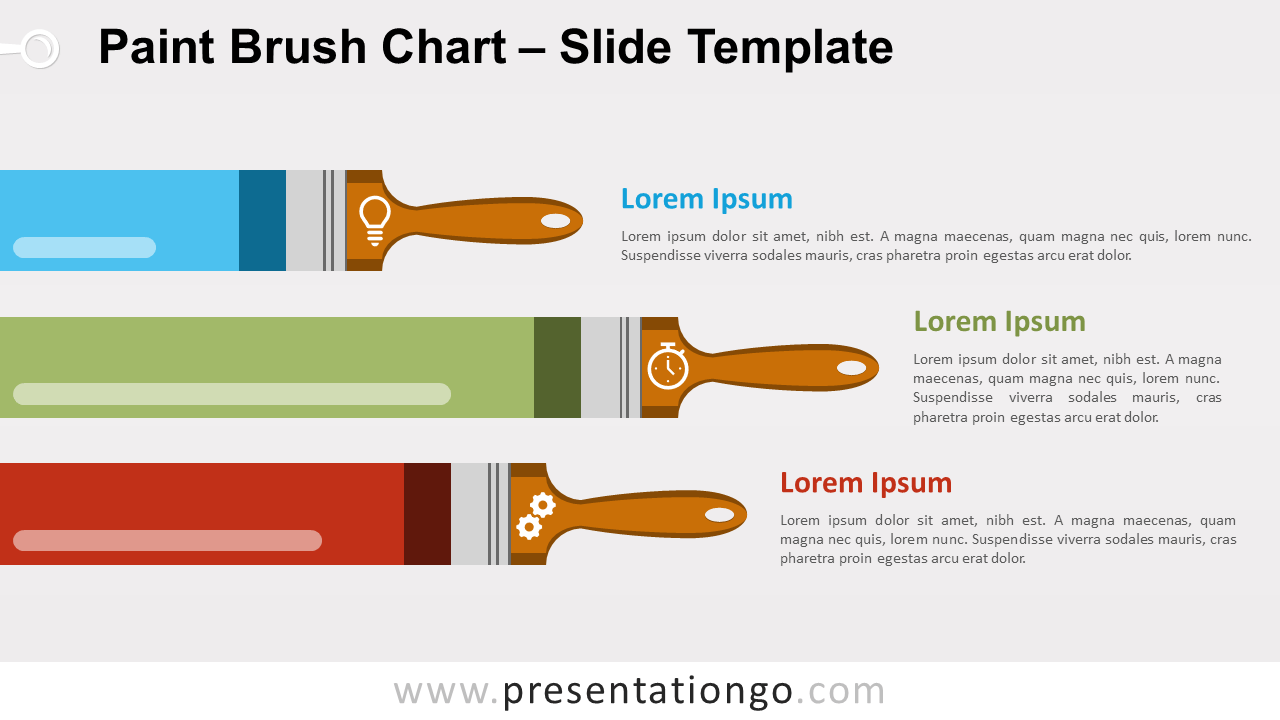
Free paint brush chart for PowerPoint and Google Slides. Infographic bar chart with paint strokes. Non-data-driven bar chart alternative.
Template Details
Free paint brush chart for PowerPoint and Google Slides. Infographic bar chart with horizontal colorful paint strokes. Non-data-driven bar chart alternative for presentations. Editable graphics with text placeholders. Time to brush up on your PowerPoint templates! As a matter of fact, this highly original Paint Brush Chart slide is ideal to share and illustrate your quantitative results in the shape of three bar charts. Sometimes you have to paint your audience a picture for them to visualize and understand perfectly your data! This eye-catching infographic includes three brushes that paint three horizontal lines of different colors. You can easily adjust the length of the paint strokes to compare your numbers, statistics, or percentages. Besides, icons can be inserted on the brush handles and you can explain your results thanks to text placeholders. Enjoy this Paint Brush Chart slide template to improve the data visualization of your quantitative results. You can also use it to compare the evolution of 3 different processes. So give colors to your numbers and remember a picture paints a thousand words! You can insert your own text labels, slide the bars (strokes) horizontally, and customize the numbers accordingly. Use this template to showcase quantitative results , to illustrate and compare percentages for example. First, ungroup the whole graphic. Then position the brush shape taking into consideration the level you want to showcase. Finally, slide the horizontal rectangle shape left/right and adjust the number accordingly.
- Source
- PresentationGo
- Format
- pptx
- File size
- 99 KB
- Downloads
- 0
- Slides
- 2
- Aspect Ratio
- 16:9
Author / Copyright:PresentationGo
Original source:PresentationGo original