Loading resources…
Total 8229 resources
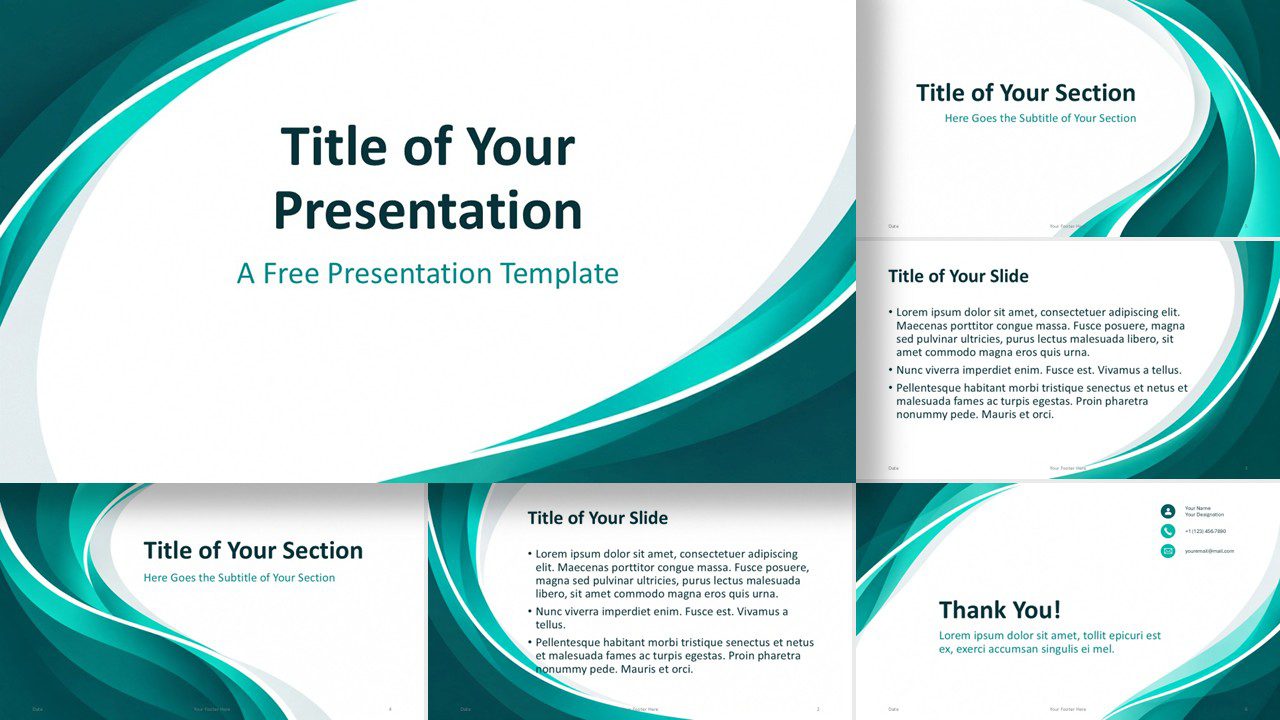
Download the Abstract Teal Flow template for PowerPoint and Google Slides with 6 editable slides, flowing teal shapes, and a custom color palette.
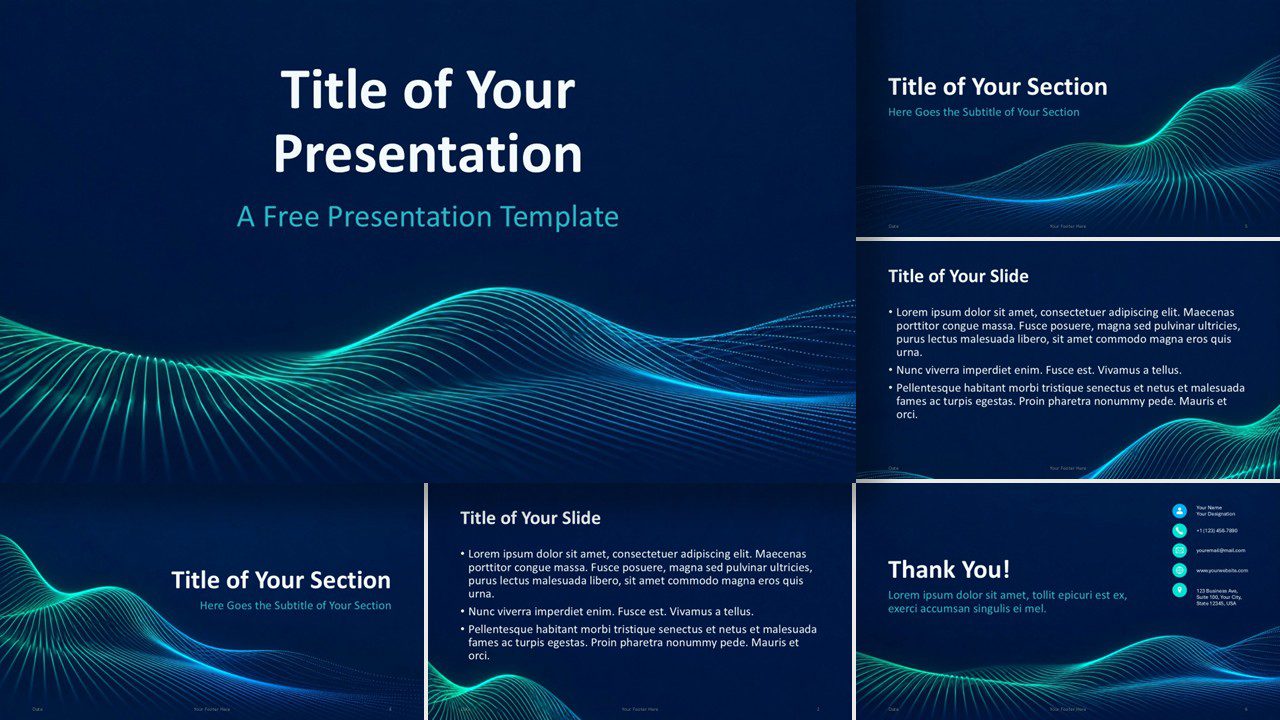
Download the Neon Data Waves presentation template for PowerPoint and Google Slides with six layouts, vivid neon waves, and a custom palette.
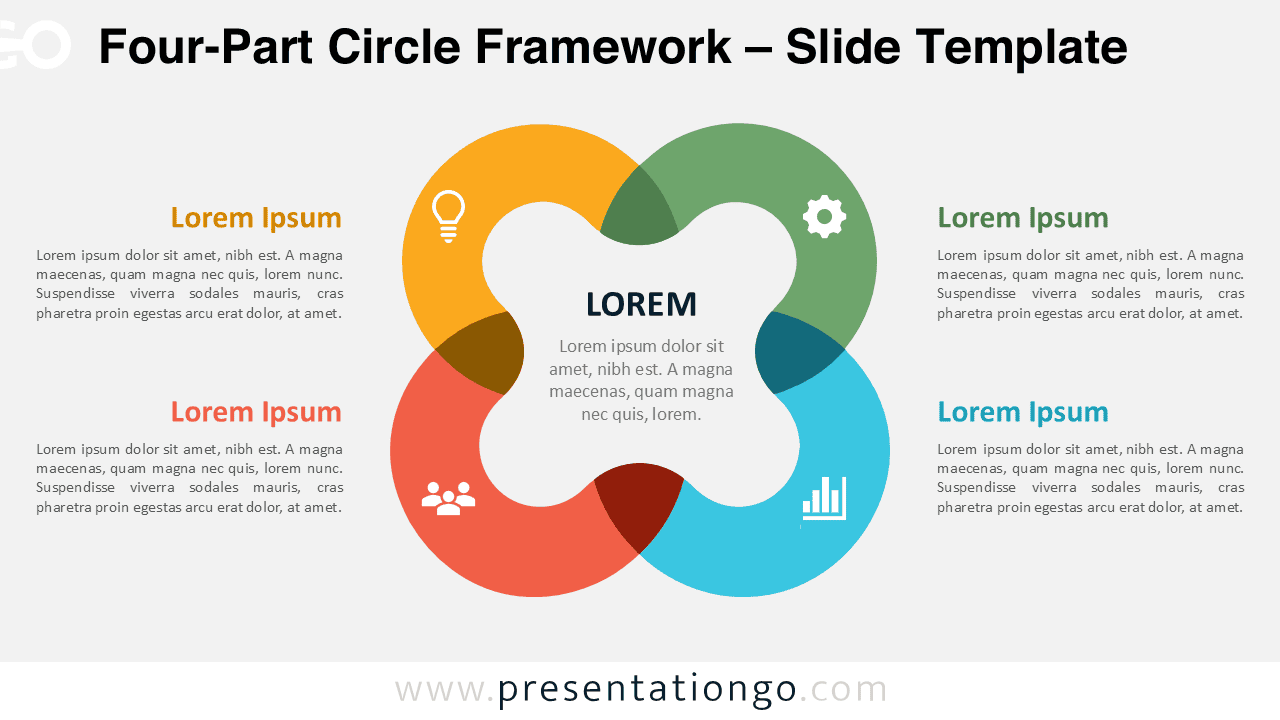
Use the Four-Part Circle Framework in PowerPoint and Google Slides to explain four related concepts, priorities, pillars, or functions around one central idea.
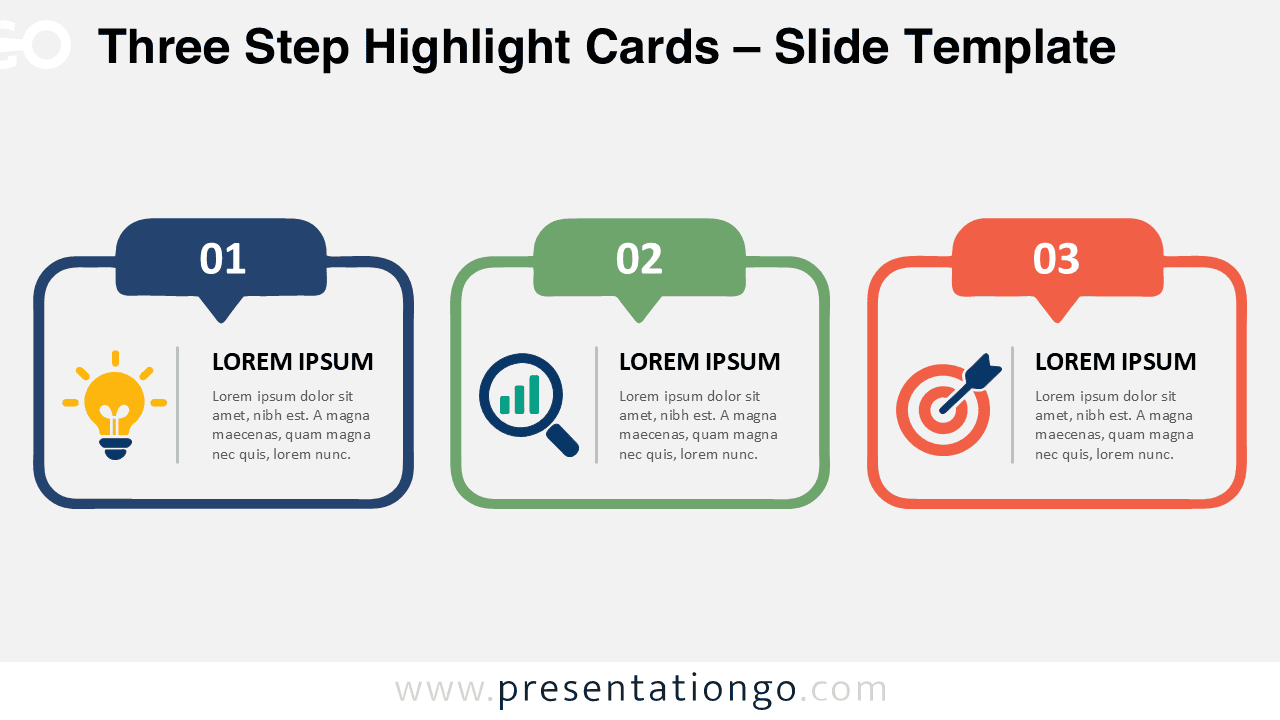
Download Three Step Highlight Cards for PowerPoint and Google Slides, featuring three editable cards with numbered tabs and modifiable icon placeholders.
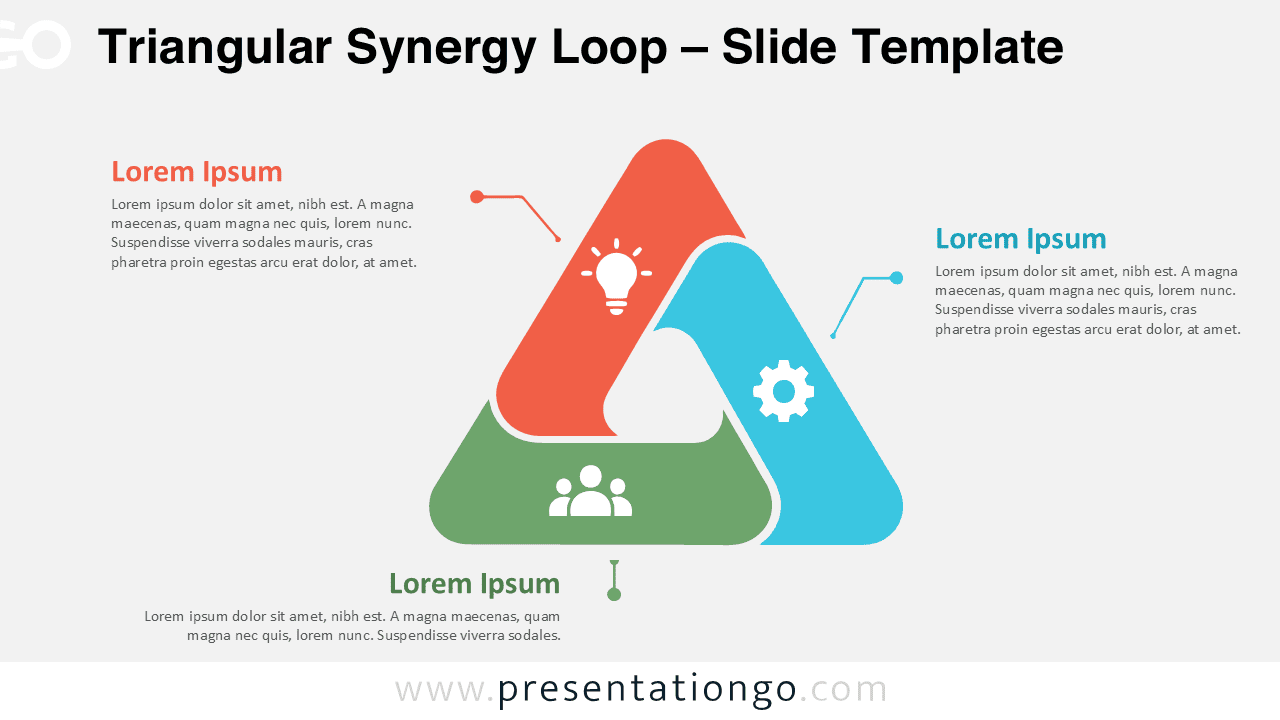
Use the Triangular Synergy Loop PowerPoint diagram in Google Slides to present three connected ideas, processes, teams, or strategic priorities.
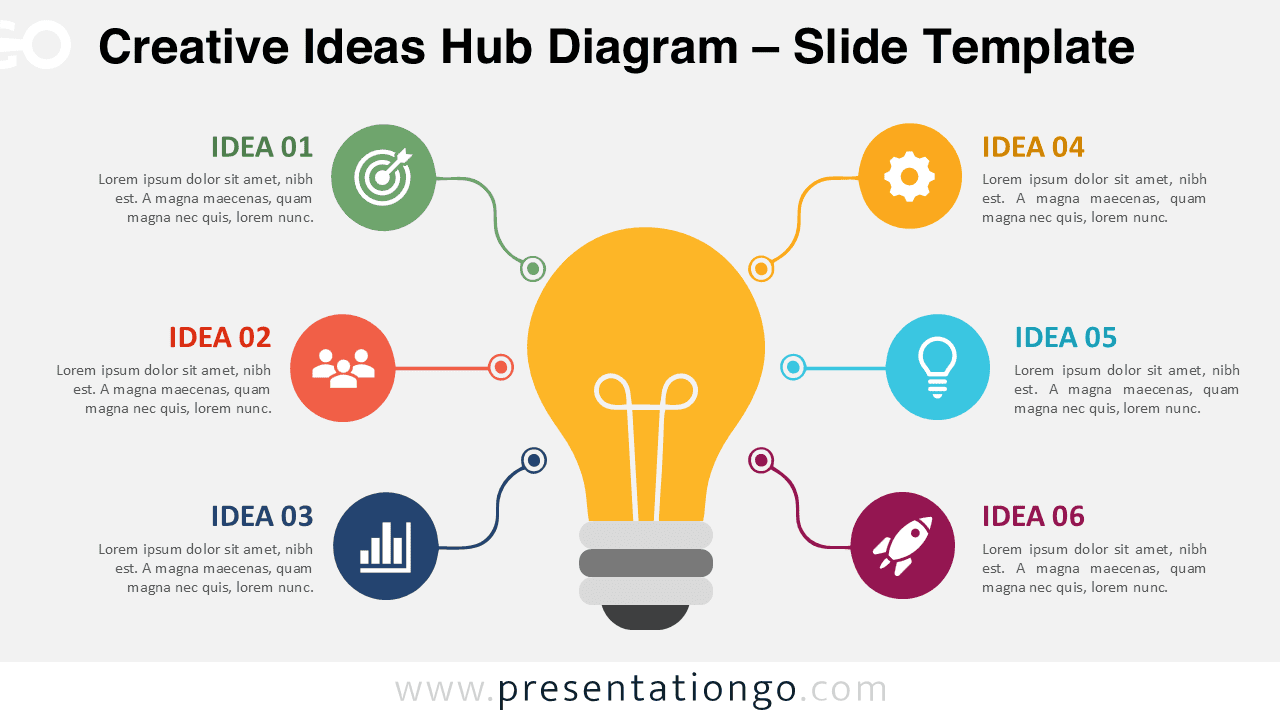
Use the Creative Ideas Hub Diagram for PowerPoint and Google Slides to organize six ideas around one central concept with editable text, shapes, and icons.
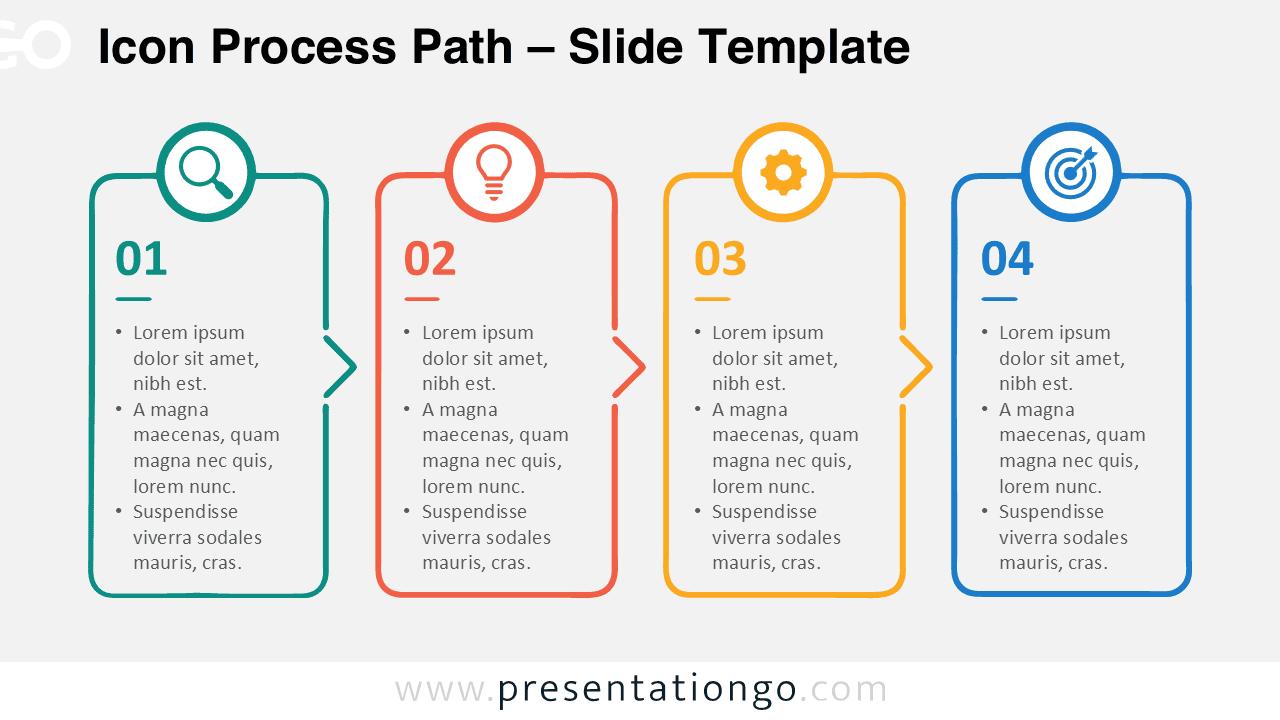
Download the Icon Process Path diagram for PowerPoint and Google Slides. Present four connected stages with editable text, shapes, and icon elements.
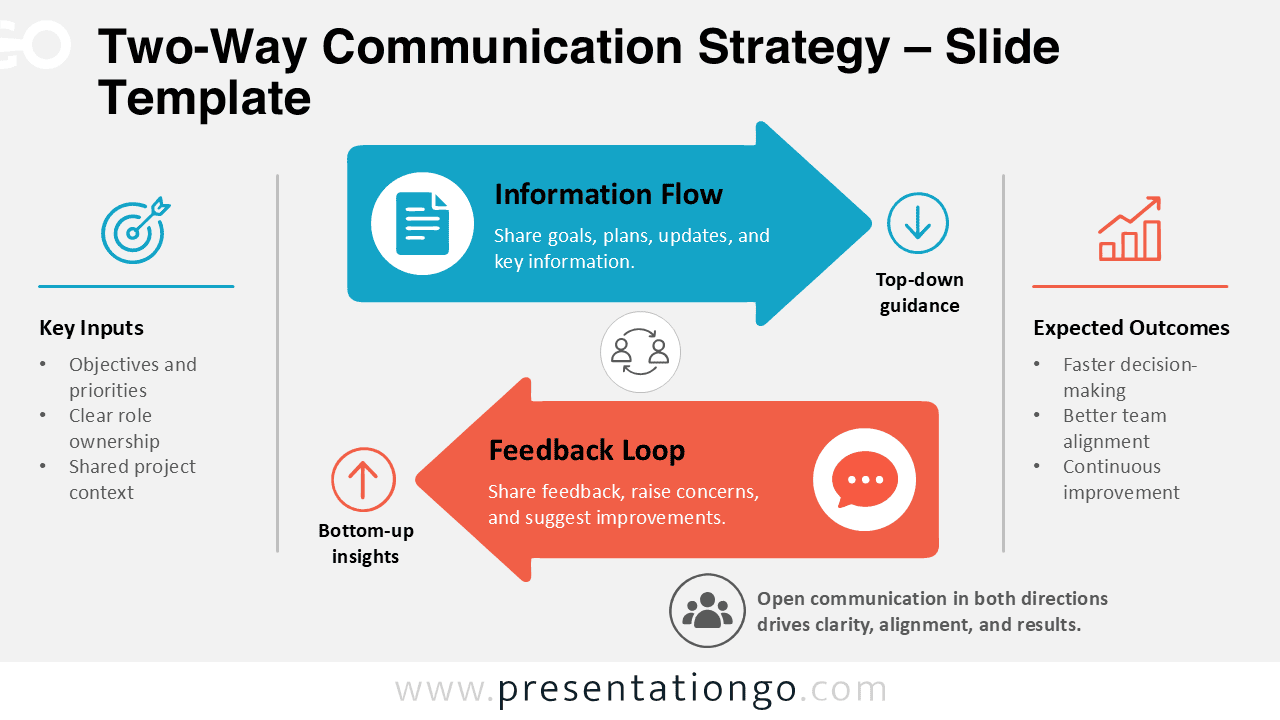
Download the Two-Way Communication Strategy diagram for PowerPoint and Google Slides to show top-down information flow and bottom-up feedback.
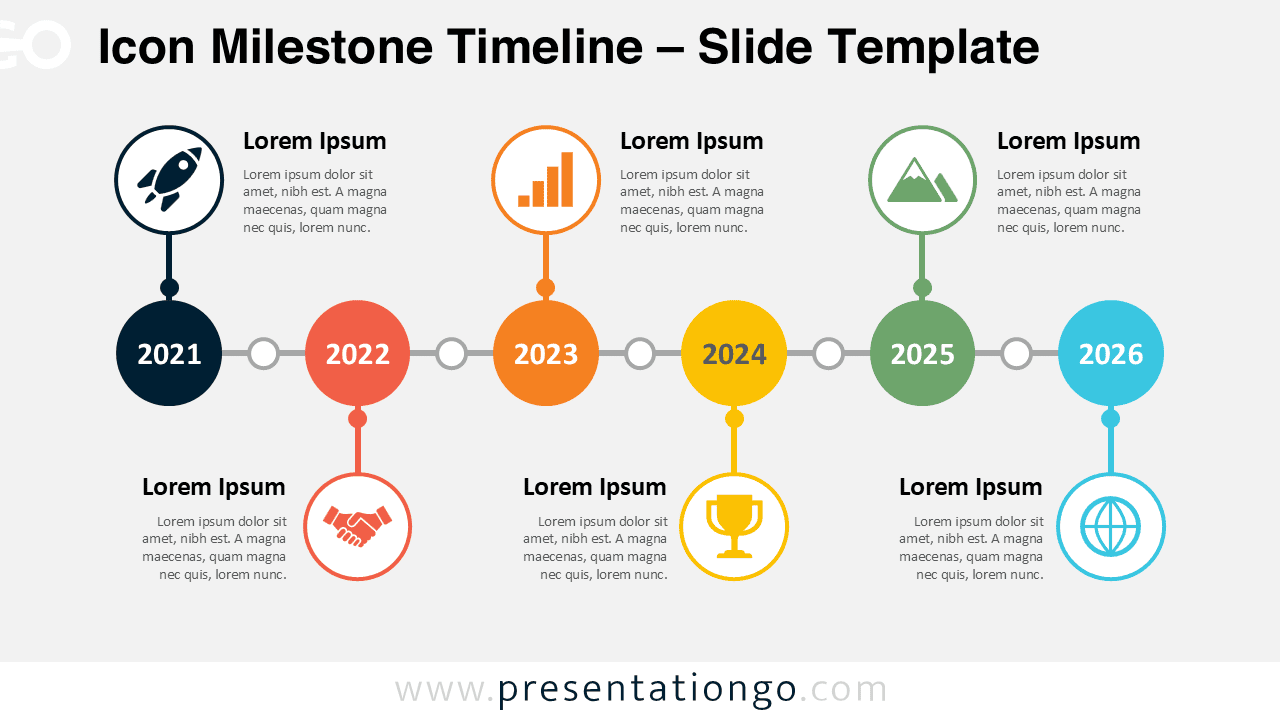
Present business history, project progress, or yearly achievements with the Icon Milestone Timeline for PowerPoint and Google Slides, fully editable layout.
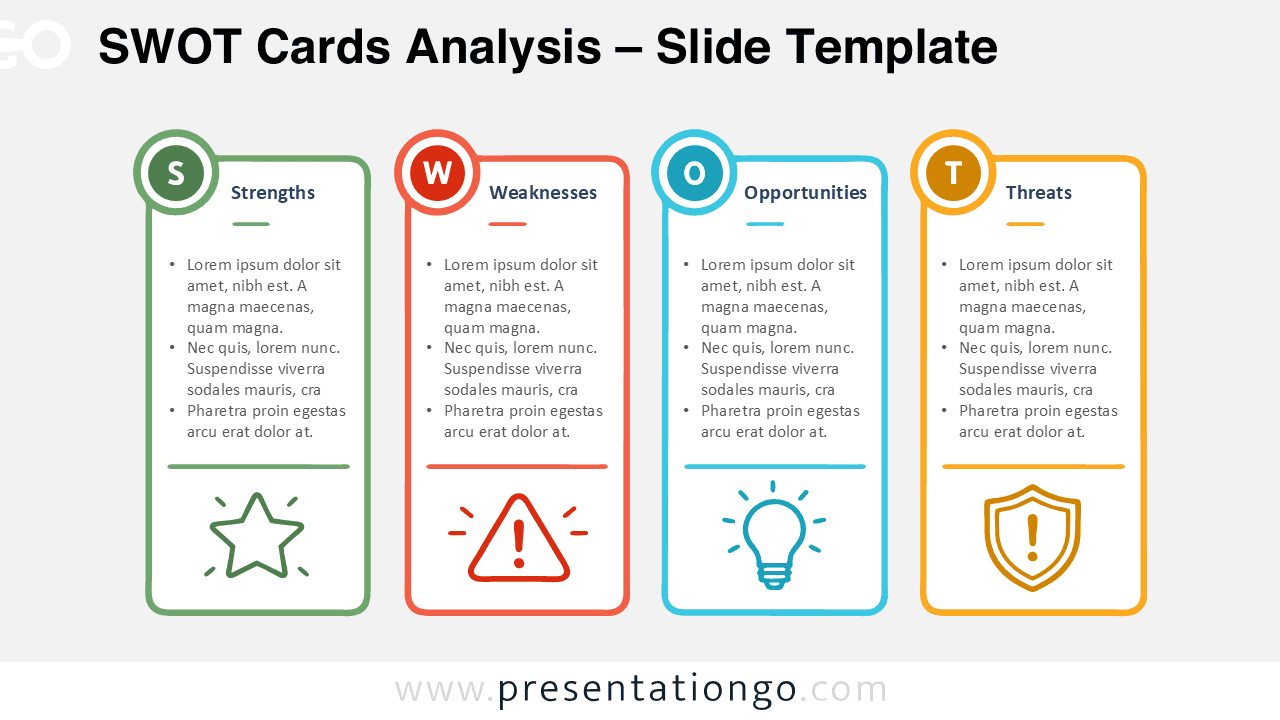
Download the SWOT Cards Analysis for PowerPoint and Google Slides. Edit four structured SWOT cards for strategic planning, reviews, and workshops.
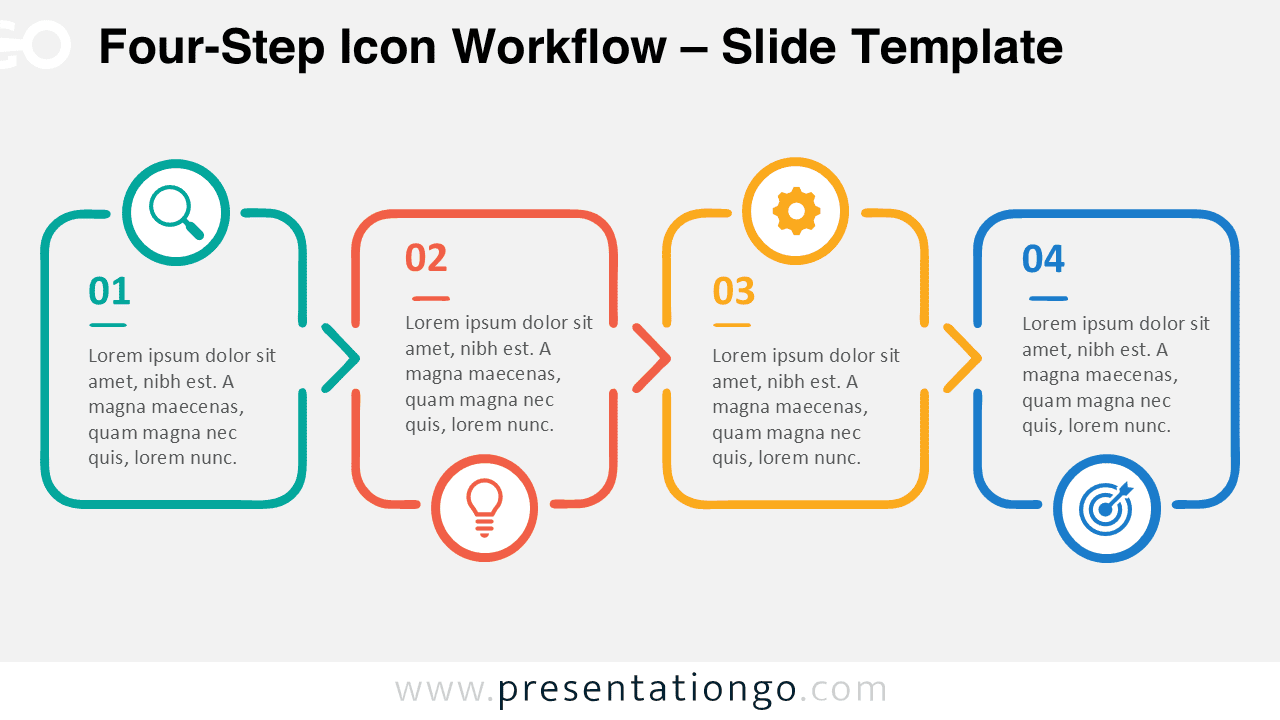
Download the Four-Step Icon Workflow for PowerPoint and Google Slides. Edit its connected process layout to explain four clear stages with ease.
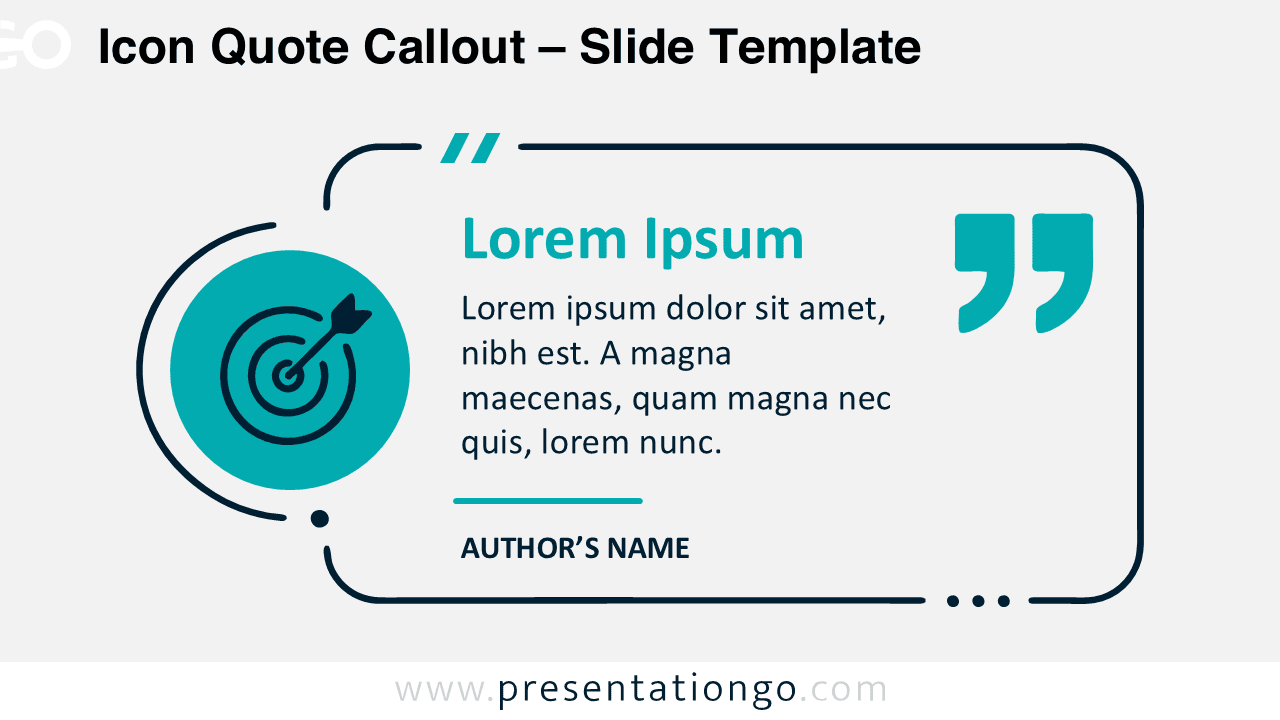
Download the Icon Quote Callout diagram for PowerPoint and Google Slides, with editable text, shapes, attribution, and an adaptable icon placeholder.
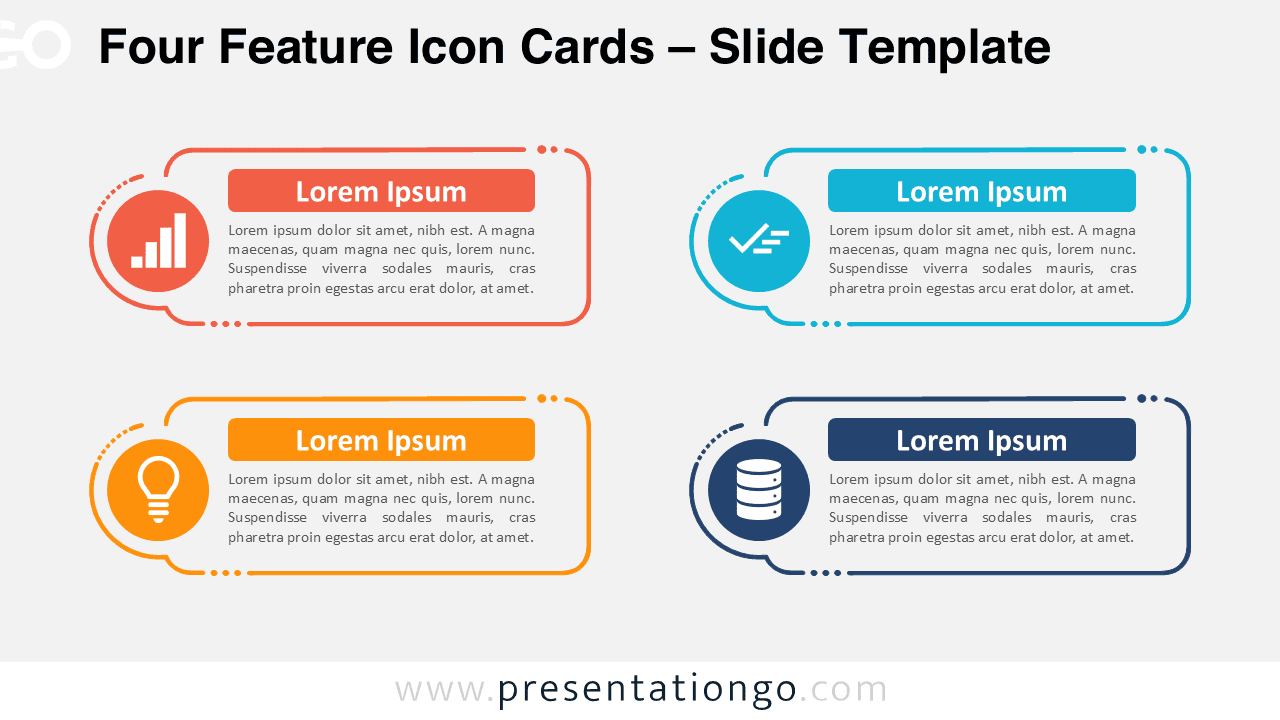
Download the Four Feature Icon Cards diagram for PowerPoint and Google Slides. Present four ideas with editable text, shapes, and modifiable Office library icons.
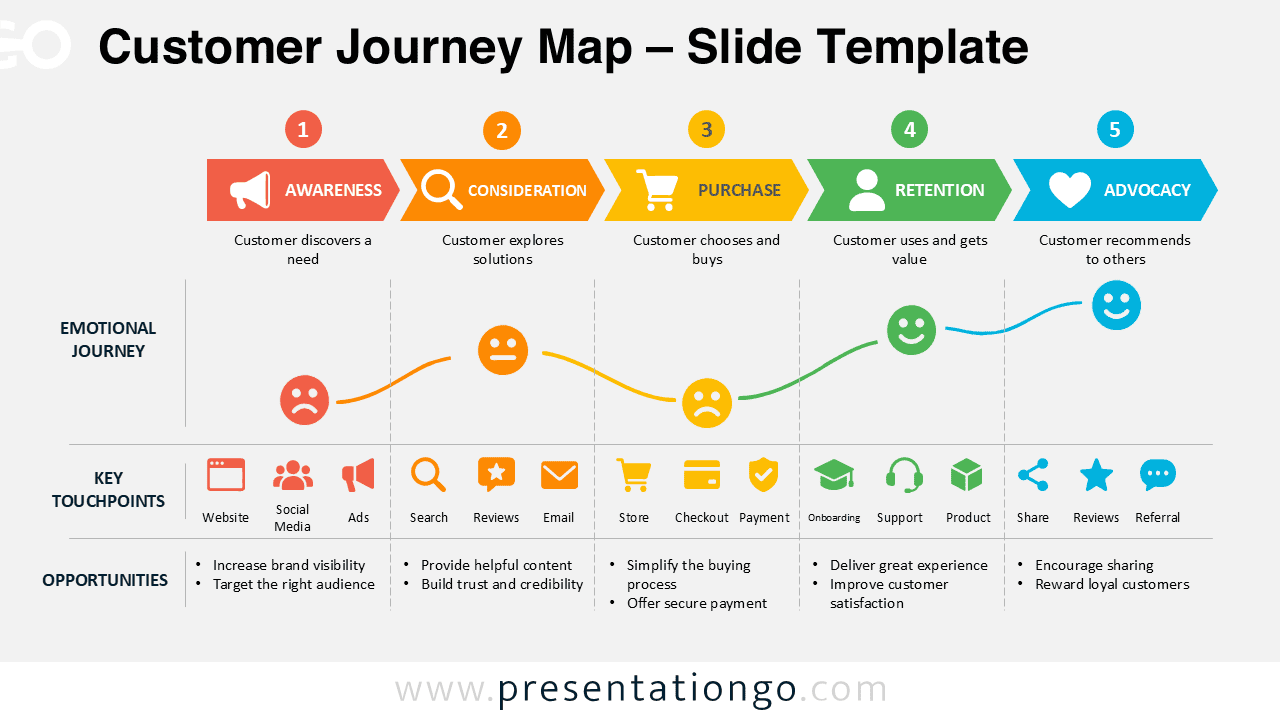
Download this Customer Journey Map for PowerPoint and Google Slides to visualize five customer stages, key touchpoints, emotions, and business opportunities.
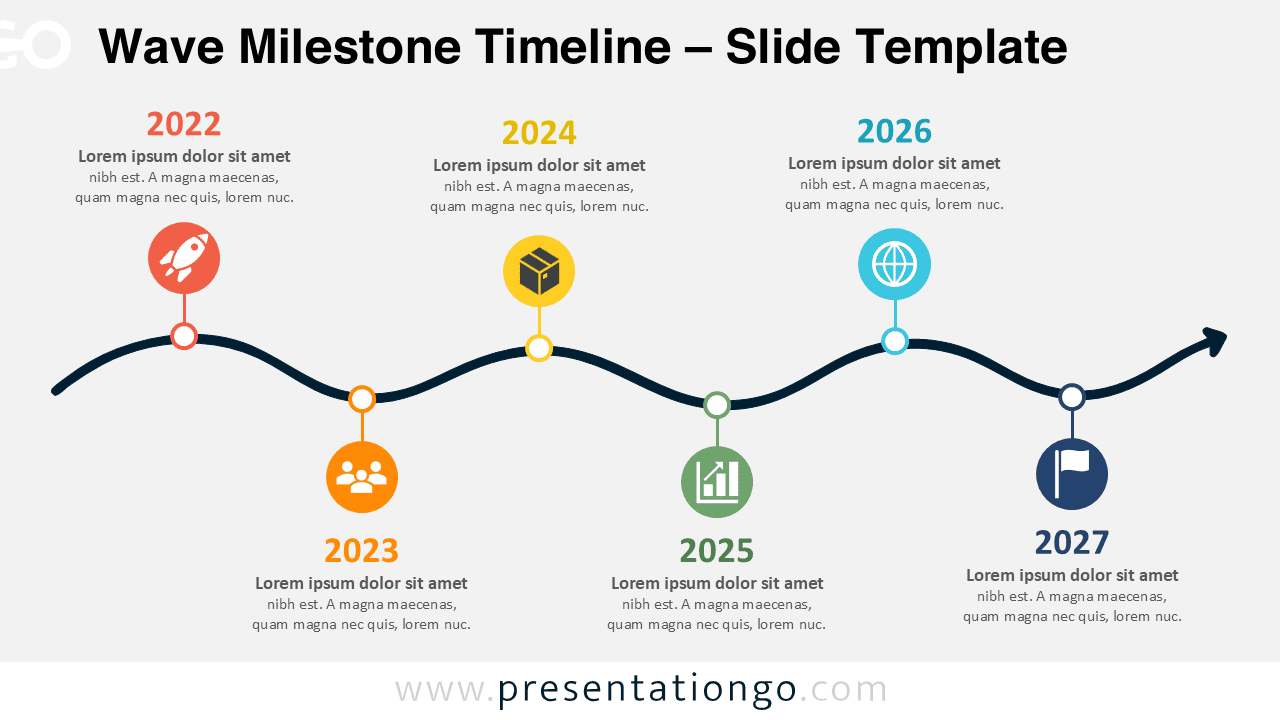
Download the Wave Milestone Timeline for PowerPoint and Google Slides. Present six milestones, dates, goals, or project stages along an editable curved path.
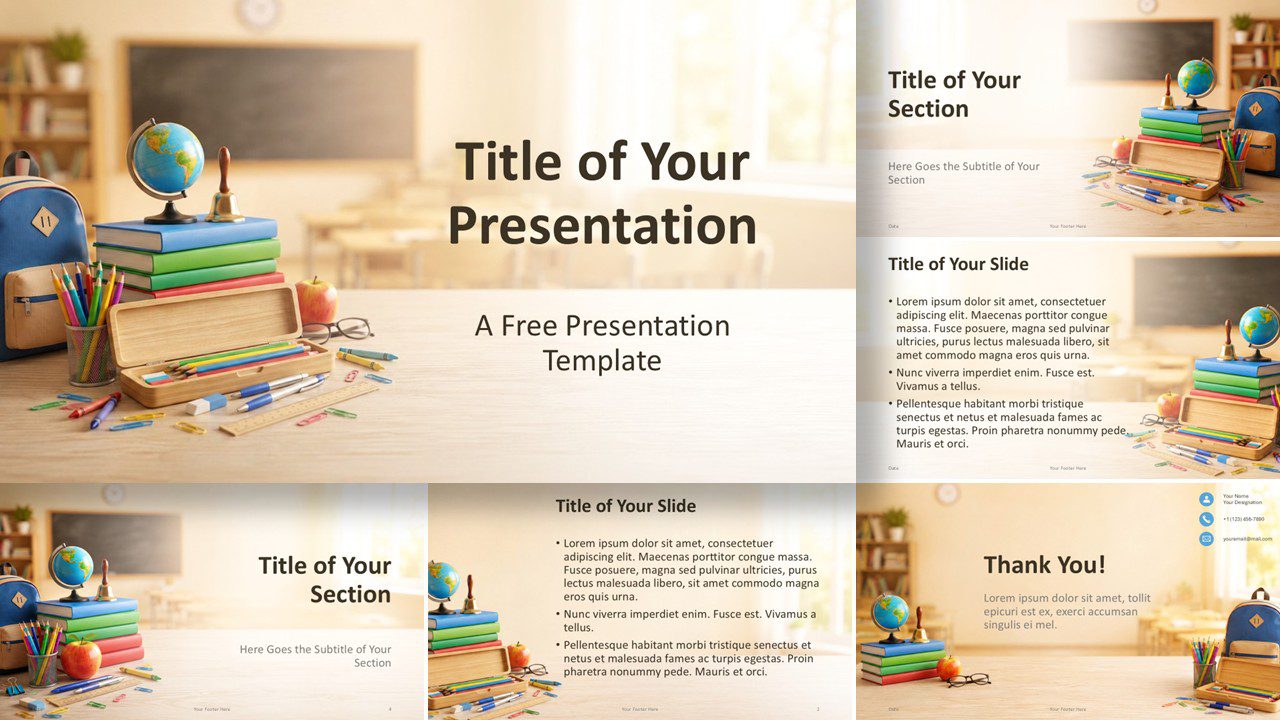
Present lessons with School Day, a PowerPoint and Google Slides template featuring 6 editable layouts, school-themed imagery, and a custom color palette.
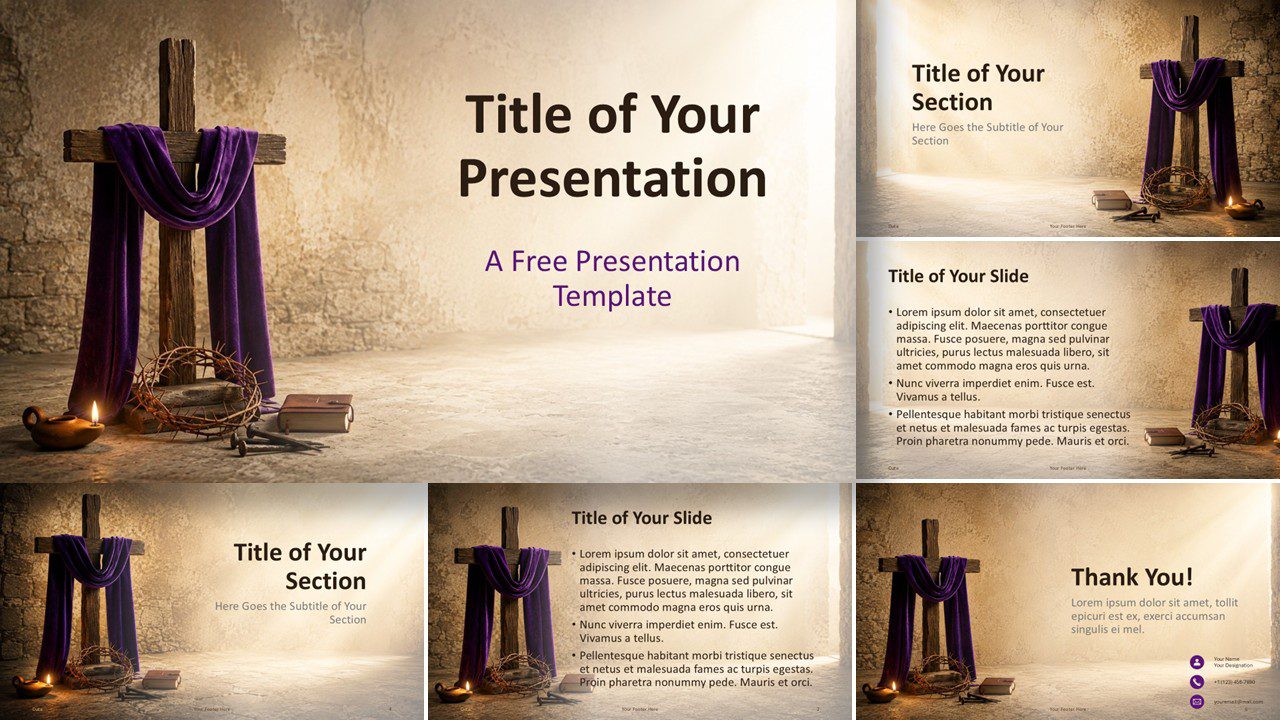
Download the Good Friday PowerPoint template for PowerPoint and Google Slides. Includes six layouts with a solemn Christian design for worship.
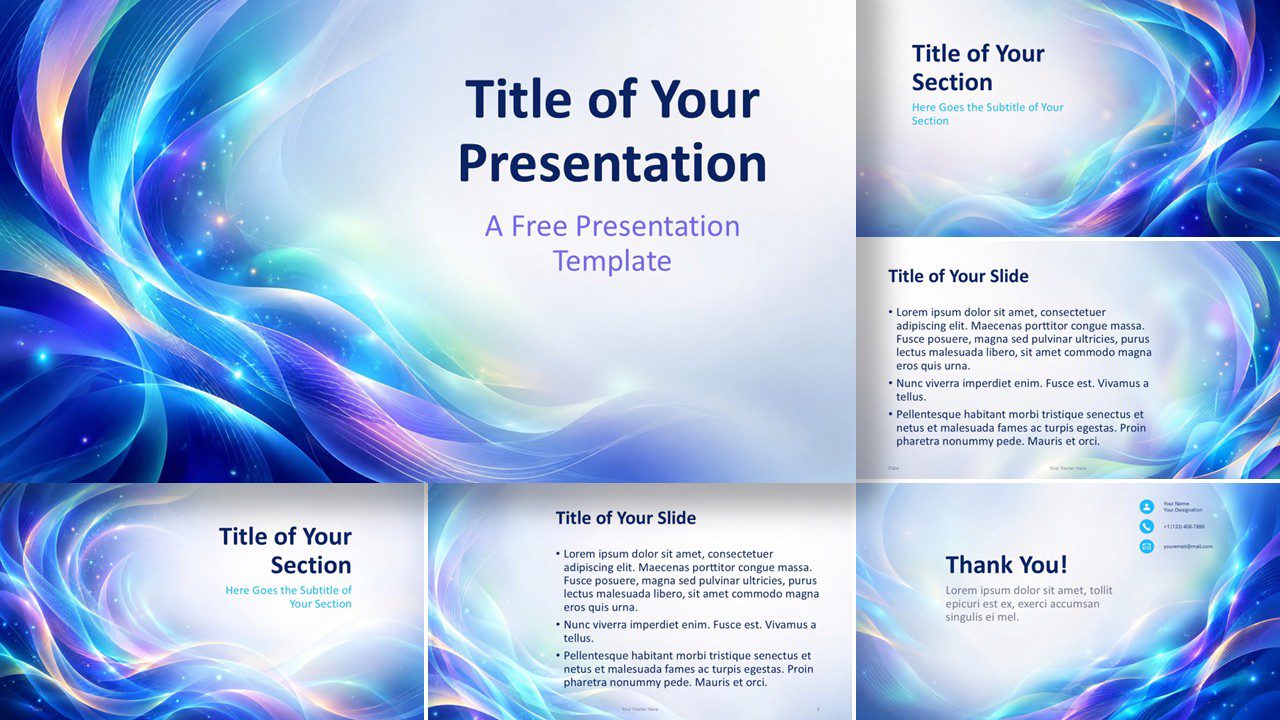
Aurora Waves is a free PowerPoint and Google Slides template with six modern layouts, luminous flowing graphics, and a coordinated custom color palette.
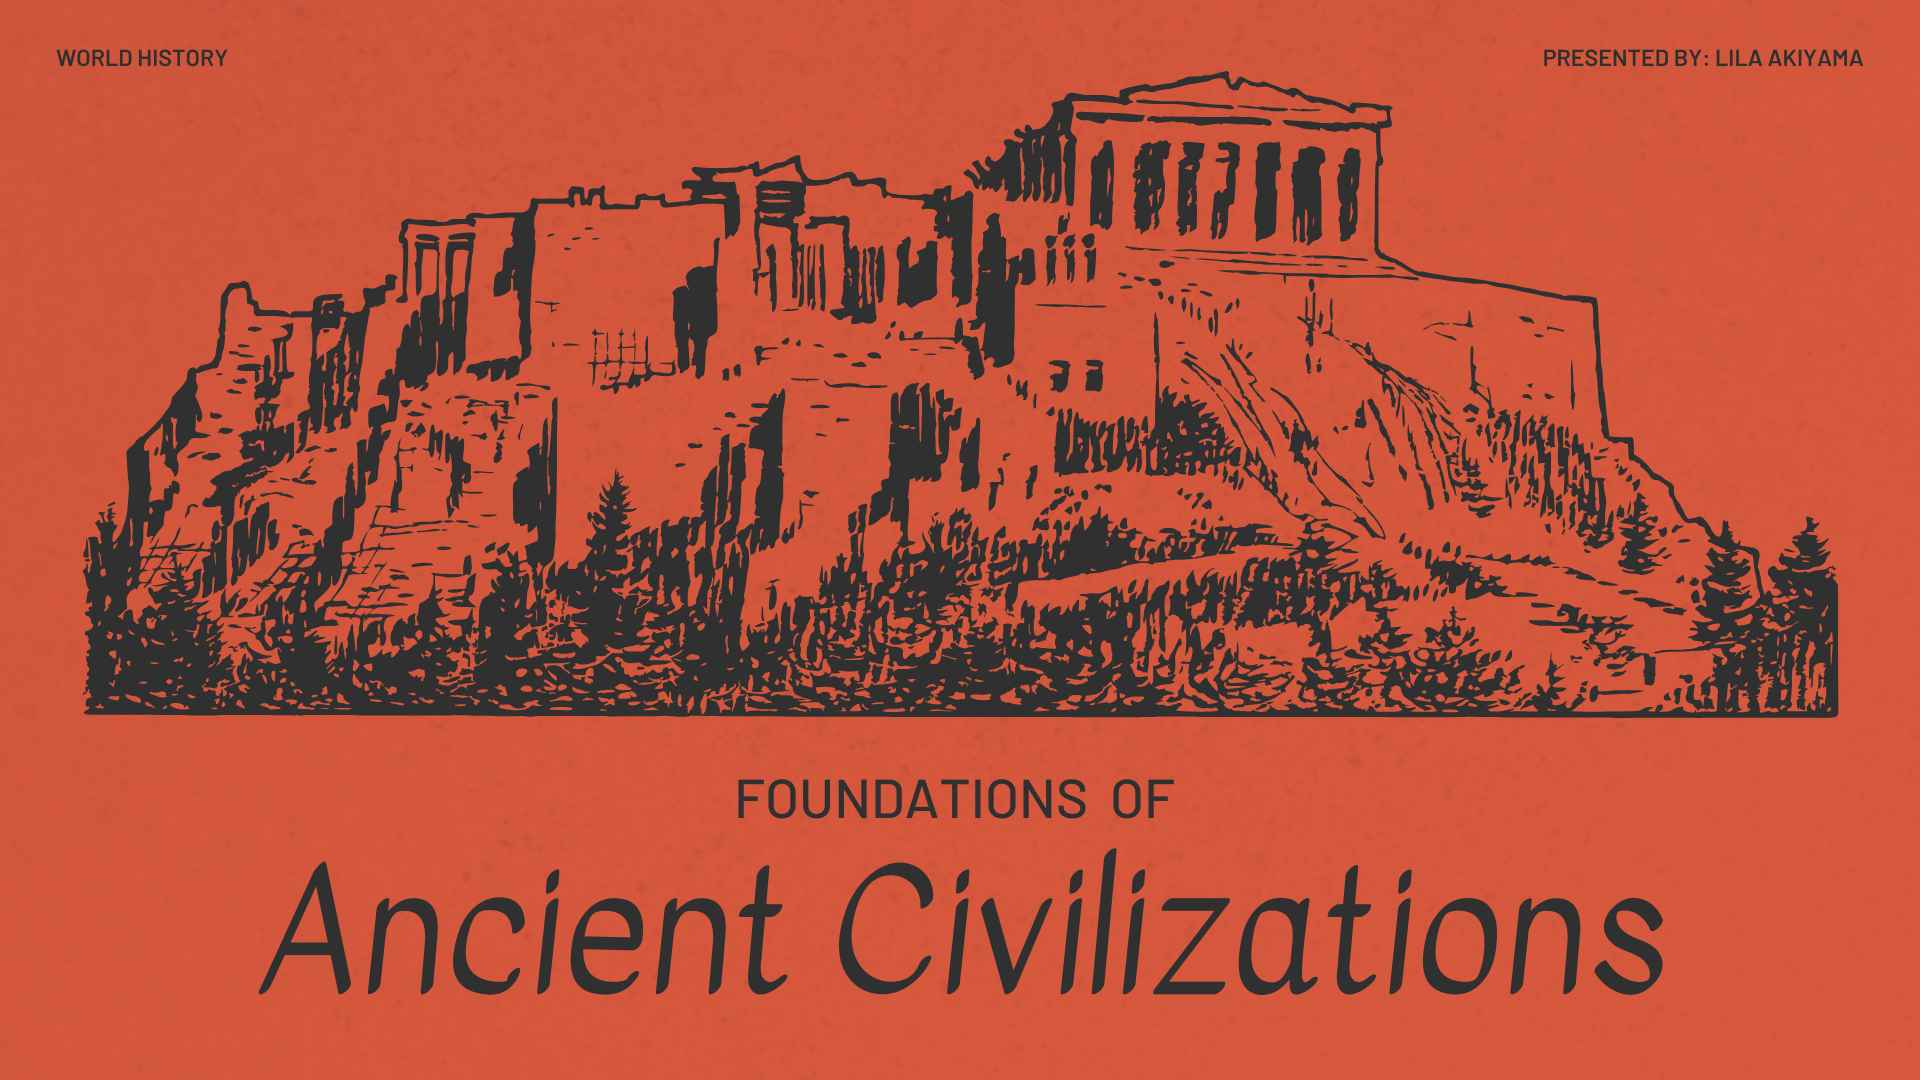
Share historical research with lively illustrated slides and bold orange accents. Easy to customize and free to use.
Present campaign insights with clear, geometric slides in cool tones. Fully customizable and free to use.
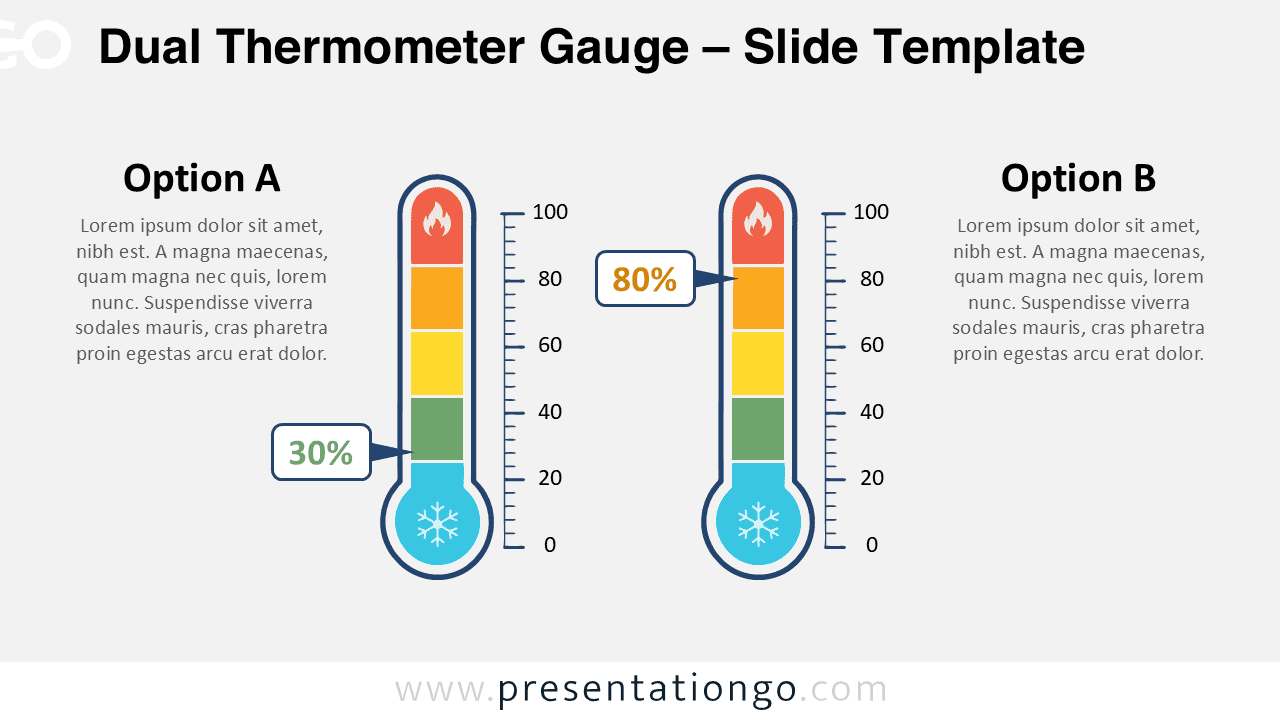
Download the Dual Thermometer Gauge for PowerPoint and Google Slides to compare two values, levels, ratings, or performance indicators visually.
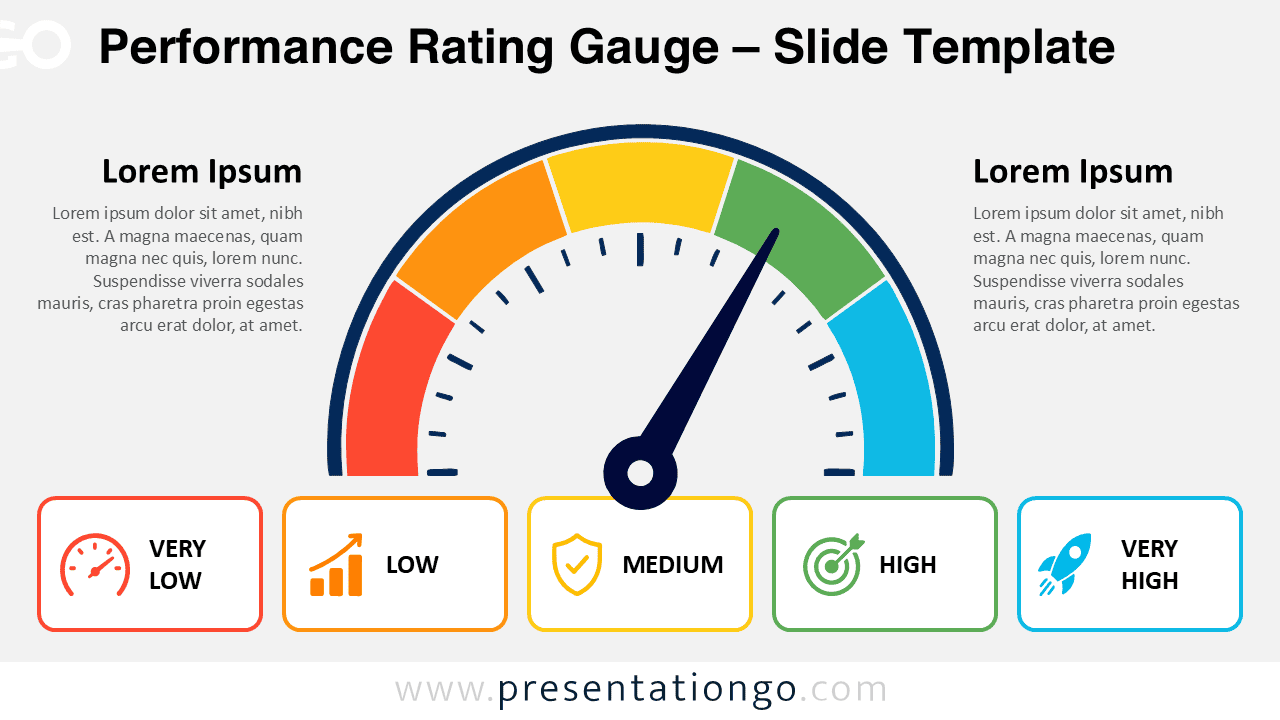
Download the Performance Rating Gauge for PowerPoint and Google Slides. Use this editable five-level gauge to show ratings, KPIs, risks, or progress.
Summarize project learnings in a modern, brown, and beige debrief report tha's easy to personalize and free to use.
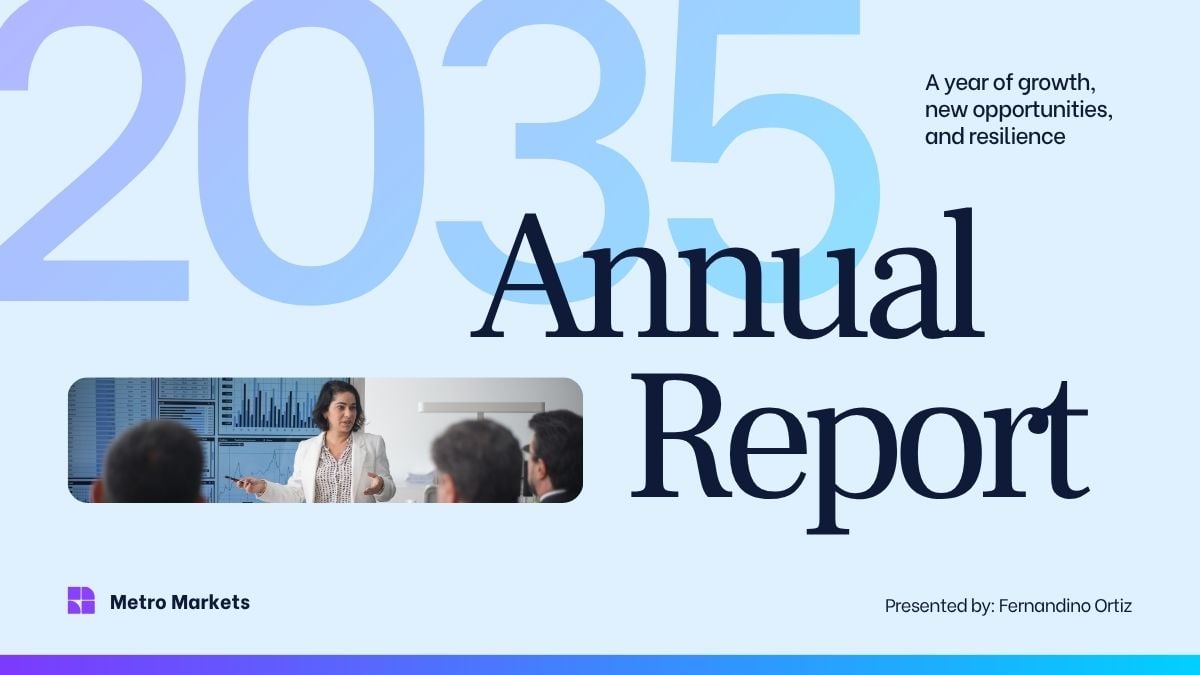
Share annual performance data in a modern blue presentation report that’s customizable and free.