 100% 免费
阶段PowerPoint谷歌幻灯片
Grape Stages for PowerPoint and Google Slides
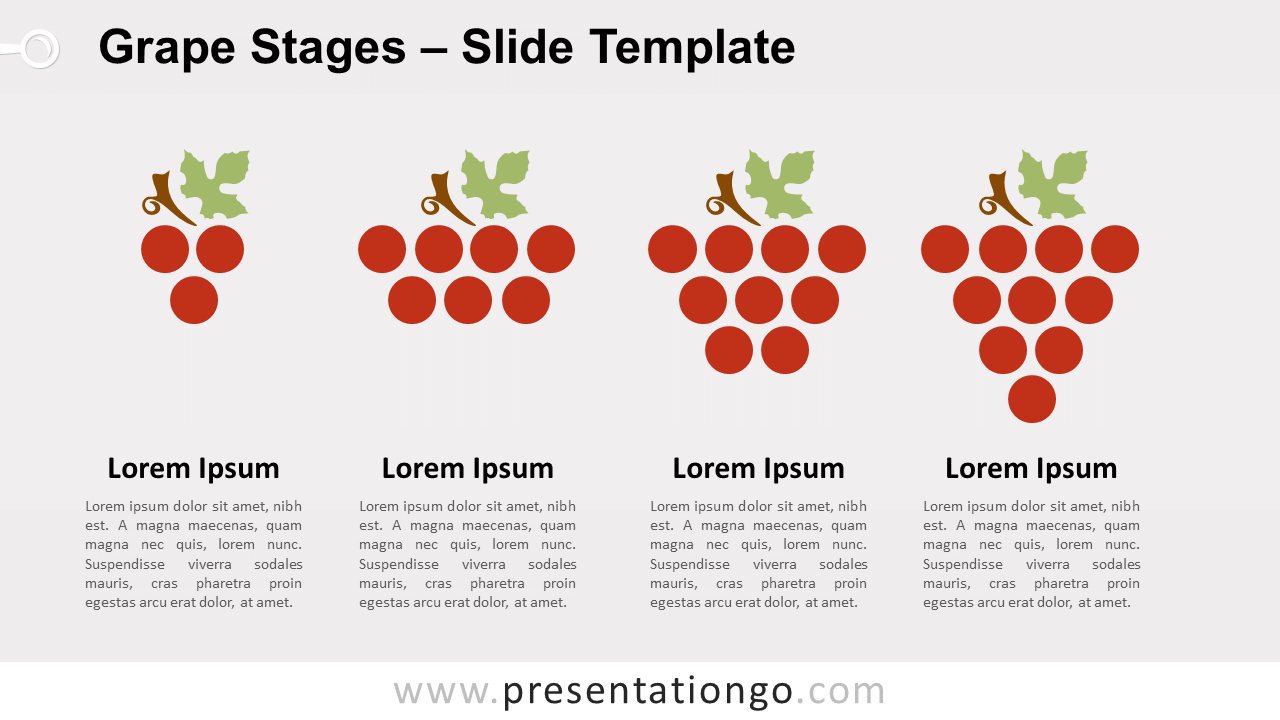
Free grape stages for PowerPoint and Google Slides. Four minimalist grape bunches with an increasing number of grapes per bunch. Great to show comparison.
模板详情
Free grape stages for PowerPoint and Google Slides. Four minimalist grape bunches with an increasing number of grapes per bunch. Great to show comparison. Editable graphics with text placeholders. This infographic with grape bunches is a pictorial unit type of chart. These charts aim to show data in an easy to visualize manner. More specifically, it uses repetition of visual elements (such as icons, symbols, shapes) to illustrate data. And that is exactly what this template can be used for. Because the graphic is completely editable, you can adapt the number of grapes to your own needs. As the maximum number of grapes (on the right) is 10, you can assume that each grape represents 10%. This graphic can also fit other purposes than showing quantitative results : for example, to showcase an evolution, different stages, a growth. And it doesn’t really matter if the topic is related or not to the fruit (or to the wine category) itself.
- 来源
- PresentationGo
- 文件格式
- pptx
- 文件大小
- 75 KB
- 下载次数
- 0
- 幻灯片页数
- 2
- 页面比例
- 16:9
作者 / 版权:PresentationGo
原始出处:PresentationGo 原文