 100% 免费
新拟态图表
Neumorphic Column Chart
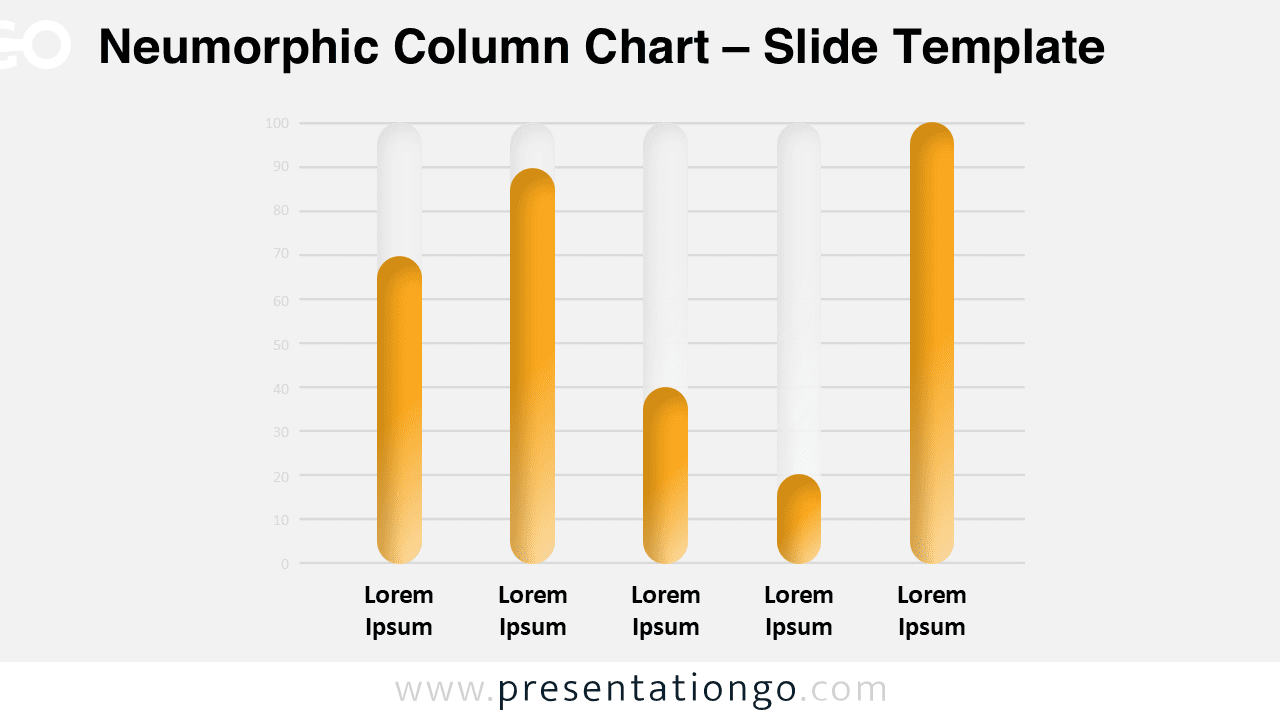
Create stunning data visualizations with the Neumorphic Column Chart template for PowerPoint and Google Slides, featuring soft 3D design.
模板详情
The Neumorphic Column Chart features five customizable vertical bars representing data in a modern three-dimensional style, designed for both PowerPoint and Google Slides presentations. Neumorphism blends soft shadows with subtle highlights, creating a tactile interface that feels modern and minimal. This column chart uses five vertical bars, each with rounded tops and bottoms to simulate a 3D, pill-like appearance. The visual stands out gently from the slide’s background, reinforced by light axis lines and numeric indicators that help define values. Category labels beneath each column complete the layout, offering clarity without clutter. Column charts are commonly used to display and compare values across categories. This template allows presenters to illustrate performance metrics, trends, or category rankings in a visually consistent format. It’s perfect for quarterly sales comparisons, survey result breakdowns, or performance reviews—especially when visual simplicity is essential. This template includes two distinct slide designs, each populated with placeholder text. The shapes are fully customizable, allowing color and icon changes to match your theme. Whether you prefer a light or dark aesthetic, both background options are included. The design fits both Standard (4:3) and Widescreen (16:9) formats and works seamlessly in PowerPoint and Google Slides.
模板特性
- 2 unique slides
- Options for both light and dark themes
- Pre-populated with text placeholders
- Fully customizable shapes for complete control
- Available in both Standard (4:3) and Widescreen (16:9) ratios
- Offered in both PowerPoint PPTX and Google Slides formats
- 来源
- PresentationGo
- 文件格式
- pptx
- 文件大小
- 89 KB
- 下载次数
- 0
- 幻灯片页数
- 2
- 页面比例
- 16:9
作者 / 版权:PresentationGo
原始出处:PresentationGo 原文