 100% 免费
满意度PowerPoint谷歌幻灯片
Satisfaction Meter for PowerPoint and Google Slides
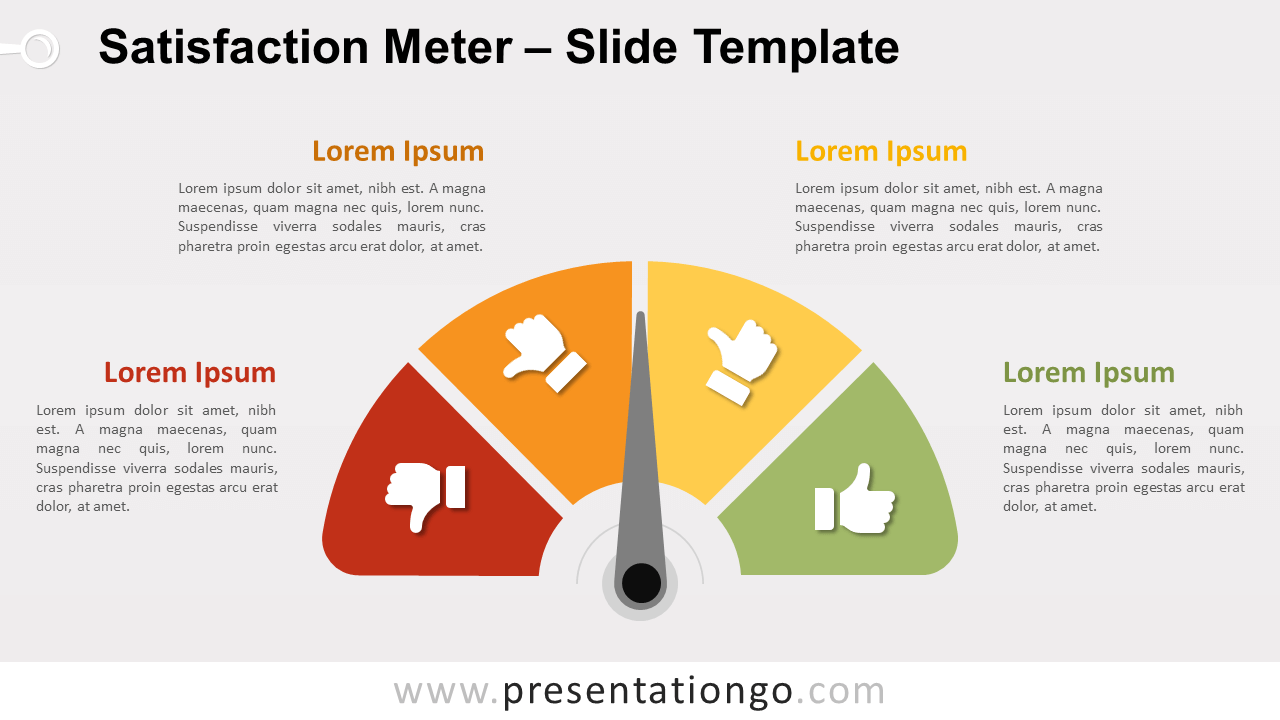
Free satisfaction meter for PowerPoint and Google Slides. Half a doughnut chart with 4 colorful sections and a needle to indicate the value.
模板详情
Free satisfaction meter for PowerPoint and Google Slides. Half a doughnut chart with 4 colorful sections and a needle to indicate the value. Editable graphics with icons and text placeholders. Speedometers are great graphics to visualize intensity. Indeed, just like the gauges displayed on a car dashboard, it is extremely easy to read the information (i.e., speed) at a glance. As a matter of fact, that is the reason why this type of chart is commonly used for other purposes: its simplicity to understand it. For example, the speedometers (similar to gauges) help individuals figure out whether they have good or bad credit. You can also find them in executive dashboard reports to show key business indicators. More specifically, this graphic showcases a semi doughnut (or ring) shape. 4 sections represent the radial scale. Also, the colors help identify the negative and positive sides of the scale. In this template, thumbs up and down, and smileys highlight the level of satisfaction of each section. Finally, rotate the gray needle to indicate the value.
- 来源
- PresentationGo
- 文件格式
- pptx
- 文件大小
- 91 KB
- 下载次数
- 0
- 幻灯片页数
- 3
- 页面比例
- 16:9
作者 / 版权:PresentationGo
原始出处:PresentationGo 原文