Loading resources…
Total 173 resources
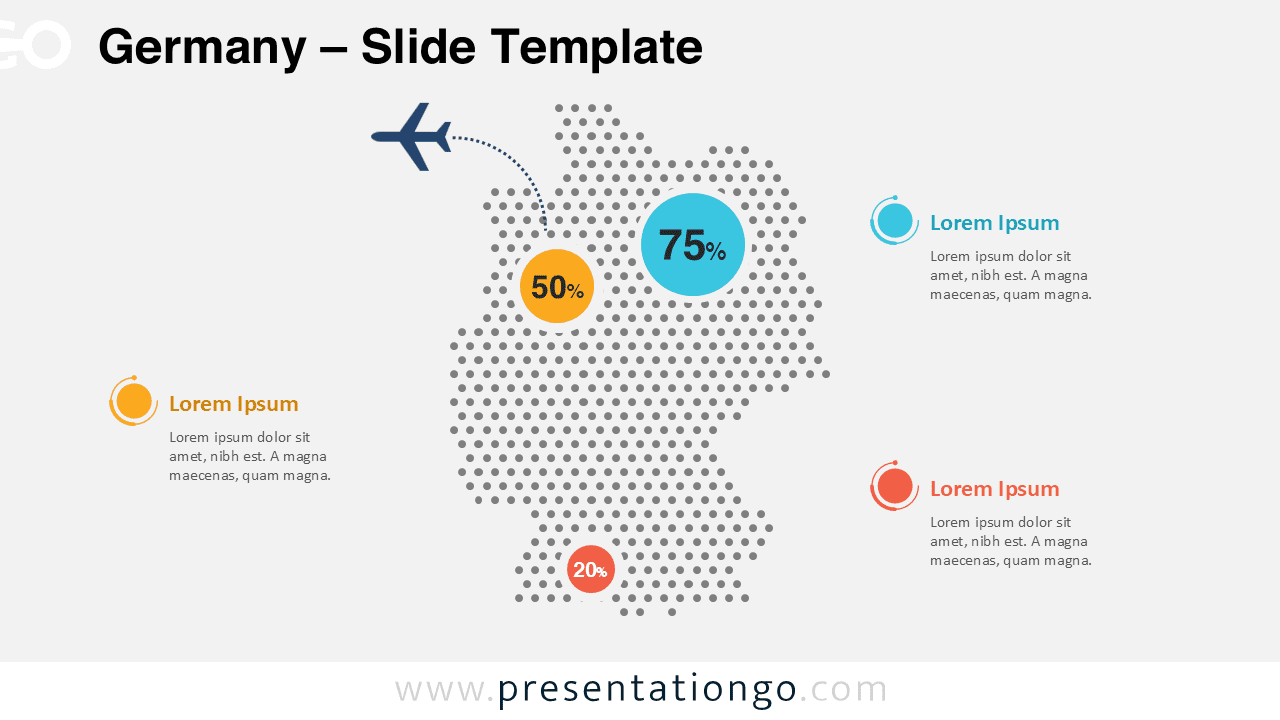
Download this Germany dotted map infographic for PowerPoint and Google Slides. Highlight regional data, statistics, and business insights with editable markers.
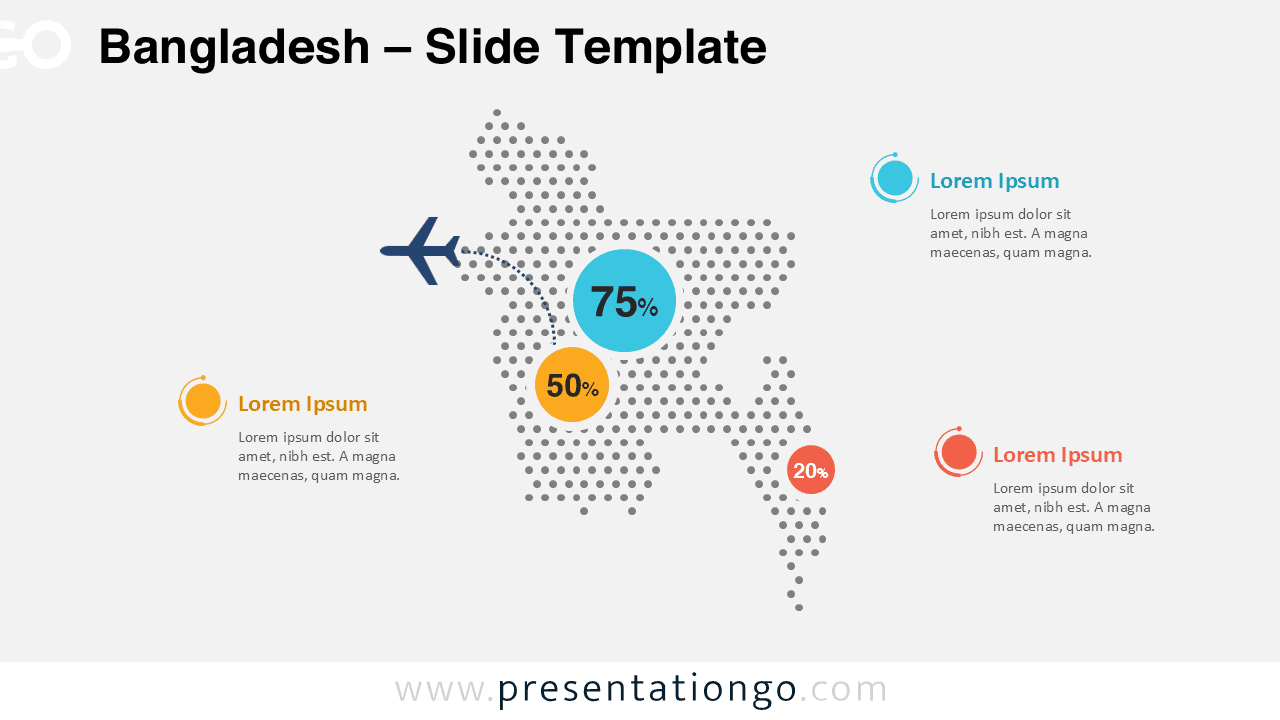
Download this Bangladesh dotted map infographic for PowerPoint and Google Slides. Highlight regional data, statistics, and insights with a clean, modern layout.
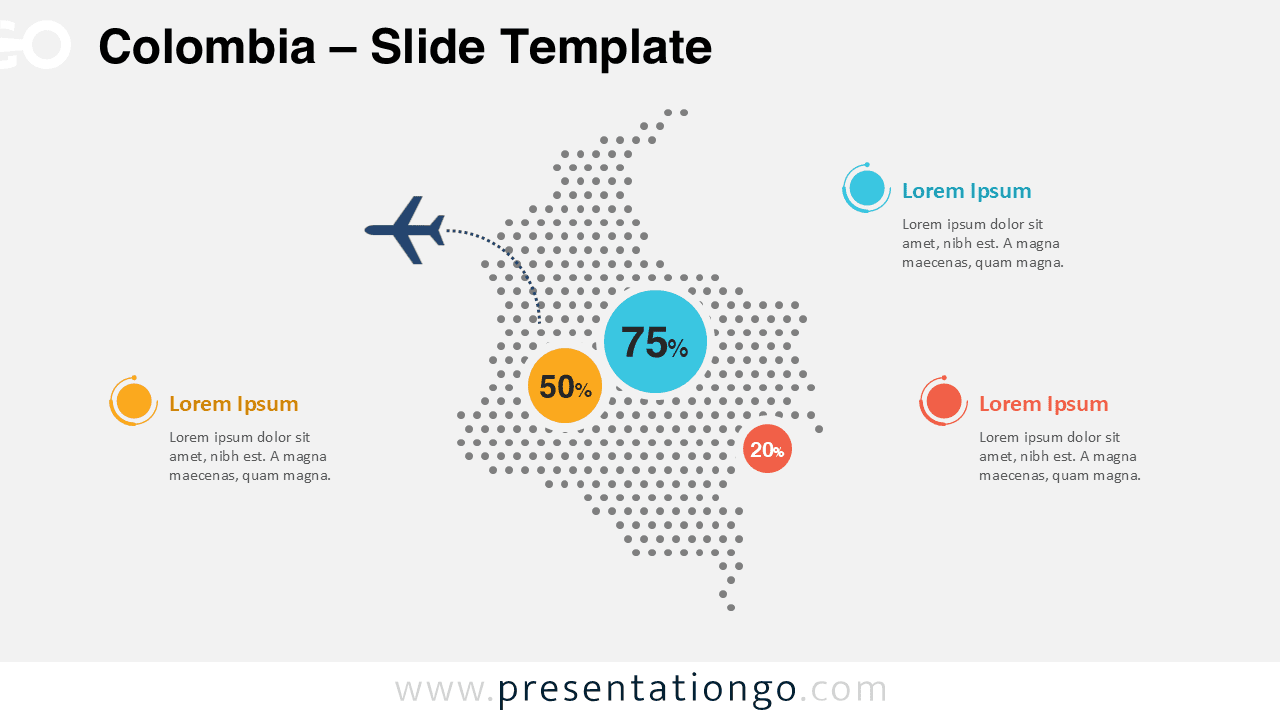
Download the Colombia Dotted Map Infographic for PowerPoint and Google Slides. Visualize regional data, statistics, and geographic insights with a clean map design.
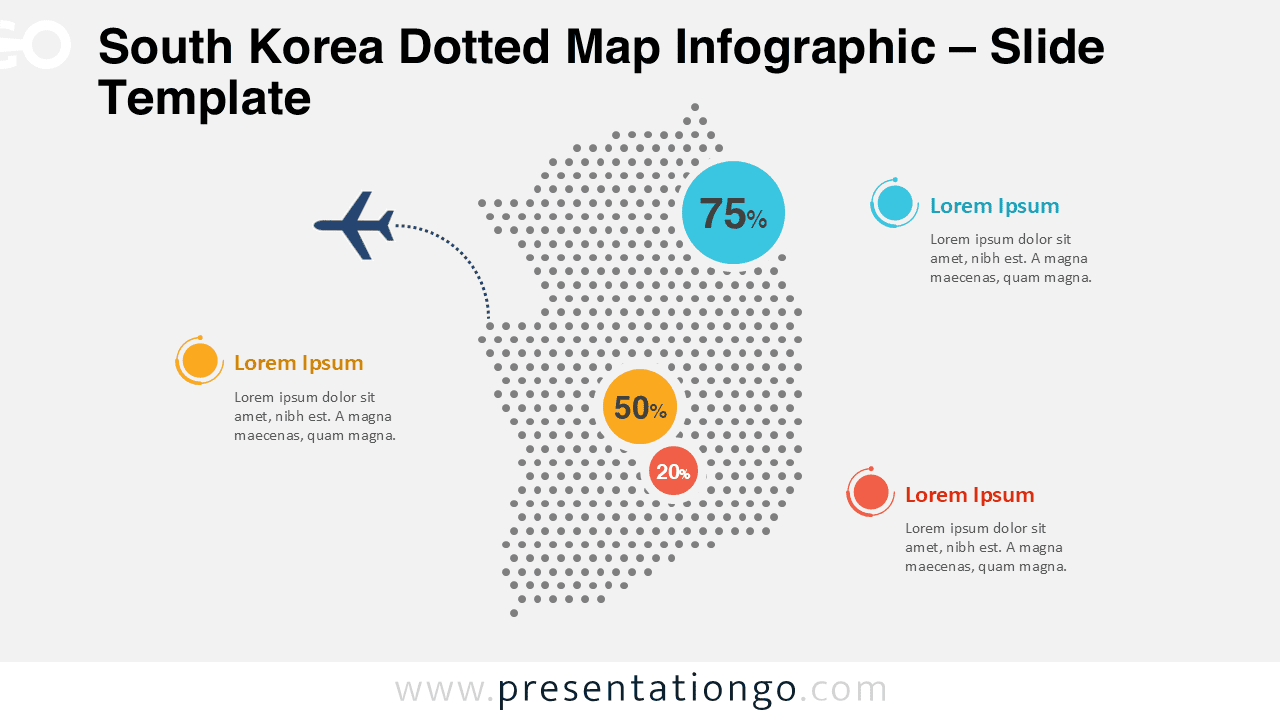
Download a free South Korea dotted map infographic for PowerPoint and Google Slides. Perfect for data visualization, reports, and regional analysis.
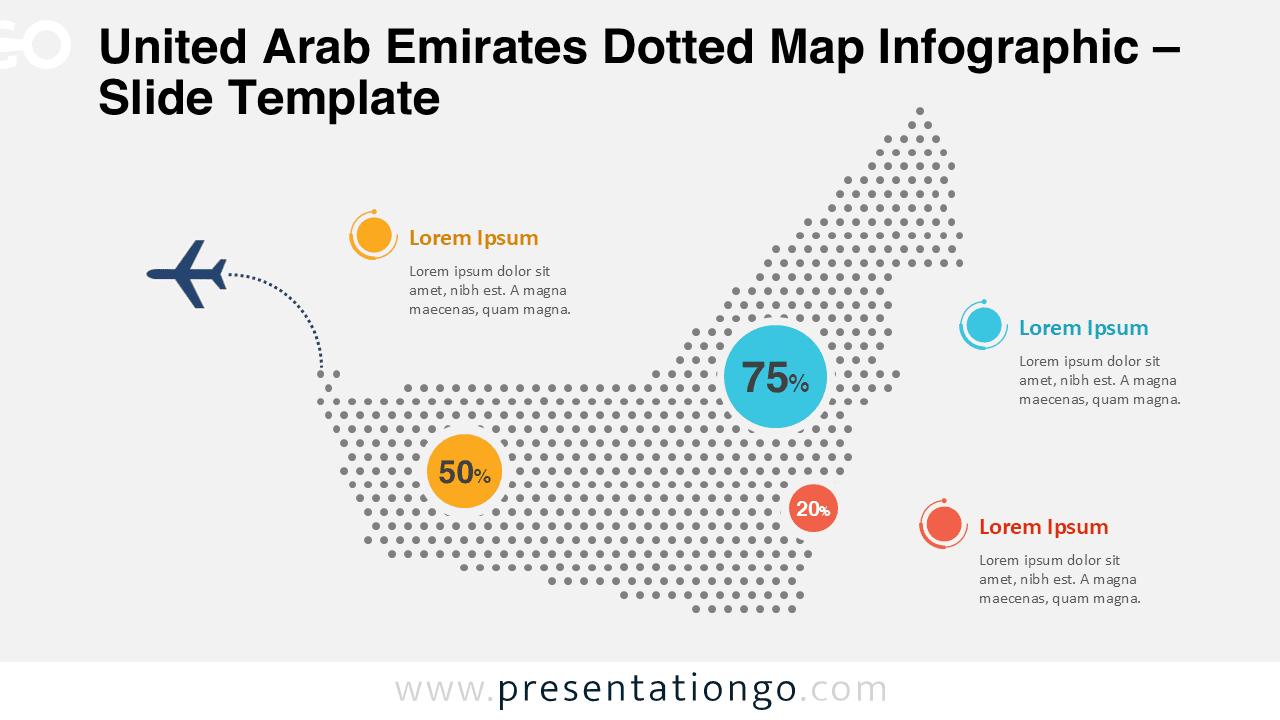
Download a free United Arab Emirates dotted map infographic for PowerPoint and Google Slides. Ideal for statistics, reports, and geographic data.
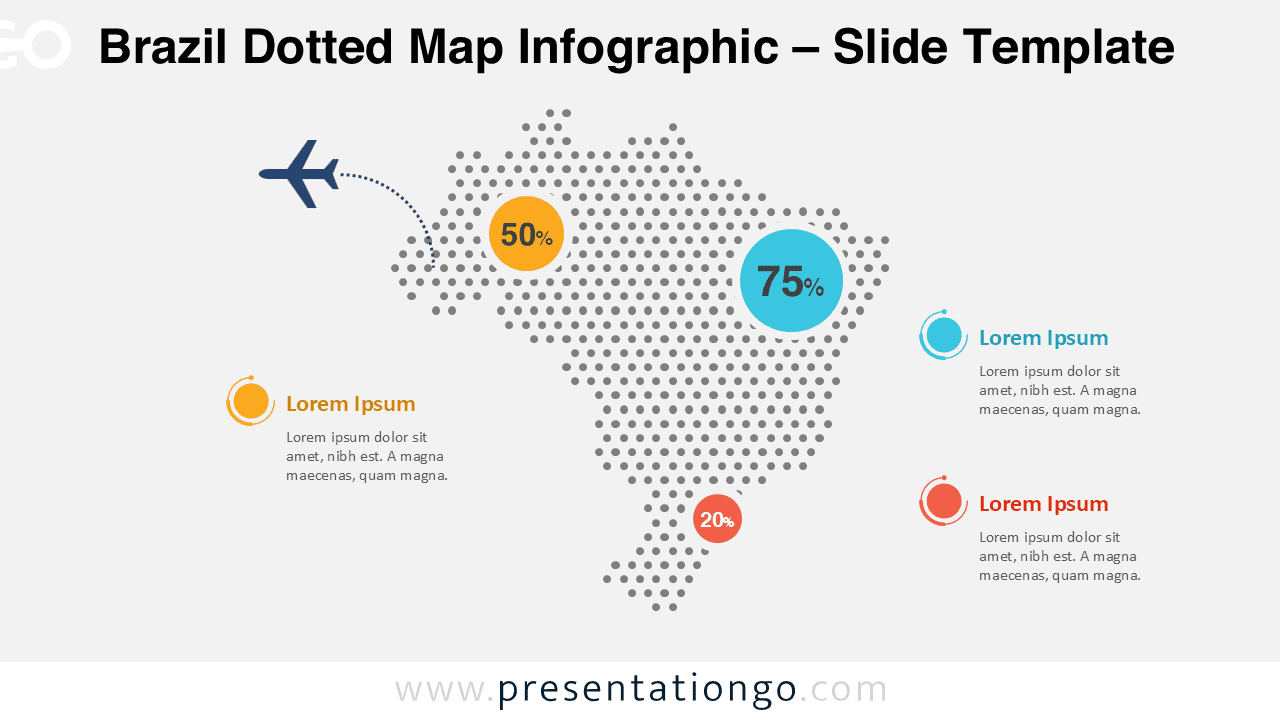
Download a Brazil dotted map infographic for PowerPoint and Google Slides. Ideal for statistics, geography, and regional data presentations.
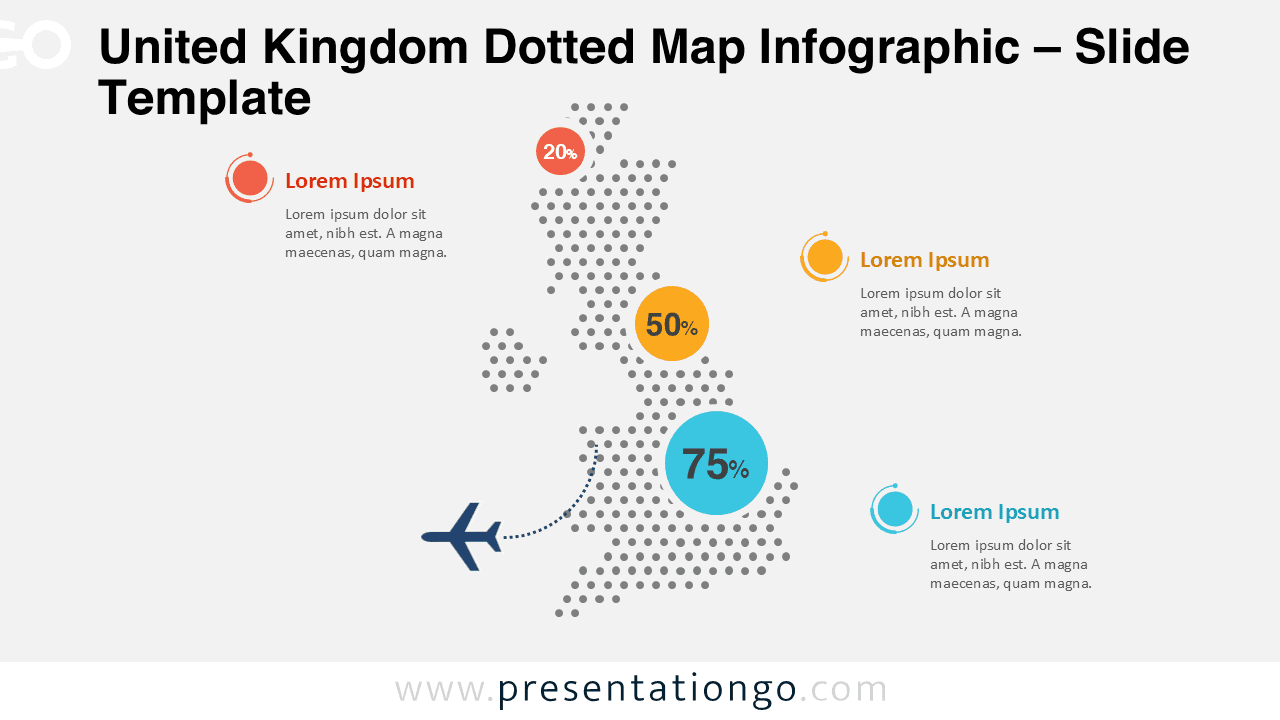
Download a free United Kingdom dotted map infographic for PowerPoint and Google Slides. Perfect for UK data, regional analysis, and reports.
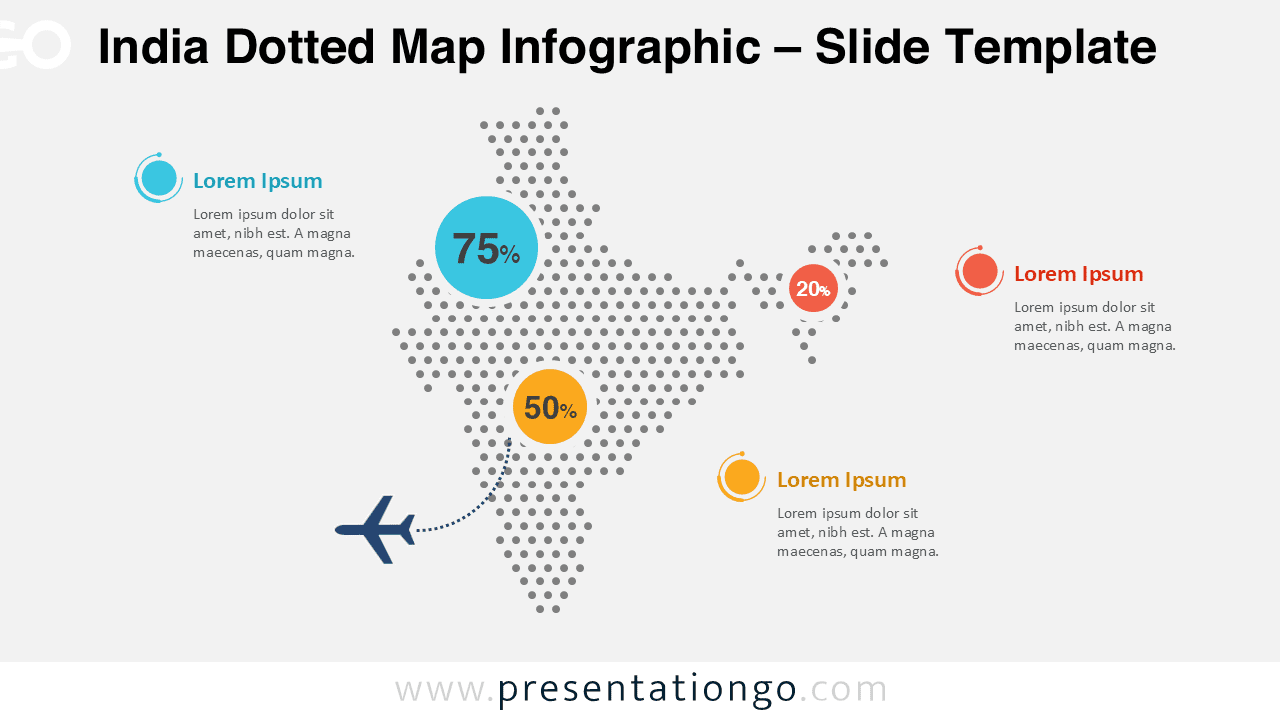
Download a free India dotted map infographic for PowerPoint and Google Slides. Perfect for data visualization, geography, and business reports.
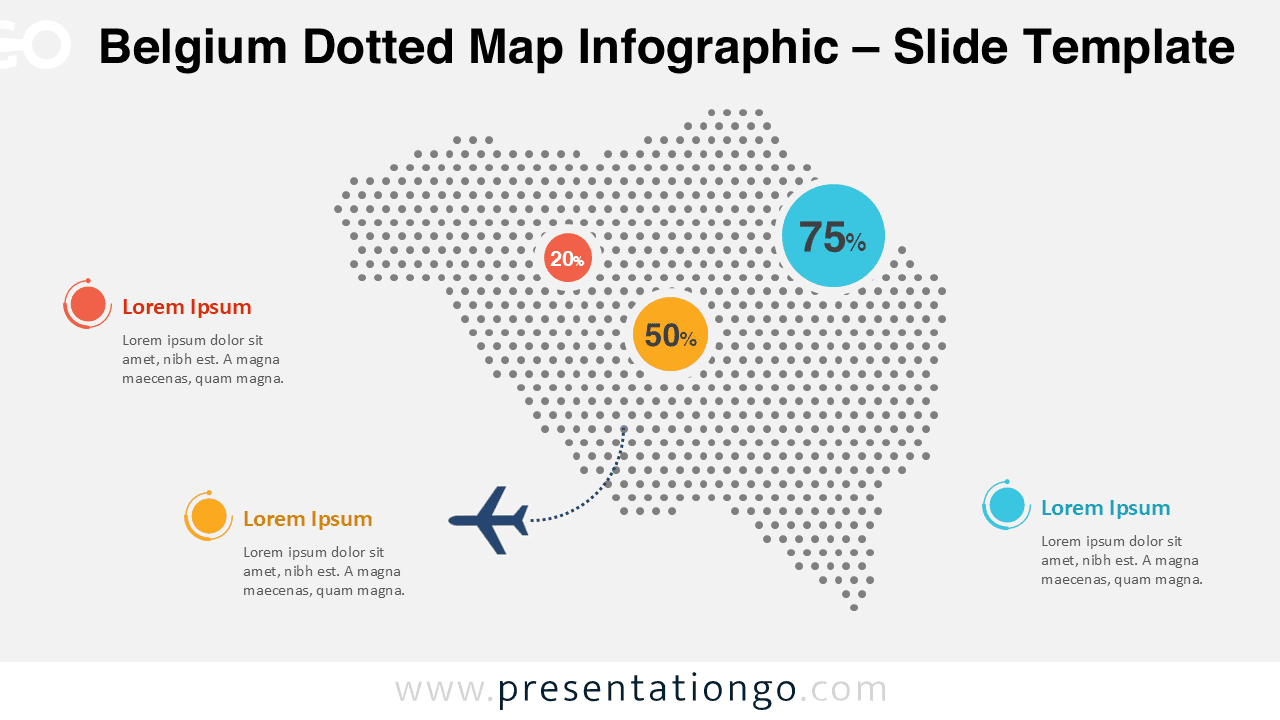
Download a free Belgium dotted map infographic for PowerPoint and Google Slides. Perfect for geographic data, reports, and business presentations.
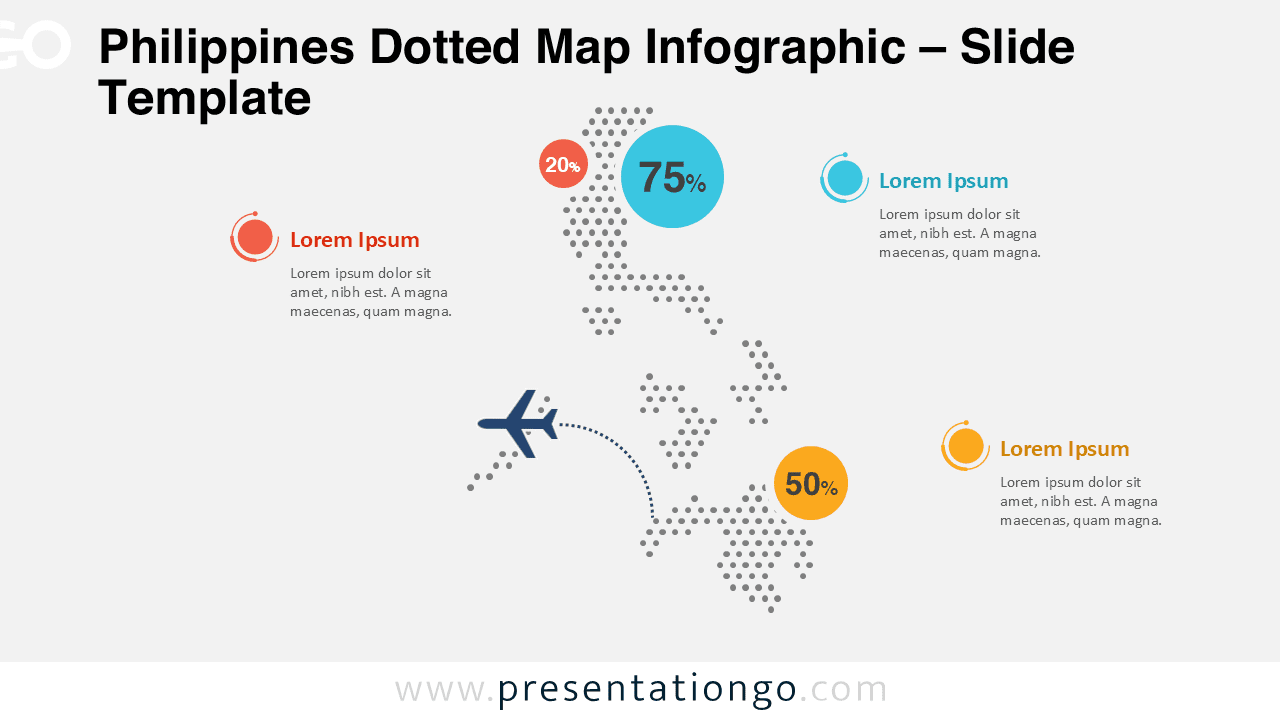
Download and use the Philippines dotted map infographic in PowerPoint and Google Slides to visualize geographic data with clean, modern design.
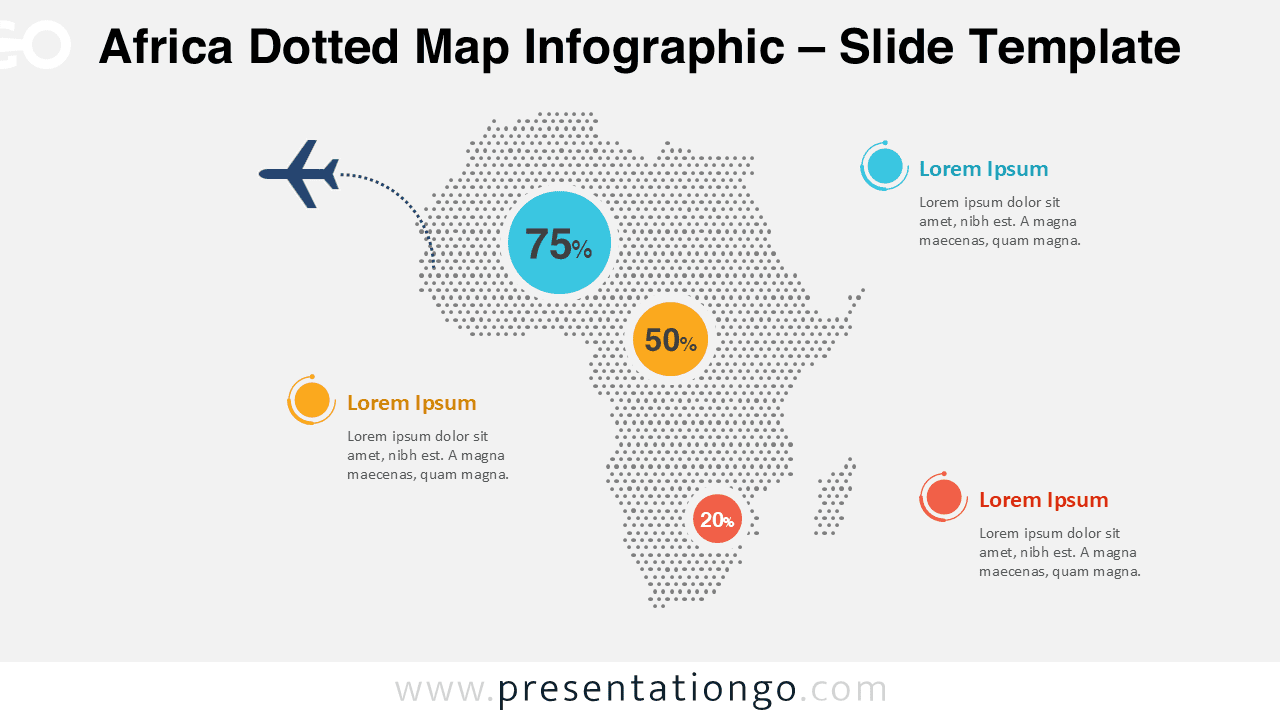
Download an editable Africa dotted map infographic for PowerPoint and Google Slides. Perfect for reports, strategy decks, and regional overviews.
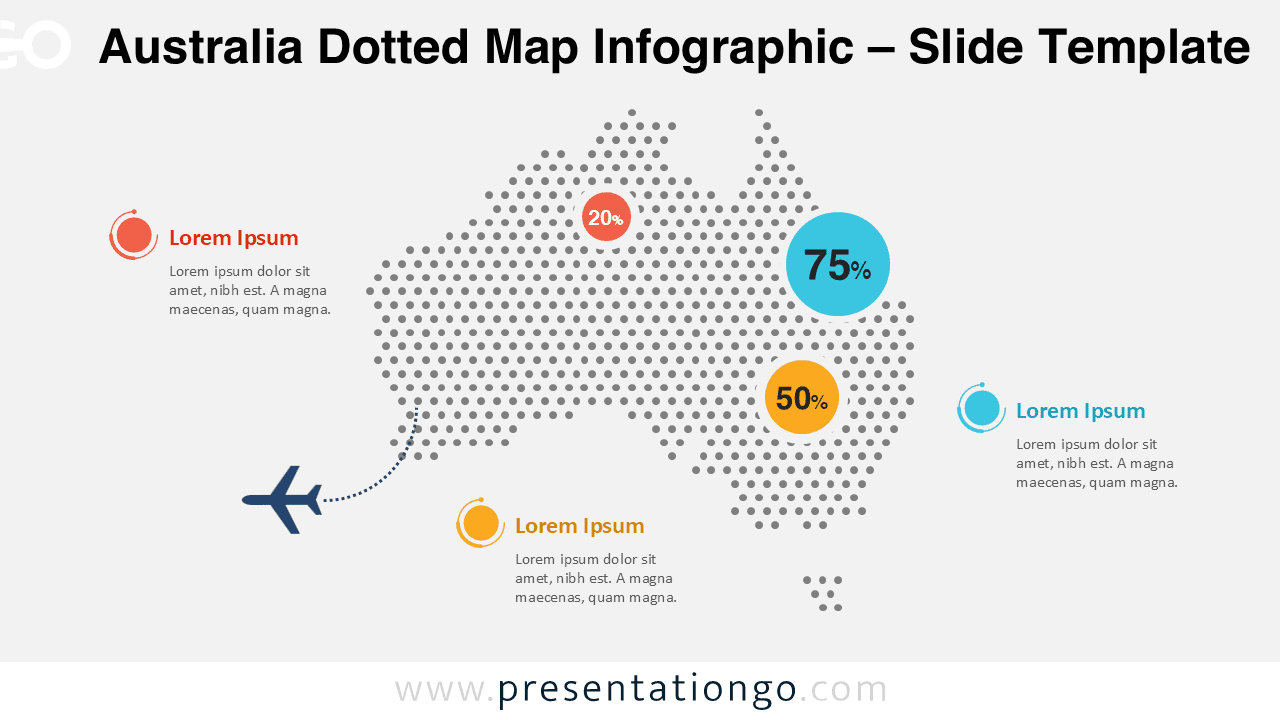
Download a free Australia dotted map infographic for PowerPoint and Google Slides. Editable data markers, clean design, and light and dark versions.
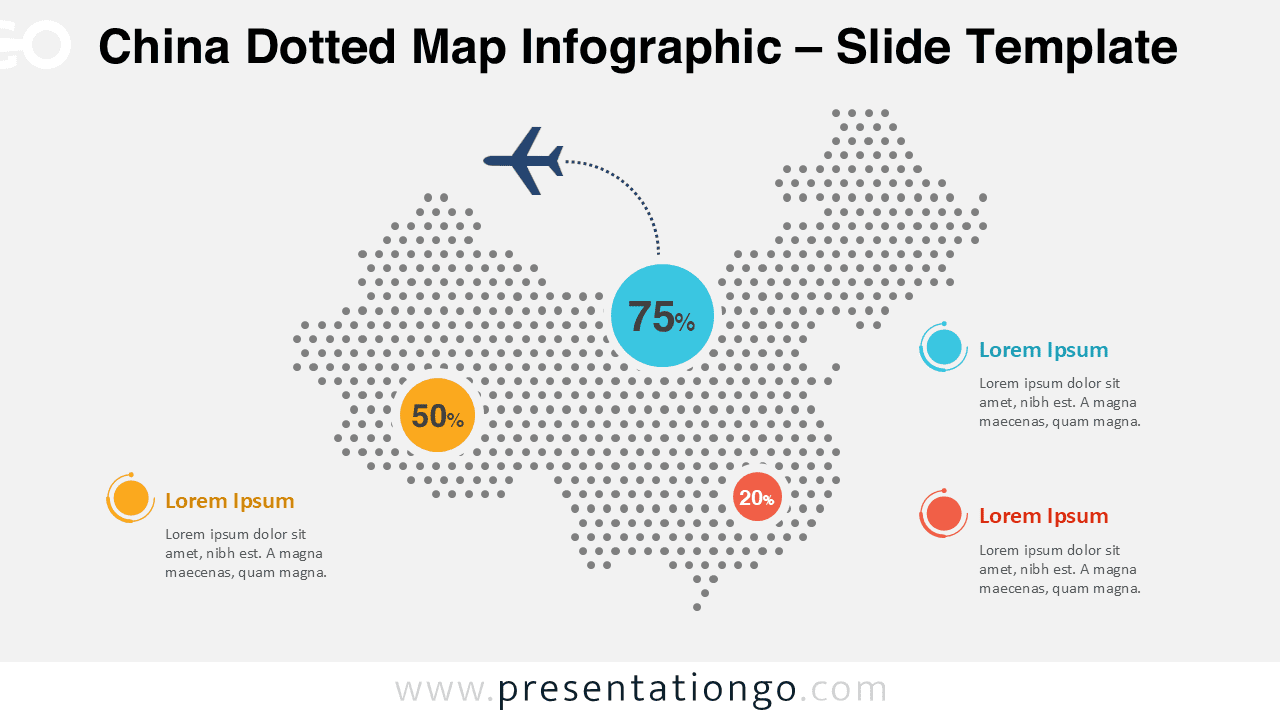
Download a China dotted map infographic with editable elements for PowerPoint and Google Slides. Ideal for data, geography, and business presentations.
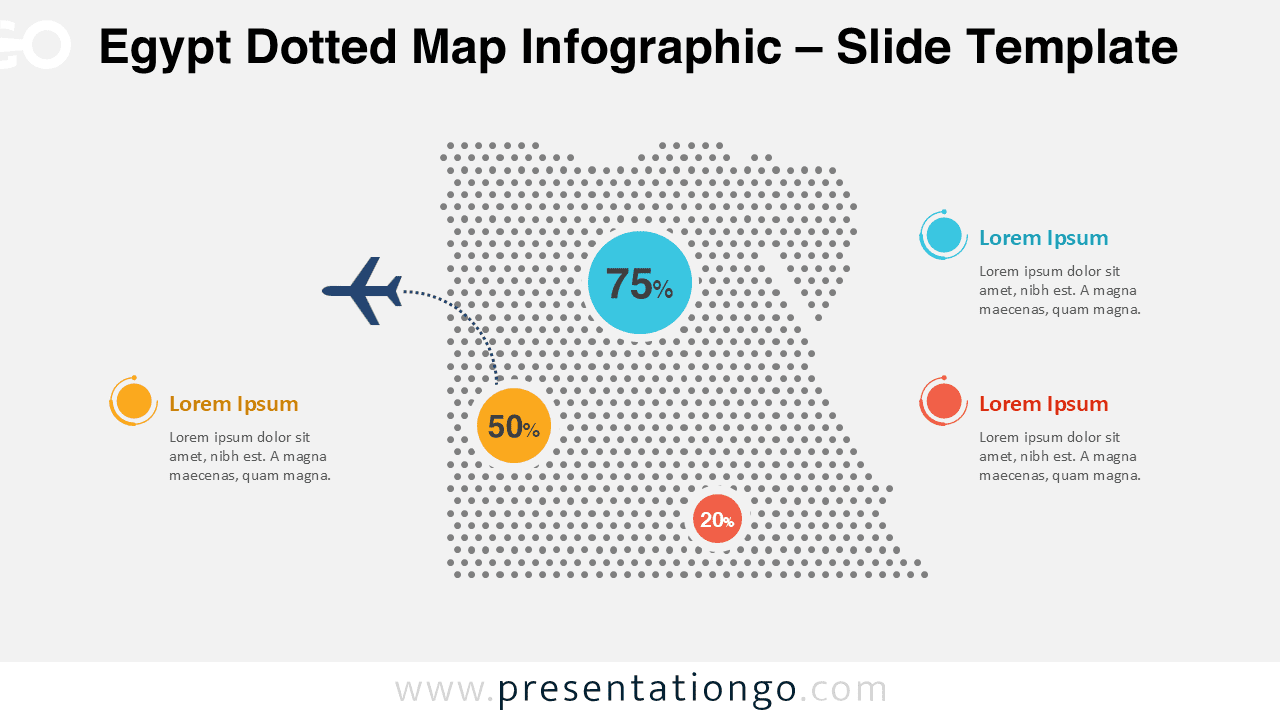
Download a free Egypt dotted map infographic for PowerPoint and Google Slides. Editable shapes, data points, and light or dark slide versions included.
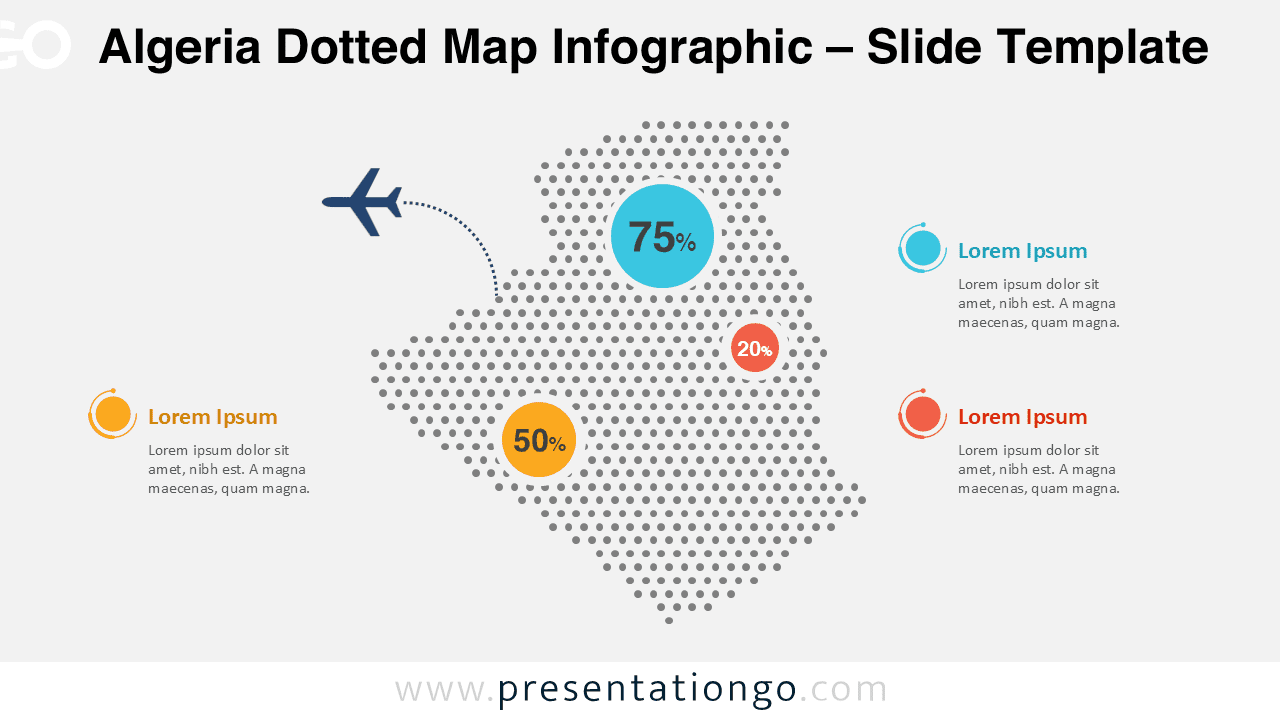
Algeria dotted map infographic with editable elements and clean layout. Compatible with PowerPoint and Google Slides.
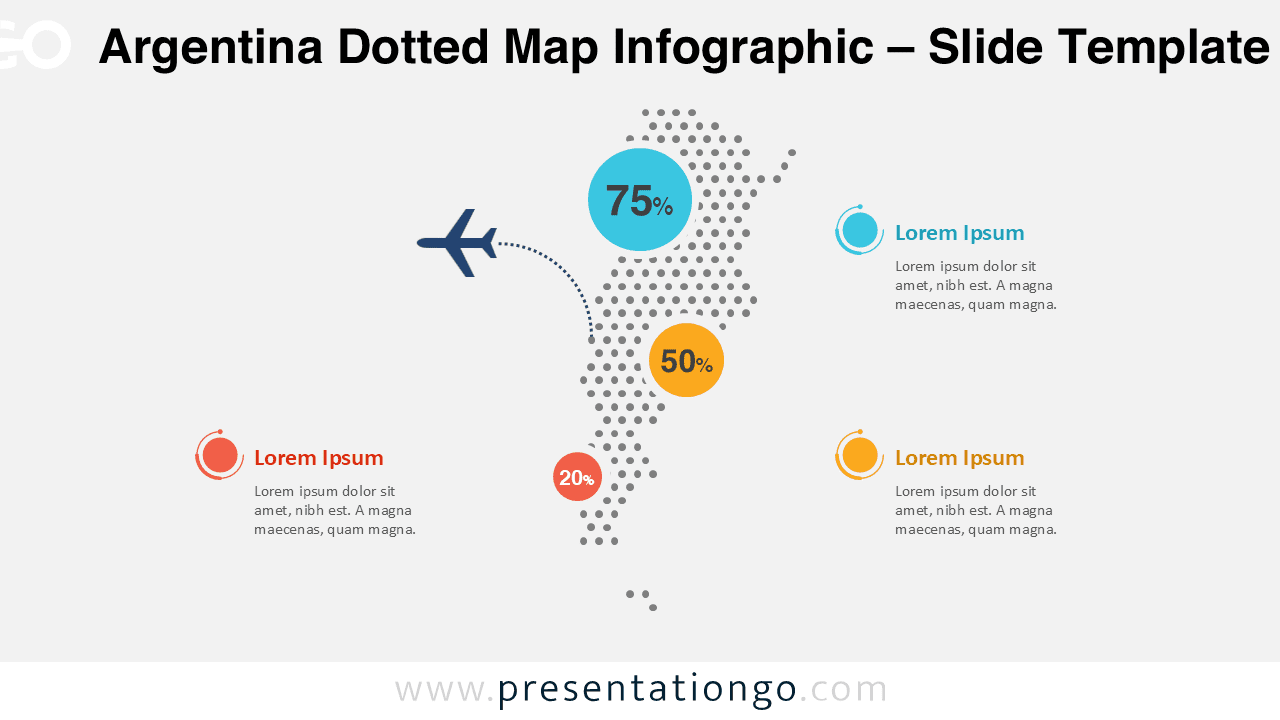
Visualize country-level data with this Argentina dotted map infographic. Fully editable and compatible with PowerPoint and Google Slides.
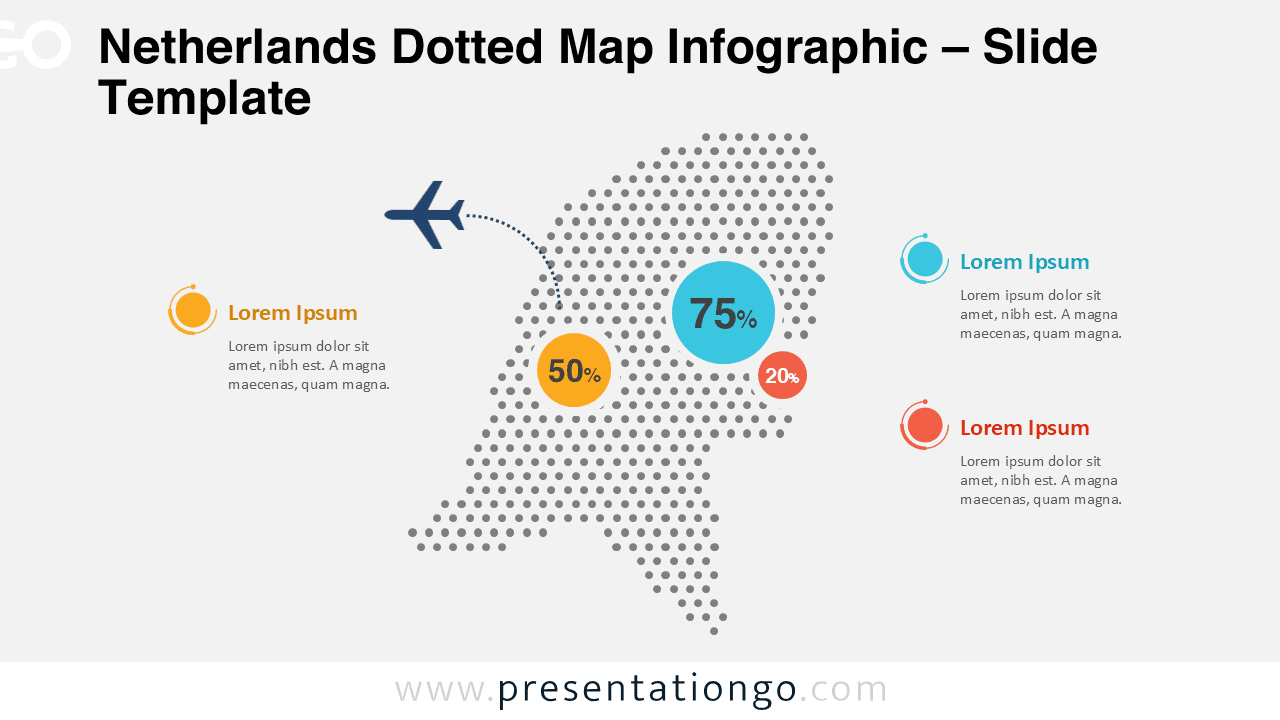
Download a free Netherlands dotted map infographic for PowerPoint and Google Slides. Editable shapes, data markers, and light or dark slides.
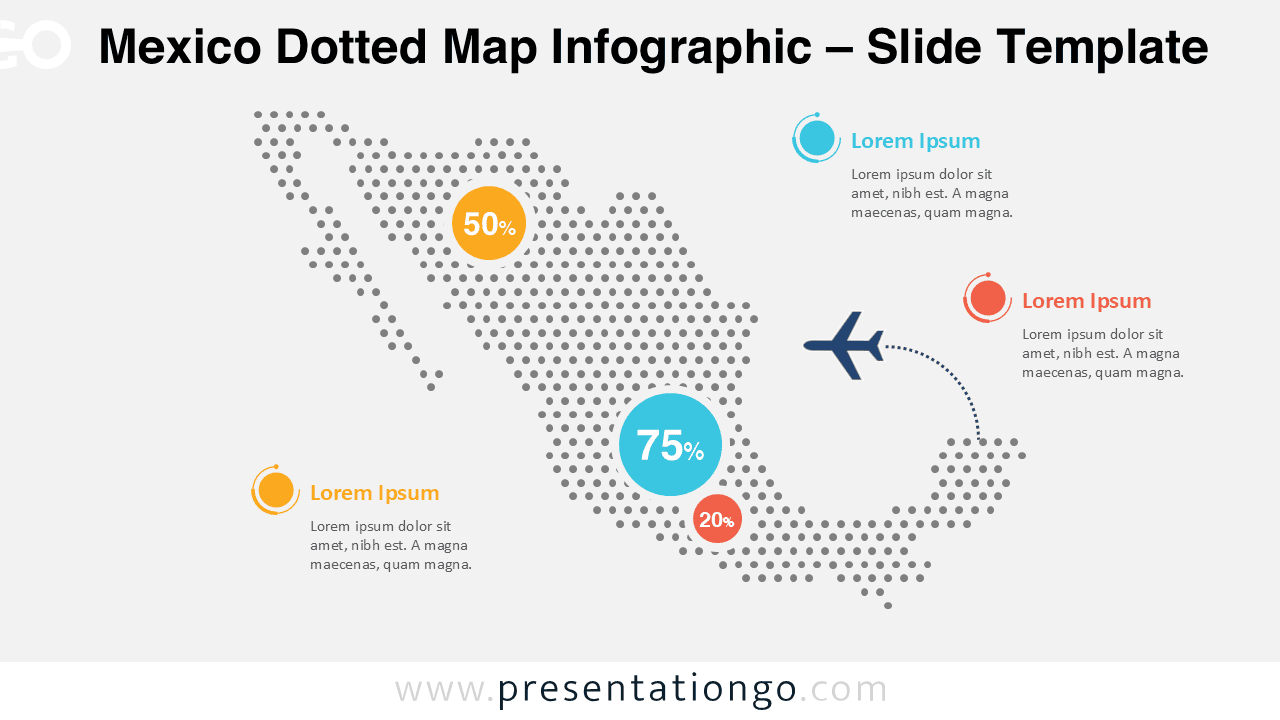
Download the professional Mexico dotted map infographic for PowerPoint and Google Slides, ideal for business and regional data visualization.
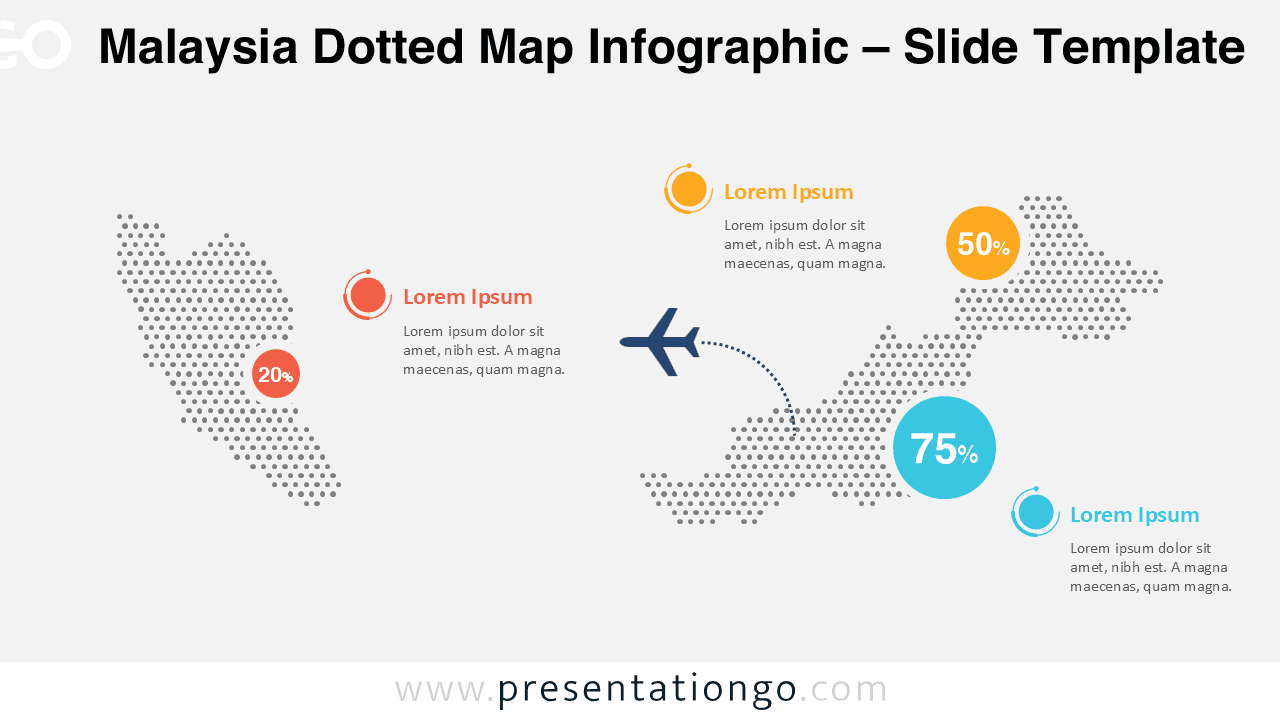
Visualize regional statistics with a Malaysia dotted map infographic. Fully editable, scalable, and compatible with PowerPoint and Google Slides.
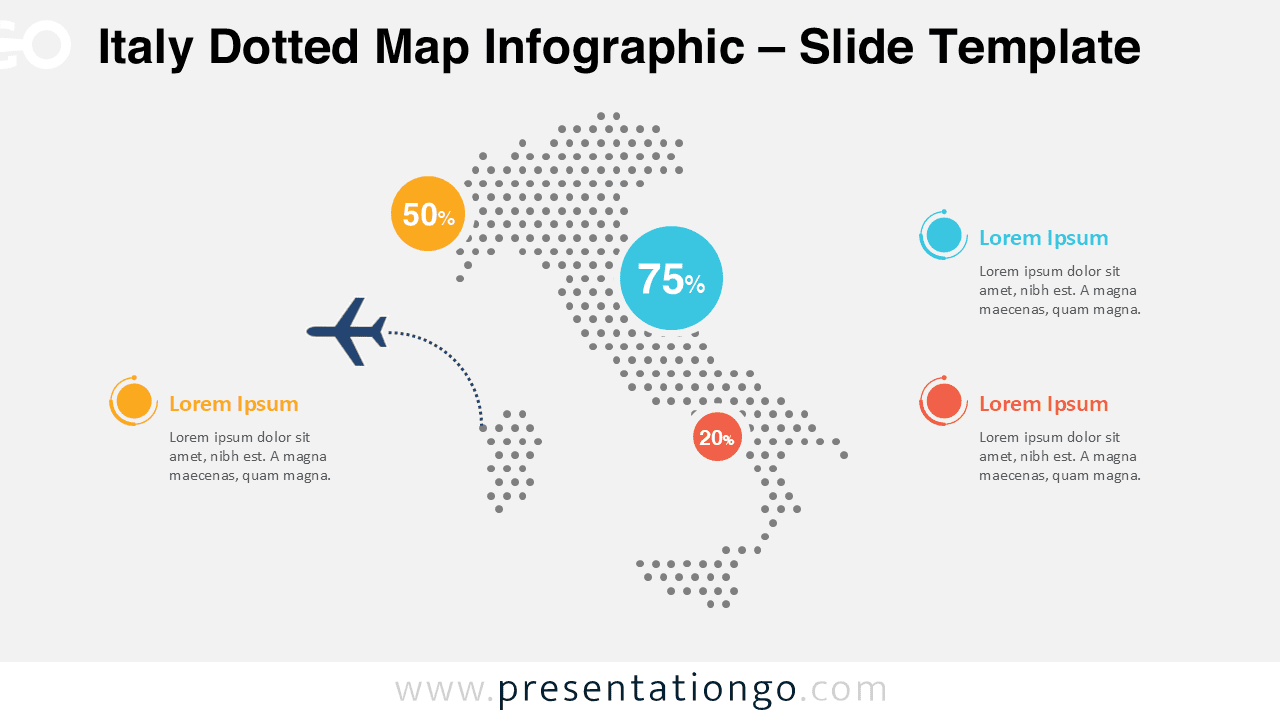
A modern Italy dotted map infographic for PowerPoint and Google Slides, ideal for statistics, business reports, and regional analysis.
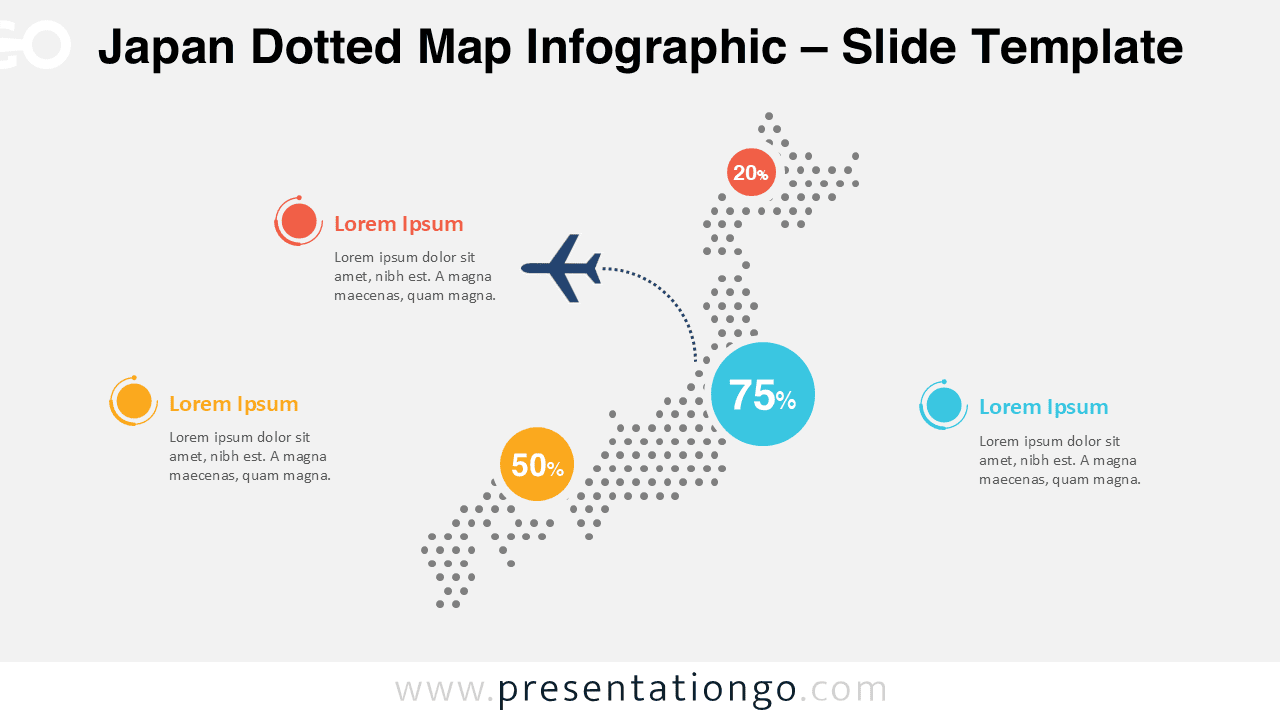
Present geographic data clearly with a Japan dotted map infographic for PowerPoint and Google Slides. Fully editable and easy to customize.
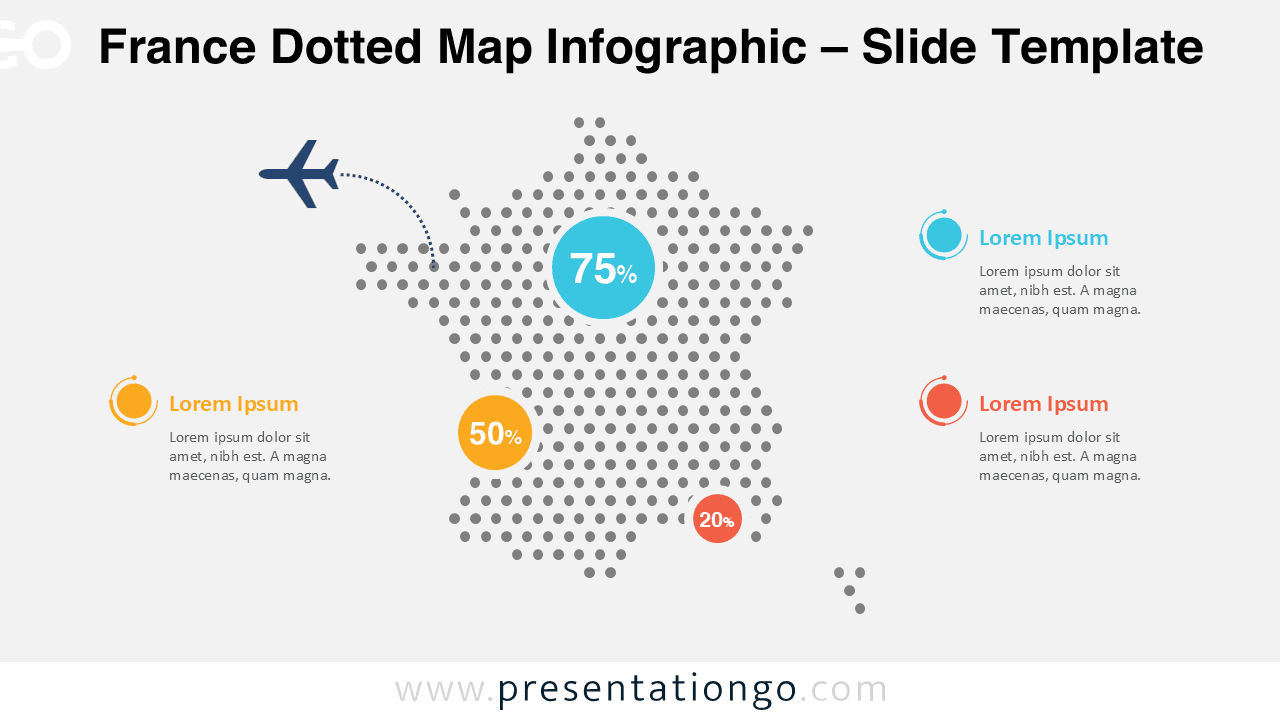
Download the modern France dotted map infographic for PowerPoint and Google Slides, perfect for data-driven reports and regional analysis.
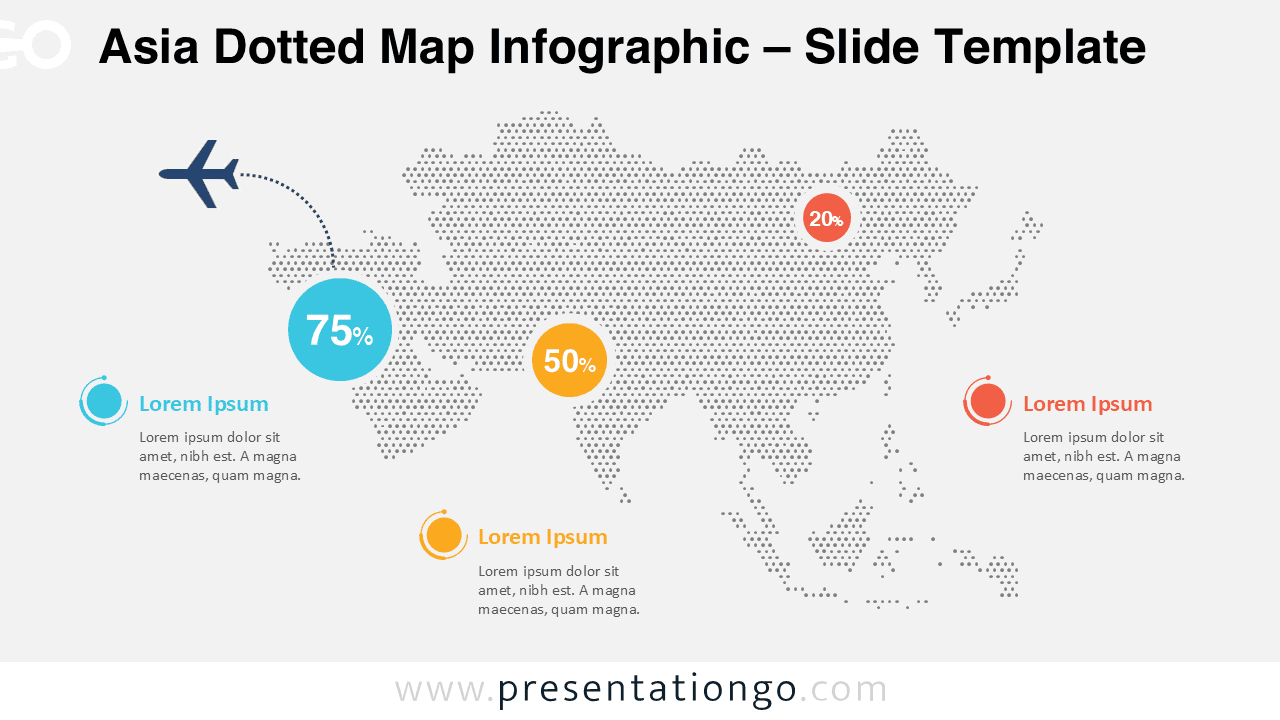
Highlight data across Asian regions with this free Asia Dotted Map Infographic for PowerPoint and Google Slides. Fully editable.
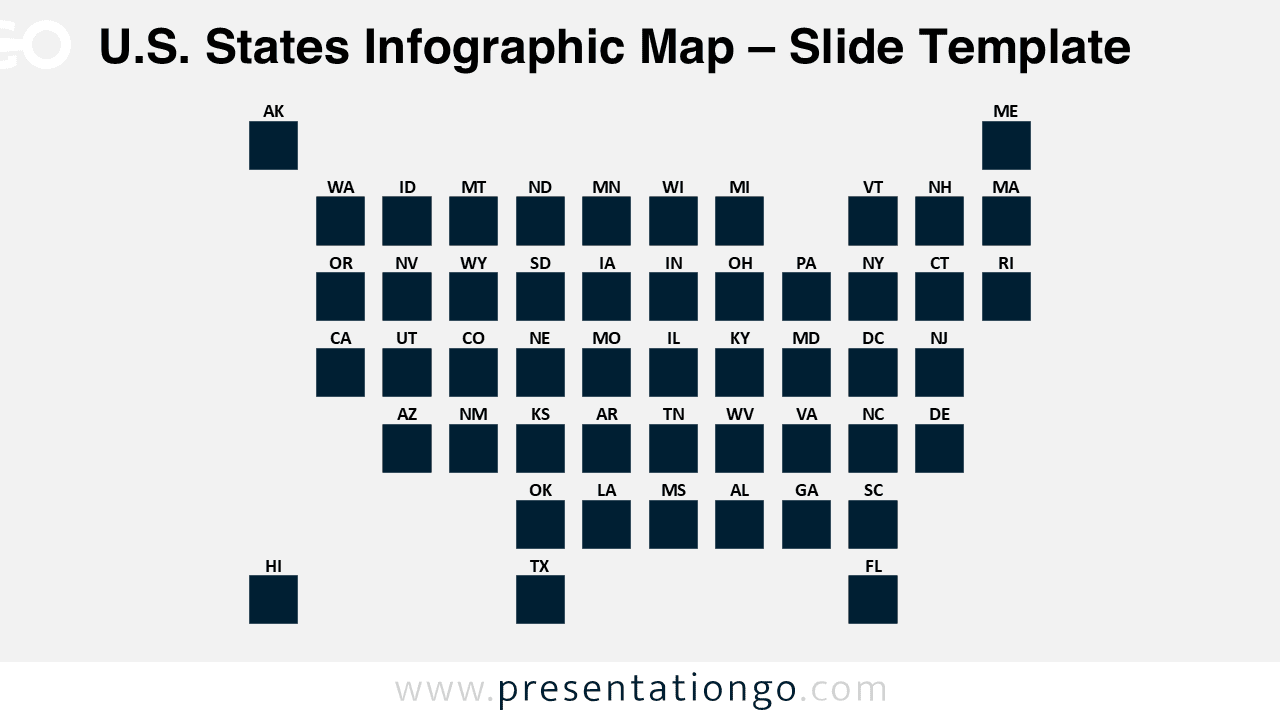
The U.S. States Infographic Map for PowerPoint and Google Slides offers a clean grid design for comparing all 50 states. Download for free.